Early Formation and Late Merging of the Giant Galaxies
Abstract
The most luminous galaxies in the present Universe are found at the centers of the most massive dark matter haloes, rich galaxy clusters. In the CDM cosmology, such massive halo cores are present at redshift with a comoving number density (as a function of mass interior to kpc) that is comparable to today’s value. The identity of the matter in these central regions is, however, predicted to change as major mergers bring together stars and dark matter from initially well separated sub-units. We use N-body simulations to investigate how these mergers push pre-existing matter outwards in the dominant galaxy while preserving the inner density profile of collisionless matter. It appears that the central regions of large galaxies end up dominated by stars formed in a number of dense cores, well before the last major mergers. The density profile of collisionless matter (stars and dark matter combined) in these central regions appears to be stable and to have attractor-like behavior under merging. This suggests that the baryon loading associated with dissipative contraction and star formation may be erased as subsequent mergers drive the mass distribution back to a universal profile. Such suppression of the effects of baryon loading, along with the early assembly of mass concentrations, may help resolve some apparent challenges to the CDM model for structure formation.
1 Introduction
Recent merger-driven evolution of the most massive galaxies was under discussion well before the introduction of the Cold Dark Matter (CDM) model for structure formation (see for example Toomre & Toomre 1972, §VII.b; Ostriker & Tremaine 1975), and has long been recognized as an important process within the CDM model (Frenk et al. 1985). A less widely discussed aspect of this model is that dark matter halos with characteristic velocities and comoving number densities characteristic of the luminous parts of large galaxies form at redshifts well above unity (Loeb & Peebles 2003). The dichotomy – very significant events in the history of the massive galaxies at low and high redshift – may be mirrored in the observational data: there is clear evidence for merging and evolution beyond aging of the star populations at redshift , and clear evidence also for the presence of giant galaxies with old star populations at redshifts well above unity (Conselice et al., 2003).
We discuss the relation between these two aspects of galaxy formation in the CDM model by combining arguments based on analytic fitting functions and on direct numerical N-body simulations. The early formation of mass concentrations similar to those in the luminous parts of the most massive present-day galaxies is reviewed in §2. In §3 we present CDM simulations which have sufficient resolution to follow the assembly of the regions which house the central dominant galaxy in observed rich clusters. The details of this assembly are analyzed in §4. Mergers among massive halos at redshifts between 0.5 and 4 bring more matter into the innermost kpc than remains from the dominant progenitor at higher redshift. Logical and observational consistency with the early formation of massive systems leads to three conditions. First, most of the matter present in the centers of the dominant halos at has to be displaced outwards during mergers. We show this effect in the simulations. Second, the hierarchy of mergers has to preserve the stellar concentration within radii kpc. This may reflect the fact that in merger simulations the dense regions (where stars seem most likely to form) tend to end up in the dense regions of the merger remnant. We present in §4 a statistical measure that illustrates this preservation effect. Third, the characteristic density profile of a virialized halo of collisionless matter has to be stable under a sequence of disturbances from major mergers. As discussed in §4.3, this attractor effect is supported by the simulations. An important observational consequence may be the suppression of the adiabatic baryon loading associated with gas cooling and star formation.
Our central conclusion is that in the CDM cosmology giant galaxies exist at redshift with close to the present comoving number density, in terms of the total mass measured within physical radius kpc. At this time they may have up to half the present star mass in this region. This would be quite different from the indications from at least some semi–analytic models for galaxy formation (e.g. Baugh et al. 1998, figure 13), but in line with a considerable variety of – though not all – observational indications (as reviewed in Peebles 2002). Further considerations on whether our interpretation of the CDM model agrees with the observations are presented in §5.
Throughout this paper, we assume the standard CDM cosmological parameters , , , , , and Hubble constant with .

2 Formation of Mass Concentrations Characteristic of the Most Massive Galaxies
Analytic fitting functions can be combined with analytic formulae for halo abundance to make CDM predictions for the characteristic mass density run in rare, very massive halos. In Figure 1 we show results for halos assumed to have a fixed comoving number density, corresponding to physical density ; the profiles are plotted at redshifts corresponding to factor of two steps in the cosmological expansion factor . The most striking impression from this plot is how little the mass distribution changes in the inner regions after . Fukushige & Makino (2001) were led by their numerical simulations to propose that that the run of density in physical units in the inner power law part is approximately independent of time, a behavior suggested previously by the simple theoretical model of Syer & White (1998) for the assembly of halos through merging. Loeb & Peebles (2003) were independently led to the same proposal from the fitting function analysis in Figure 1.
This figure, computed as described in Loeb & Peebles (2003), is based on the Press-Schechter mass function (including the modification by Sheth & Tormen 1999; see also Sheth, Mo & Tormen 2001) and analytic density profiles. The Navarro, Frenk, & White (1997, hereafter NFW) shape with concentration parameter is used in the top panel, while the Moore (Moore et al. 1999; Ghigna et al. 2000) profile with concentration is used in the bottom panel. (See Klypin et al. 2001 for the conversion factor, 1.72, between the two profiles.) Clearly, the mass in the inner kpc of these rare halos is predicted to evolve very little for . That is, according to the CDM model, massive cores similar to those which house the largest present-day galaxies already existed just one billion years after the Big Bang. We will see in the next section that our simulations of CDM bear out this result from the fitting functions.
3 High Resolution Simulations of Massive Halo Assembly
The numerical results in this paper are based on a set of 8 simulations of the formation of a massive galaxy cluster halo in our standard CDM model. These 8 halos, which are part of the suite of simulations analysed in Navarro et al (2003), range in virial mass between and . They are chosen from a simulation of a representative cubic region of side Mpc (the VLS simulation of the Virgo Consortium, see Jenkins et al. 2001 and Yoshida Sheth & Diaferio 2001), which contains 41 halos with mass exceeding . Our objects thus have an effective abundance of . This is the observed present-day abundance of galaxies with luminosity greater than . Almost all such systems are indeed the central dominant galaxies within rich clusters.
We resimulated each of our 8 halos, as in Navarro, Frenk & White (1997), with greatly improved resolution in the cluster and its immediate environment and with degraded resolution outside this region. The mass of an individual dark matter particle in the high resolution region is and the gravitational softening parameter is kpc in comoving units. The simulations were carried out with the publicly available parallel N-body code GADGET (Springel, Yoshida & White 2001).
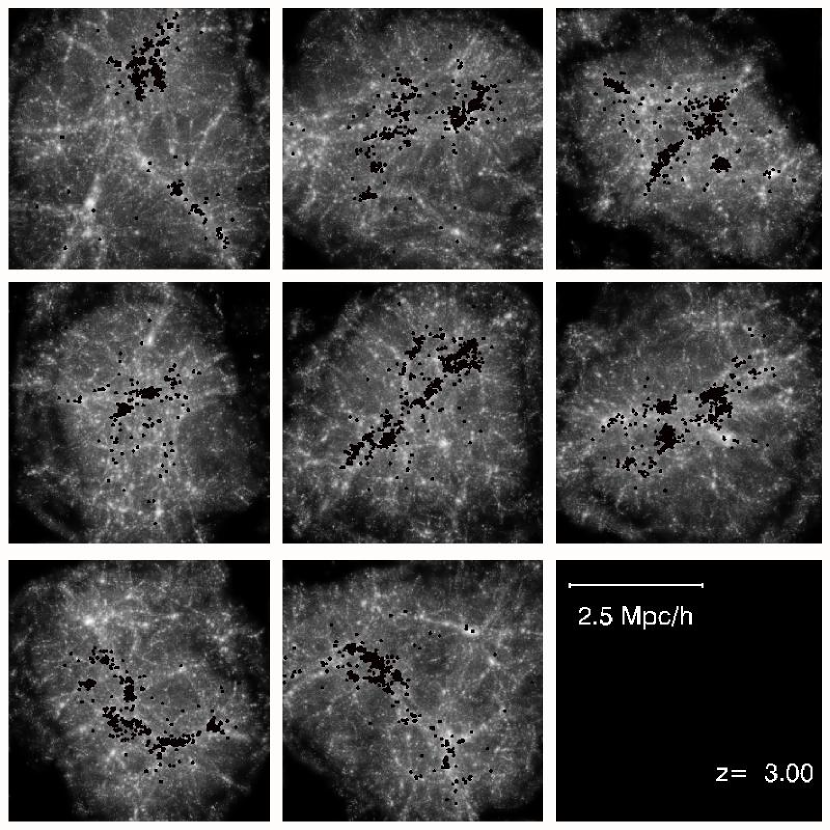
We show images of the evolution of the mass distribution in these 8 halos in Figure 2. The three sets of panels show the halo material at three different redshifts, and 3. Each panel is Mpc across in physical (not comoving) units. Each shows only the matter which is within of the cluster center at , so that the same particles are used to make corresponding images in each of the three sets. As usual, we define to be the radius within which the mean enclosed density is 200 times the critical value. It is striking that although all the halos are centrally concentrated and relatively regular at , the material which makes them up was in all cases in several disjoint and well separated pieces at and was in many pieces at .
In the images in Figure 2 the particles which lie within kpc of halo center at are shown in black in all three sets. It is remarkable that in all cases these particles also come from several different objects at . The same is true even at in many cases. We analyse the details of core assembly in more detail in the next section.
The stability of the central mass concentrations predicted in §2 can be seen directly in these simulations. Figure 3 shows the mass within physical radius kpc around the center of the most massive progenitor of the final halo at discrete time steps and in each of the 8 simulations. Notice that the vertical axis is linear in these plots. The variations in mass are relatively small and show no consistent trend for , corresponding to . This is in good agreement with Figure 1. That is, the CDM model predicts that at there is little evolution of the mass within a radius characteristic of the luminous parts of the largest galaxies. Note, however, that the object plotted in each panel is not the same at each time: the most massive progenitor of a cluster at does not necessarily evolve into its most massive progenitor at which may not evolve into its most massive progenitor at . We indicate this effect in the plots; working back from , we toggle the plotting symbol between filled and open each time the most massive progenitor changes identity.
![[Uncaptioned image]](/html/astro-ph/0312499/assets/x2.png)
![[Uncaptioned image]](/html/astro-ph/0312499/assets/x3.png)

4 Mergers and Relaxation at Low Redshifts
In this section, we consider the predicted rearrangement of matter in the cores of pure CDM halos at low redshift, and then discuss why the stars in giant galaxies might be expected to remain concentrated in the centers of the halos as observations require. Finally, we consider the idea that the net mass distribution in stars plus dark matter, both considered as collisionless particles, tends to relax toward the NFW form.
4.1 Rearrangements of the Dark Matter
Loeb & Peebles (2003) discuss the evolution of the halo structure shown in Figure 1 in terms of an “inside-out” growth process, whereby mass is added to galaxies in “onion shells” with declining density as a function of cosmic time. This can indeed reproduce the behavior in Figure 1, but cannot be the entire story because, as Figure 2 shows, late mergers add material even to the very center of the main halo and so must affect the distribution of the other matter there.
Figure 4 makes this point more quantitatively. We identify the particles which are within 10kpc of the center of each cluster halo at , and we then follow them back in time. The circles in each panel show the fraction of these particles which are already within kpc (physical) of the center of their dominant concentration at each earlier redshift. (We identify the center of this dominant concentration by calculating the gravitional potential of each particle in the set due to all the others, and then choosing the most bound particle.) Note that the dominant concentrations used to make this plot are often not the most massive progenitors which were used to make Figure 3. Both figures illustrate the point that, in the CDM model, mergers at low redshifts have a substantial effect on the innermost regions of large halos. Only – of the mass that now lies within kpc of the center of a massive halo was closer than kpc to their dominant concentration at , and typically no more than was closer than kpc at . The rest of the mass was added to the cores by late mergers. These major mergers are visible in Figure 4 as abrupt changes in which are often accompanied by large fluctuations in the mass within kpc.

The matter present in the central kpc of each massive concentration at high redshift must have been displaced to make room for the matter subsequently added by mergers. We illustrate this process in Figure 5. We start by selecting all particles within kpc (physical) of the center of the most massive progenitor of each halo at . Since many of these particles have apogalactica well outside kpc, we plot their cumulative radial distributions at after they have had time to phase-mix around their orbits. We then identify this same set of particles at a series of later times and plot the cumulative radial distribution about the center of their dominant concentration. (This center is defined as the most bound particle of the set, as above.) One sees a systematic trend for these distributions to broaden with time, the median distance typically increasing by a factor of about two from to the present. Notice, however, that in two of the eight cases the dominant concentration of these particles at is not at the center of the main halo, but at the center of one of its more massive subhalos.
The late assembly of the matter which does finally end up at halo center is illustrated by the complementary plot in Figure 6. Here we again select all particles which are within kpc of halo center at and then plot cumulative radial distributions about the center of their dominant concentration at a series of earlier times. (These are the same particle sets and center definitions used to make Fig. 4.) We plot the lowest redshift curves for rather than for in order to show a properly phase-mixed, quasi-equilibrium distribution. There is little evolution subsequent to in 7 cases, subsequent to in 3 cases, and subsequent to in one case. At higher redshifts, however, substantial fractions of the particles are further than kpc from center of the dominant concentration in all cases. This behavior reflects the late addition of matter to the cores of the galaxies, as already illustrated in Figure 4.


4.2 The Distributions of Stars
The star populations in giant ellipticals are typically old (a familiar and well established observation, as evidenced by the discussions by Oke 1971, 1984 and Hamilton 1985; for recent data see Bernardi et al. 2003). Once formed, stars behave dynamically as collisionless matter. Since stars make substantial contributions to the mass within the half-light radii kpc of massive galaxies (Romanowsky et al. 2003, and references therein) merger-driven rearrangements of matter must not have substantially diluted the central concentrations of stars by the addition of nonbaryonic dark matter. A full analysis of the predicted effect of dilution is beyond the scope of this paper – and perhaps beyond what is now computationally feasible – but we can offer two simple relevant considerations. First, the condition that dilution is modest is in line with the familiar tendency in numerical simulations for the dense parts of merging halos to end up in the dense parts of the merger remnant (White 1980; Barnes 1992; Dubinski 1998).
The second consideration is based on the same sets of particles already used in Figures 4 and 6, namely those particles that are within kpc of the center of each dominant halo at . Figure 7 shows the evolution with redshift of the cumulative distribution of ambient physical density around each of these particles, estimated by means of a standard SPH spline kernel which averages over the positions of the 25 nearest neighbors. Note that the final time shown is rather than so that the particle distribution is properly phase-mixed. The median ambient density around this particle set increases by a factor of about six from . This is a result of our selection procedure, which preferentially picks out those particles which have been scattered into the most strongly bound orbits by 2–body effects and by the violent relaxation which accompanies merging. The median ambient density for these particles at is typically about , which is 500 times the mean density at that epoch. The matter now in the central regions of a giant galaxy was thus already in the inner regions of virialised objects at , and hence could have experienced substantial star formation at that time.
This mixing process is explored in a different way in Figure 8. Among all the particles that lie within in each final cluster we identify the 1000 which have the largest ambient density at . We then plot cumulative ambient density distributions for these particle sets at lower redshifts beginning with . These distributions broaden with time as relaxation scatters particles into lower density regions. At their median ambient density is typically , which is a factor 9 smaller than at but still times the present cosmic mean density. Note that much of this broadening occurs between and , and is actually a consequence of 2–body scattering. In simulations of even better mass resolution, we would expect the reduction in density at late times to be significantly lower. It is important to realise, however, that not all these “dense” particles from high redshift end up in the central “galaxy”. Typically about 40% of them lie within kpc of the center of the final halo; most of the others lie near the center of one of its substructures. If we consider these particles to represent the matter which was already illuminated by star formation at , then the corresponding light is today associated both with the dominant central galaxy in each halo and with other cluster galaxies.
A comparison of the distribution of matter that is illuminated now in the giant galaxy with that which was plausibly already illuminated at is presented in Figure 9. This shows, for the particles used in Figure 8, the present cumulative radial distribution about the center of the final halo. In 6 of our 8 halos the largest single concentration of these “early dense” particles is in the central object, with 20% to 50% within kpc of halo center. In the remaining two objects, however, the dominant concentrations are in subhalos offset by 150 to 500 kpc from the center of the main halo, so that the bulk of the earliest stars are predicted to be in non-central galaxies.
In these rare massive halos at the virial radius (at density contrast ) is comparable to the half-light radius kpc of the bright galaxy at the center of the present day descendant. If most of the baryons then within this region had promptly collapsed to stars, the stellar mass fraction within kpc at would have been about equal to the primeval mass fraction, that is, about one fifth of the total mass within the present half-light radius. The remaining percent of the stars would have been added later, by merging with other concentrations of generally old stars. Roughly in line with this, the indication from Figure 3 is that – of the mass now interior to kpc was added at , and about half of the mass was added at . We must assume that most of the added mass was stellar, so that the core can be star-dominated today. If the mass displaced out of this radius were primarily CDM, the stellar mass interior to kpc would have roughly doubled since . Since with in the core, the effective radius of starlight would have about doubled since .


4.3 The Attractor Hypothesis
Our interpretation depends on the hypothesis of a dynamical attractor effect, that the inner cores of galaxies tend to approach, through multiple mergers, a universal density profile for their collisionless mixture of stars and dark matter. The famous paper of Lynden-Bell (1967) introduced the idea that violent relaxation of a collisionless gravitating system may drive it towards a universal structure in the same way that a classical gas in a box evolves from arbitrary initial conditions towards a spatially uniform Maxwell-Boltzmann distribution; the coarse-grained structure of the system may evolve towards an attractor. The NFW papers demonstrated behavior of this kind, apparent evolution towards a universal density profile, in hierarchical structure formation from cosmological initial conditions. Such universality clearly requires the stability of the NFW mass distribution under violent evolution through mergers, and some observational constraints suggest that such an attractor is active in reality.
In the absence of the attractor effect the dissipative settling needed to increase the baryon to dark matter ratio in the luminous parts of a galaxy would tend to make the central mass density run steeper than the NFW/Moore model, leading to two problems. First, it would seem to produce an unacceptably steep central mass density run (Jesseit, Naab & Burkert 2002; Sand, Treu & Ellis, 2002; Sand et al. 2003, and references therein). Second, it would likely produce too many galaxies with large velocity dispersions. On the other hand, if all the collisionless matter in a typical giant elliptical, dark plus stellar, were driven by mergers into a good approximation to an NFW profile, it would certainly help relieve the apparent challenge to the CDM model from the central mass density run in clusters. Also, it would allow consistency between the comoving number density of massive halos as a function of velocity dispersion at radius kpc) and SDSS counts of galaxies as a function of stellar velocity dispersion (as illustrated in Figure 2 of Loeb & Peebles( 2003) using the data from Sheth et al. (2003)). The attractor hypothesis was invoked by Loeb & Peebles (2003) specifically to help resolve these two observational issues.
A similar argument is given in a recent paper by El-Zant et al (2004). These authors performed simulations of idealised NFW clusters in which the galaxies are represented by a population of “massive clumps”. As the clumps spiral to cluster center, their energy losses cause the central NFW cusp to flatten in agreement with an analytic model proposed by El-Zant, Shlosman & Hoffman (2001). This effect also occurs in our own simulations as massive substructure clumps merge into the central region, but in our case the clumps are not rigid and are progressively disrupted as they move in. Stellar galaxies can clearly be disrupted in like manner, but they are expected to be more resistant to stripping than their dark matter halos as a result of the dissipative concentration which produced them (White & Rees 1978). It is thus unclear whether the El-Zant et al. approximation of “unstrippable” galaxies is more or less realistic than our own neglect of baryonic gravity. The main point, perhaps, in the current context is that both approaches suggest that the total mass distribution remains NFW-like in the inner regions with the dark matter distribution expanding to compensate for the central concentration of the stars.
In the attractor hypothesis the usual correction for compression by stellar mass added through dissipative settling would apply only to stars formed out of baryons added after the last major merger. Figure 3 indicates that the central mass distributions in massive galaxies typically have been rearranged by at least one major merger at . Our hypothesis then requires that most of their stars formed earlier than that.
Some elliptical galaxies at do show evidence for recent star formation (Jørgensen 1999; Trager et al. 2000; Menanteau, Abraham, & Ellis 2001; Fukugita 2003), which might be the result of accretion or of recycling of matter shed by stars within the galaxy. The amount of mass added or rearranged by recent star formation is generally thought to be only –, however, and so is not likely to greatly disturb the attractor solution.
5 Open Issues
The idea that some large ellipticals formed by merging of late-type galaxies has been under discussion for many years (e.g. Toomre & Toomre 1972; Ostriker 1980; Negroponte & White 1983; Schweizer 2000). Under the attractor hypothesis, an elliptical that formed by the merger of gas-rich galaxies with a subsequent starburst, perhaps the typical path in galaxy groups, might be expected to show significant baryon loading effects on its total density run; an elliptical that formed by mergers of less gas-rich early-type galaxies, perhaps the more common pattern for cluster ellipticals, would show fewer baryon loading effects. We are not aware of observational tests of this possible systematic difference between in field and cluster galaxies, although possibly related differences are seen between the central density runs of bright and faint ellipticals (Faber et al 1997) and between the core colors of cluster and field ellipticals (Menanteau, Abraham & Ellis 2001).
A related issue is the meaning of the strikingly small differences between the spectra and mass-to-light ratios of cluster and group ellipticals, as illustrated by Hogg et al. (2003) and van Dokkum & Ellis (2003). A detailed analysis of this effect within the CDM model would be challenging, and certainly desirable. A first analysis by Kauffmann & Charlot (1998a) shows qualitative agreement with the data but a quantitative difference between cluster and field which may be larger than observed.
There has been a long debate over observational constraints on the formation timescale for the mass concentrations corresponding to the luminous parts of present-day giant galaxies (e.g. Peebles 1989; White 1989; and references therein). Radio galaxy surveys provide convincing evidence for the presence of old massive galaxies at redshifts (Lilly & Longair 1984; Nolan et al. 2003; Willott et al. 2003). Massive high redshift protogalaxies are likely hosts for the black holes that power the SDSS quasar population at (Fan et al. 2003; Wyithe & Loeb 2003). On the other hand, a number of recent attempts to measure the evolution of the mean stellar density contributed by massive galaxies have concluded that only half the current stars are present at to 1.5 and only a tenth at to 4 (Drory et al. 2003; Bell et al. 2003; Dickinson et al. 2003; Stanford et al. 2003). Estimating the number density and stellar mass of giant galaxies at high redshift poses a severe observational challenge, however, and the current situation is confused. Thus Bell et al. (2003) find that the stellar mass in their red sequence of galaxies has increased by a factor of two since redshift , but Pozzetti et al. (2003) see no significant evolution of the stellar mass function of massive galaxies over the same redshift interval.
There also is continuing debate over the relation of the observations to current theoretical models. Kauffmann & Charlot (1998b) find a considerable difference between the redshift distributions predicted for K-selected samples by the assumption of pure luminosity evolution out to high redshift and by a semianalytic CDM model for galaxy formation. They conclude that the observations favor the latter. Somerville et al. (2003) find much smaller differences between their own versions of these two models, the predicted redshift distributions differing insignificantly at . At higher redshift their hierarchical model predicts fewer galaxies than their pure luminosity evolution model, with the observations lying between the two. Our own analysis indicates that in the CDM model the stellar mass in a giant galaxy at could be as much as half the present value. This is considerably less rapid evolution than is claimed by many authors, but is significantly later assembly than pure luminosity evolution assumes. We emphasise that the CDM model does produce enough massive objects at early times to account for the highest redshift galaxy clusters, massive galaxies and luminous quasars (Efstathiou & Rees 1992, Mo & White 2002). The debate is whether current treatments of star and black hole formation adequately represent the predictions of the CDM cosmology, and, of course, whether these predictions are compatible with the observed numbers of massive objects at high redshift.
The numerical simulations used in this paper suggest the typical cD galaxy has suffered significant merging events at redshifts less than unity. The cluster Abell 2199 (Minkowski 1961) has long been considered a likely example of galaxies observed in the act of merging, and the cluster C0337 at may be another case (Nipoti et al. 2003). The number of candidate merging systems of this type is not large, however. It would be of considerable interest to use numerical simulations to develop diagnostics of the appearance of recently merged, massive, early-type galaxies. These could then be used to check the high merger rate of the CDM cosmology.
Our discussion highlights two systematic effects of purely gravitational halo formation. First, the form for the halo density run behaves as a dynamical attractor (Navarro, Frenk & White 1997; Huss, Jain & Steinmetz 1999). Second, the mass within a fixed physical radius around the most massive halos evolves little with time after reaching a density contrast on the order of 100 (Fukushige & Makino 2001; Loeb & Peebles 2003). Both effects are supported by numerical simulations, but have not been fully checked in the specific context of baryon settling. Existing simulations of mergers of spirals embedded within NFW-like halos do produce remnants whose inner regions are closer to NFW than those of their progenitors, despite remaining dominated by stars (Barnes 1992; Dubinski 1998). Further simulations would be helpful, however, to check our attractor hypothesis, in particular whether a halo which is compressed relative to NFW by baryon loading relaxes back to NFW after a few major mergers.
Finally, we note that since the physics of pure gravitating systems is simple, even if their behavior is complex, there may be an analytic explanation of the systematics of halo formation discussed in this paper. Possible approaches are discussed by Syer & White (1998) and Dekel, Devor & Hetzroni (2003) among others, but a convincing explanation remains elusive.
References
- Barnes (1992) Barnes, J. E., 1992, ApJ, 393, 484
- Baugh, Cole, Frenk, & Lacey (1998) Baugh, C. M., Cole, S., Frenk, C. S., & Lacey, C. G. 1998, ApJ, 498, 504
- Bell et al. (2003) Bell, E. F., Wolf, C., Meisenheimer, K., Rix, H., Borch, A., Dye, S., Kleinheinrich, M., & McIntosh, D. H. 2003, ApJ, submitted; astro-ph/0303394
- Bernardi et al. (2003) Bernardi, M., et al. 2003, AJ, 125, 1866B
- (5) Dekel, A., Devor, J. & Hetzroni, G. 2003 MNRAS, 341, 326.
- (6) Conselice, C. J., Bershady, M .A., Dickinson, M. &Papovich, C., AJ, 2003, 126, 1183C
- Dickinson et al. (2003) Dickinson, M., Papovich, C., Ferguson, H. C., & Budavari, T., 2003, ApJ, 587, 25
- Drory et al. (2003) Drory, N, Bender, R., Feulner, G., Hopp, U., Maraston, C., Snigula, J., & Hill, G. J., 2003, ApJ, 595, 698
- Dubinski (1998) Dubinski, J. 1998, ApJ, 502, 141
- El_Zant at al. (2001) El-Zant, A. A., Shlosman, I. & Hoffman, Y., 2001, ApJ, 560, 636
- El_Zant et al. (2004) El-Zant, A. A., Hoffman, Y., Primack, J., Combes, F., Shlosman, I., 2004, ApJ, 607, L75
- (12) Efstathiou, G. P. & Rees, M. J. 1988, MNRAS, 230, 5p
- (13) Faber, S. M., Tremaine, S. D., Ajhar, E. A., Byun, Y.-I., Dressler, A., Gebhardt, K., Grillmair, C., Kormendy, J., Lauer, T. R. & Richstone, D. 1997, AJ, 114, 177
- Fan et al. (2003) Fan, X. et al. 2003, AJ, 125, 1649
- Frenk et al. (1985) Frenk, C. S., White, S. D. M, Efstathiou, G. P. , & Davis, M, 1985, Nature, 317, 595
- (16) Fukugita, M. 2003, submitted to ApJ
- Fukushige & Makino (2001) Fukushige, T., & Makino, J. 2001, ApJ, 557, 533
- Ghigna et al. (2000) Ghigna, S., Moore, B., Governato, F., Lake, G., Quinn, T., & Stadel, J. 2000, ApJ, 544, 616
- Hamilton (1985) Hamilton, D. 1985, ApJ, 297, 371
- Hogg et al. (2003) Hogg, D. et al. 2003, ApJL, submitted; astro-ph/0307336.
- Huss et al. (1999) Huss, A. B., Jain, B., & Steinmetz, M., 1999, ApJ, 517, 64
- Jenkins et al. (2001) Jenkins, A., Frenk, C. S., White, S. D. M., Colberg, J. M., Cole, S., Evrard, A. E., Couchman, H. M. P., & Yoshida, N. 2001, MNRAS, 321, 372
- Jesseit, Naab, & Burkert (2002) Jesseit, R., Naab, T., & Burkert, A. 2002, ApJ, 571, L89
- Jørgensen (1999) Jørgensen, I. 1999, MNRAS, 306, 607
- Kauffmann et al. (1998a) Kauffman, G. & Charlot, S. 1998a, MNRAS, 294, 705
- Kauffmann et al. (1998b) Kauffman, G. & Charlot, S. 1998b, MNRAS, 297, L23
- (27) Klypin, A., Kravtsov, A. V., Bullock, J. S., & Primack, J. R. 2001, ApJ, 554, 903
- Lilly & Longair (1984) Lilly, S. J. & Longair, M. S. 1984, MNRAS, 211, 833
- Loeb & Peebles (2003) Loeb, A. & Peebles, P. J. E. 2003, ApJ, 589, 29
- Lynden-Bell (1967) Lynden-Bell, D., 1967, MNRAS, 136, 101
- Menanteau, Abraham, & Ellis (2001) Menanteau, F., Abraham, R. G., & Ellis, R. S. 2001, MNRAS, 322, 1
- Minkowski (1961) Minkowski, R. 1961, AJ, 66, 558
- Moore et al. (1999) Moore, B., Ghigna, S., Governato, F., Lake, G., Quinn, T., Stadel, J., & Tozzi, P. 1999, ApJ, 524, L19
- (34) Mo, H. J. & White, S. D. M. 2002, MNRAS, 336, 112
- Navarro, Frenk, & White (1997) Navarro, J. F., Frenk, C. S., & White, S. D. M. 1997, ApJ, 490, 493 (NFW)
- (36) Navarro, J. F., Hayashi, E., Power, C., Jenkins, A. R., Frenk, C. S., White, S. D. M., Springel, V., Stadel, J. & Quinn, T. R. 2003, MNRAS, submitted (astro-ph/0311231)
- Negroponte & white (1983) Negroponte, J. & White, S. D. M. 1983, MNRAS, 201, 401
- Nipoti et al. (2003) Nipoti, C., Stiavelli, M., Ciotti, L., Treu, T., & Rosati, P. 2003, MNRAS, 344, 748
- Nolan, Dunlop, Jimenez, & Heavens (2003) Nolan, L. A., Dunlop, J. S., Jimenez, R., & Heavens, A. F. 2003, MNRAS, 341, 464
- Oke (1971) Oke, J. B. 1971, ApJ, 170, 193
- Oke (1984) Oke, J. B. 1984, ASSL Vol. 111: Clusters and Groups of Galaxies, 99
- Ostriker (1980) Ostriker, J. P. 1980, Comments on Astrophysics, 8, 177
- Ostriker & Tremaine (1975) Ostriker, J. P. & Tremaine, S. D. 1975, ApJ, 202, L113
- Peebles (1989) Peebles, P. J. E. 1989, in The Epoch of Galaxy Formation, eds. C. S. Frenk et al. NATO ASI series, vol 264, p. 1
- Peebles (2002) Peebles, P. J. E. 2002, ASP Conf. Ser. 283: A New Era in Cosmology, 351
- Pozzetti et al. (2003) Pozzetti, L. et al. 2003, A&A, 402, 837
- Romanowsky, A. J. et al. (2003) Romanowsky, A. J., Douglas, N. G., Arnaboldi, M., Kuijken, K., Merrifield, M. R., Napolitano, N. R., Capaccioli, M., & Freeman, K. C. 2003, Science, 301, 1696
- Sand, Treu, & Ellis (2002) Sand, D. J., Treu, T., & Ellis, R. S. 2002, ApJ, 574, L129
- (49) Sand, D. J., Treu, T., Smith, G., & Ellis, R. S. 2003, ApJ, submitted; astro-ph/0309465
- Schweizer, F. (2000) Schweizer, F. 2000, Phil Trans R Soc London, A 358, 2063
- Sheth, Mo, & Tormen (2001) Sheth, R. K., Mo, H. J., & Tormen, G. 2001, MNRAS, 323, 1 , 119
- Sheth, R. K. & Tormen, G. (1999) Sheth, R. K. & Tormen, G. 1999, MNRAS, 308
- Sheth, R. K. et al. (2003) Sheth, R. K. et al. 2003, ApJ, in press; astro-ph/0303092
- Somerville et al. (2003) Somerville, R. S. et al., 2003, ApJ, in press; astro-ph/0309067
- (55) Springel, V., Yoshida, N., & White S. D. M, 2001, New Ast. 6, 79
- Stanford et al. (2003) Stanford, S. A., Dickinson, M., Postman, M., Ferguson, H., Lucas, R., Conselice, C., Budavari, T., & Somverville R., 2003, ApJ, in press; astro-ph/0310231
- Syer & White (1998) Syer, D. & White, S. D. M. 1998, MNRAS, 293, 337
- Toomre & Toomre (1972) Toomre, A. & Toomre, J. 1972, ApJ, 178, 623
- Trager, Faber, Worthey, & González (2000) Trager, S. C., Faber, S. M., Worthey, G., & González, J. J. 2000, AJ, 119, 1645
- van Dokkum & Ellis (2003) van Dokkum, P. G. & Ellis, R. S. 2003, ApJ, 592, L53
- White (1980) White, S. D. M., 1980, MNRAS, 191, 1
- White (1989) White, S. D. M. 1989, in The Epoch of Galaxy Formation, eds. C. S. Frenk et al. NATO ASI series, vol 264, p. 15
- White & Rees (1978) White, S. D. M. & Rees, M. J., 1978, MNRAS, 183, 341
- Willott, Rawlings, Jarvis, & Blundell (2003) Willott, C. J., Rawlings, S., Jarvis, M. J., & Blundell, K. M. 2003, MNRAS, 339, 173
- Wyithe, J. S. B., & Loeb, A. (2003) Wyithe, J. S. B. & Loeb, A. 2003, ApJ, 595, 614
- Yoshida et al. (2001) Yoshida N., Sheth R. K. & Diaferio A., 2001, MNRAS, 328, 669