On the highly reddened members in 6 young galactic star clusters - a multiwavelength study ††thanks: Figures 5 and 8 are available electronically and can be obtained from authors
Abstract
The spectral and reddening properties of 211 highly reddened proper motion members with mag in 6 young galactic star clusters are investigated using low resolution spectroscopic, broad-band and mid-IR data. We report emission features in CaII HK and HI lines for a sample of 29 stars including 11 stars reported for the first time and also provide either a new or more reliable spectral class for a sample of 24 stars. CaII triplet width measurements are used to indicate the presence of an accretion disk for a dozen stars and to hint luminosity for a couple of stars. On the basis of spectral features, near-IR excesses, dereddened color-color diagrams and mid-IR spectral indices we identify a group of 28 pre-main sequence cluster members including 5 highly probable Herbig Ae/Be and 6 classical T Tauri star. A total of 25 non-emission MS stars, amounting to 10 % early type MS members, appears to show Vega-like characteristics or are precursors to such a phenomenon. The various membership indicators suggest that 16% of the PM members are non-members. A significant fraction (70%) of program stars in NGC 1976, NGC 2244, NGC 6530 and NGC 6611 show anomalous reddening with = , , and , respectively, indicating the presence of grain size dust larger than that typical to the diffuse medium. A small number of stars in NGC 1976, NGC 2244 and NGC 6611 also show normal behavior while the cluster NGC 6823 appears to have a normal reddening. Three highly luminous late type giants, one in NGC 2244 and two in NGC 6530, appears to be member and are in post-hydrogen-core-burning stages suggesting a prolonged duration ( 25 Myrs) of star formation.
keywords:
Young open clusters: individual: NGC 1976, NGC 2244, NGC 2264, NGC 6530, NGC 6611, NGC 6823 - reddening - extinction law - PMS objects.1 Introduction
Study of differential extinction and the distribution of dust and gas in young clusters (age 10 Myr) have played an important role in understanding the star formation processes in them (Elmegreen & Lada 1977; Krelowski & Strobel 1979; Margulis & Lada 1984). Study of the variation of reddening, , across the cluster face, with the spectral type and luminosity indicates that the observed variation of reddening in young open clusters may not be explained by a ”simple” or even ”relatively” simple physical scenario (Sagar 1987). What factors determine the non-uniform extinction in young star clusters and relatively large value of observed for some members is not understood on the basis of existing observations. Is it the patchiness in distribution of gas and dust or the circumstellar shells around individual stars or the dust shell around the cluster or is it due to some emission features in the individual members or a combination of any of these ?
The early type stars, being intrinsically luminous and associated with dusty regions, provide invaluable help in probing properties of extinction in the interstellar (He et al. 1995) as well as in the intracluster medium (Sagar & Qian 1993). In order to determine accurate physical properties of young star clusters, extinction contributions from interstellar, intracluster and circumstellar material should be known reasonably well (Pandey et al. 2003). The anomalous extinction behavior of the interstellar medium is usually characterised by the ratio of the total to selective extinction , with a normal value of 3.1 for the diffuse dust/clouds (Mathis 1990; Martin & Whittet 1990; He et al 1995). However, is found to deviate significantly in many directions particularly towards young clusters embedded in dust and gas clouds (Krelowski & Strobel 1987; Pandey et al. 2003 and references therein). In addition to intracluster dust and gas, the anomalous extinction is also caused by the nature of circumstellar material around young stars for example Herbig Ae/Be, T Tauri and Vega-like stars (Meeus et al. 2001; Hillenbrand 2002; Manoj et al. 2003 and references therein). Moreover the extinction law is found to be uniform in all directions for .
To gain insight into the above questions, systematic spectrophotometric data of highly reddened cluster members are required. Analysis of such data will not only help in studying the role of emission features, if present in these members but also help in characterising the star’s intrinsic properties. In general, the previous extinction studies were mainly based on data taken primarily with either photographic plates or single channel photometers in combination with the spectroscopic information derived photometrically. On the other hand, current optical photometry and astrometry, as well as mid-IR surveys allows us to derive multi-wavelength information on cluster members. In this paper we present a low dispersion spectroscopic data of a sample of 211 highly reddened proper motion cluster members mostly in their main-sequence (MS) phase. The brighter members ( mag) with mostly early spectral type are selected from six young galactic clusters. We collected their available broad-band data from the WEBDA111http://obswww.unige.ch/webda database, JHK data from 2MASS222http://www.ipac.caltech.edu/2mass (2 Micron All Sky Survey) and mid-IR data from ISOGAL333http://www-isogal.iap.fr (Infrared Space Observatory GALactic survey), MSX444http://www.ipac.caltech.edu/ipac/msx (Midcourse Space Experiment) and IRAS555http://vizier.u-strasbg.fr (InfraRed Astronomical Satellite) databases. Sect. 2 describes the selection of objects and their observational data for the study, while the results derived from the present analysis and the discussions are presented in the remaining part of the paper.
2 Observations
2.1 Sample selection
Our sample consists of 211 stars in the direction of six young (age 13 Myr) galactic clusters namely NGC 1976, NGC 2244, NGC 2264, NGC 6530, NGC 6611 and NGC 6823 (see Table 1). These clusters lie in a highly obscured star forming regions, viz M42 - OB1 Ori - in Orion, OB2 Mon - Rosette nebula - in Monoceros, OB1 Mon - in Monoceros, M8 - Lagoon nebula - in Sagittarius, M16 - Eagle nebula - in Serpens and OB1 Vul - in Vulpecula, respectively. Their galactocentric distances are in the range of 0.4 kpc to 2.1 kpc. A histogram of the magnitudes of the selected stars is shown in Fig. 1(a). The sample consists of about 72% of early type stars. There are 22, 109, 20, 20, 24 and 16 cluster members of O, B, A, F, G and K spectral types respectively. More than 95% of the stars have larger than the mean for their respective cluster. A histogram of the is plotted in Fig. 2 for each cluster. The proper motion (PM) membership of most of the stars are more than 90%. Around a dozen of the sample have either low PM membership probability or belong to the field star population, chosen deliberately to represent interstellar properties in the cluster directions. Thus a large fraction of objects under study are highly reddened PM cluster members. Further details of their spectroscopic and photometric data are described in the following subsections.
2.2 Spectroscopy
The long slit spectroscopic data were obtained from the Siding Spring Observatory, Australia. The clusters NGC 6530 and NGC 6611 were observed in August 1989 on the Australian National University (ANU) 1-m telescope using a CCD and spectrograph with a dispersion of 5.7 Å/pixel and covering a range of 3150 to 6500 Å. The remaining clusters were observed in October 1995 on the ANU 2.3-m telescope using a CCD and the double beam spectrograph with a dispersion of 4.0 Å/pixel, covering the wavelength ranges from 3150 to 6500 Å in the blue and from 5700 to 9800 Å in the red. A sample of 77 stars mostly from NGC 6611 and NGC 6530 have therefore spectra only in the blue region. A consolidated log of observations, spectrographs and grating are given in Tables 2 & 3. Sufficient numbers of bias, flat and arc frames were obtained for calibration purposes. Apart from the cluster stars, several bright and faint spectrophotometric standards were also observed. During the 1995 observations, stars with near blackbody and smooth spectra from Tables 3 & 4 of Bessell (1999) were also observed in each night. These are used to remove atmospheric absorption features and any large variations along the spectrum due to detector sensitivity, grating efficiency and the spectrograph vignetting.
Data reduction is done using the spectroscopic software packages of IRAF666ftpsite - iraf.noao.edu; IRAF is distributed by the National Optical Astronomy Observatories, which are operated by the Association of Universities for Research in Astronomy, Inc., under cooperative agreement with the National Science Foundation. and FIGARO777ftpsite - ftp.aao.gov.au. Arc frames were used for wavelength calibration. A typical RMS uncertainty in wavelength and flux calibrations are 1 Å and 0.05 mag respectively for a typical blue region (3500 - 6500 Å) spectrum with S/N ratio of 20 (see Fig. 1(b)). Whenever the arc spectra were not taken (see Table 3), the wavelength calibrations were done using Balmer lines of bright A type standards, which may introduce a further uncertainty in calibration of a few Angstroms. A set of six flux and wavelength calibrated spectra are given in Fig. 3 while the continuum normalised spectra for all the stars are presented in Fig. 5. The flux is given in AB magnitudes with the zero-point flux of 3.63 10-9 ergs/cm2/sec/Å. In stars 6, 17, 18, 20, 24, 28, 31, 91, 115 and 179 - the nebular background was very strong or saturated making for imprecise background subtraction. Seven of these stars belong to the nearest and most fertile star forming region (i.e. Orion nebula - NGC 1976). The effects of cosmic rays can also be seen in a few spectra (see Fig. 5).
The 1995 observations were reduced following the strategies described by Bessell (1999), which has indeed helped us to examine very weak spectral lines of equivalent width (EW) 1 Å such as NaI D, CaII T and OI T, where D and T stands for doublet and triplet respectively (see Section 3 for details). The zig-zag continuum can be seen in the blue part of the 1989 spectra while it is absent in 1995 spectra, this effect is more apparent in the normalised spectra (see Fig. 5). The telluric features have not been removed completely for a few stars as they are much dependent on night conditions. In order to check the flux accuracy and correctness of reduction procedure, the synthetic photometric indices were determined. We found that for 95% of the samples the differences of observed , and with the synthetic ones were lying in the range mag and mag respectively. The residuals higher than this range may be due to either variability or a low S/N (10) or a close by star or emission features or a combination of these. However, we may conclude that the flux accuracy and reduction procedure are correct within observational uncertainties.
2.3 Photometry
2.3.1 Optical
The broad-band Johnson and Cousins data are collected from earlier photometry done by us (Sagar & Joshi 1978, 1979, 1981 and 1983 for clusters NGC 6530, NGC 6611, NGC 6823 and NGC 2264 respectively) and from the WEBDA database (Mermilliod & Paunzen 2003 and references therein). For 45 stars, we had only Johnson data which were converted to the Cousins system using transformations given by Bessell (1979). We could collect simultaneous data for all the samples except 9 stars which have only data. There are 83 stars for which we do not have data in either or or in both bands (see Table 4). The maximum uncertainly in the magnitude determination is considered to be 0.05 mag. Our sample also contains many known and suspected optical variables (see Table 4). The star 138 is a double star and we consider the brighter component (Walker 1957) in our analysis.
2.3.2 Near-infrared (NIR)
The NIR data are taken from the ground based 2MASS Survey (Skrutskie et al. 1997; Cutri 1998), which provides magnitudes for about 471 million point sources observed at the bands (1.25 m), (1.65 m) and (2.17 m) with the limiting magnitudes of 15.8, 15.1 and 14.3 respectively. We had JHK data available for about 40% of the program stars in the literature for example by Qian & Sagar (1994) for NGC 1976, Hillenbrand et al. (1993) for NGC 6611 and a few more stars from scattered sources. We collected data from 2MASS as it contained homogeneous measurement for most of the sample stars. The magnitude were transformed to the magnitude using relations given by Carpenter (2001) or the subsequent updates posted on the 2MASS website. There are 12 stars for which the quality of the 2MASS data are either poor or the data were not recorded. For six of these stars we took data from the literature i.e. for stars 17, 18 and 22 from Qian & Sagar (1994); for star 26 from Hillenbrand et al. (1998); for star 56 from Pérez et al. (1987) and for star 115 from van den Ancker et al. (1997). For the stars 87, 131, 133, 136, 137 and 141 we had either poor S/N ( 10) data or had only upper magnitude estimate in band. As we had bright NIR sources ( 9 mag) in our samples, almost all stars have good S/N ( 10) ratio. A Gaussian fit to the frequency distribution of uncertainties in the bands give a mean of 0.02, 0.03 and 0.03 mag with a of 0.018, 0.022 and 0.022 mag respectively.
As a further check on the consistency of the NIR data, we compared 2MASS magnitudes with that available in the literature for a total of 90, 89 and 91 stars in , and band respectively. The difference in , and magnitude has a mean (s.d.) of , and respectively. We observed more than 3 deviation for a total of 16 stars altogether and their numbers are 11, 6 and 7 in , and bands respectively out of which only 5 have the deviation in at least 2 of the bands. Most of these stars have either emission features or show NIR variability (Qian & Sagar 1994; Carpenter 2001). Thus we could secure almost a complete broad-band data for entire sample of 211 program stars (see Table 4).
2.3.3 Mid-infrared (MIR)
The MIR (7 to 100 m) data are taken from ISOGAL (Schuller et al. 2003; Omont et al. 2003), MSX (Price et al. 2001) and IRAS (Beichman et al. 1988) Surveys. A total of 65 stars were found to have associations at least at one band (see Table 5).
ISOGAL provides data mainly at two bands centered around 7 m, with filters LW2, 6.7 (3.5) m; LW5, 6.8 (0.5) m; and LW6, 7.7 (1.5) m, and around 15 m, with filters LW3, 14.3 (6.0) m and LW9, 14.9 (2.0) m with the detector sensitivity down to 0.01 Jy. We found 28 sources within a search radius of 10′′. Twelve of these stars (169, 175, 190, 191, 192, 195, 197, 198, 200, 204, 203, 107) have a separation of around 5′′ while the rest have a separation of around 1′′. We consider these as reliable identifications as ISOGAL’s positional accuracy for DENIS associated sources are 0.5′′ and 8′′ for non-DENIS associated sources. The stars 190, 191, 192, 195, 196, 197, 198, 200, 203, 204 and 207 were observed in broad-band (LW2, LW3) filters and most of them have fluxes near detector sensitivity (see Table 5). Moreover, most of them are identified within a search radius of 5′′. Another 17 stars were observed with narrow-band (LW6 and LW9) filters and were identified within a search radius of 1′′. A typical mean uncertainty of these stars are about 0.01 Jy with a quality flag of 4 for most of the associated sources (Schuller et al. 2003).
MSX provides data in four bands namely A (8.28 m), C (12.13 m), D (14.3 m) and E (21.34 m) with the highest sensitivity at band A of 0.1 Jy. A total of 23 sources (Table 5) are found to have an MSX counterpart and twelve of these (87, 90, 95, 98, 126, 132, 160, 172, 173, 175, 176, 178) have separations within 2′′ while others have a mean separation of 6′′. A typical mean 1 flux uncertainty for the selected sources are 7%, 10%, 11% and 12% respectively at A, C, D and E bands.
IRAS provides fluxes at 12, 25, 60 and 100 m with a typical detector sensitivity of 0.4, 0.5, 0.6 and 1.0 Jy respectively. The typical positional uncertainties are 25′′. We identified 27 IRAS sources to be associated with our program stars out of which thirteen (1, 5, 13, 30, 41, 57, 65, 71, 87, 111, 126, 199) have separations within 30′′ while the rest have a mean separations of 45′′. Most of these objects are found to have identifiers in the SIMBAD888http://simbad.u-strasbg.fr database. However a few of these may be a spurious associations considering the positional uncertainties.
Table 5 lists all the stars identified with these catalogues. Nine of these stars (87, 97, 111, 126, 160, 173, 175, 176, 178) have been observed with two surveys. Their fluxes are comparable within observational uncertainty except for stars 111 and 126 where the differences are considerable. This may be either due to wrong association or due to source variability. In many cases, while studying spectral energy distribution, we averaged and considered the mean fluxes representing at 7, 12, 15 and 25 m. For example ISOGAl’s bands around 7 m and MSX’s A band fluxes were averaged to represent the flux at 7 m.
3 Spectral properties
3.1 Spectral classification
A technique based on the cross-correlation method was used to classify the spectra. A set of 161 template spectra having different spectral type and luminosity class were taken from the optical library of Jacoby et al. (1984) but rebinned to the same resolution in the wavelength range (3800 to 5000 Å) as the present data. The continuum of template as well as programme spectra were approximated by filtering the high frequency component in Fourier space. The continuum divided (LaSala & Kurtz 1985) spectra were then used for cross-correlation. Each programme star was cross-correlated with the template stars and R-values defined as the ratio of peak height to rms noise (Tonry & Devis 1979) were examined. The spectral type corresponding to the highest R-value was selected.
A comparison of our spectral types with those in the literature is plotted in Fig. 4. Most of the stars lie within 2 sub-spectral types while a few of them have larger deviations. This is due to the presence of Balmer line emission in early type spectra and CaII HK line emission in late type spectra. Moreover for late type stars it may also be due to wrong classification in the literature. In order to confirm the spectral type determined by cross-correlation, we stacked the Fourier filtered spectra, by eliminating high frequency (noise) and low frequency (continuum) components, in the sequence of their spectral type (see Fig. 5). This helped us to examine and reclassify the individual spectrum visually using the literature classification as many of the stars have accurately determined spectral types. A large range in spectral types exist in the literature for some such as star 24 (B0 Vp by Johnson (1965), B8 by Greenstein & Struve (1946), B2 by Levato & Abt (1976)), we adopt the ones matching with our type. The final adopted spectral types was chosen from the literature, if it was based on higher dispersion, otherwise it is adopted from the present classification. The luminosity class is mostly taken from literature, if available, otherwise it is considered to be a MS star as per their location in the color-magnitude and color-color diagrams of the respective clusters. However, for a few stars new luminosity classification is also being provided (see Section 3.2). Table 6 lists the finally adopted spectral class including either a new or a more reliable classification for a sample of 24 stars indicated with an asterisk.
3.2 Spectral features - CaII HK, HI, CaII T, OI T and NaI D lines
Emission features in the Balmer and CaII HK lines were reported for a total number of 43 stars on the basis of optical spectra taken mainly in the classical MK region (3800 to 5000 Å) and/or Hα region (see Table 4 and references therein). We could not confirm the reported emission features for 25 of them. Some of these emission features are in the Hα region where we do not have data for 77 stars and for some stars the reported features are not seen at our resolution or the features may be absent. We confirm the spectral peculiarities for 18 stars reported earlier and find spectral peculiarities for another 11 stars for the first time. The prominent spectral peculiarities for all these 29 stars are listed in Table 7 and the emission features are shown in Figs. 6 and 7. In several stars, namely 6, 18, 20, 24, 26, 28, 31 115 and 179, it could not be ascertained whether certain emission features were of nebular or stellar origin.
The spectral peculiarities associated with relatively weaker lines such as Paschen, CaII T (8498, 8542 and 8662 Å), OI T (7772, 7774 and 7775.4 Å) and the interstellar NaI D (5896 and 5890 Å) have also been investigated. We have determined the integrated equivalent width for CaII T lines only for F, K and G type as these lines merge with Paschen lines of Hydrogen in early type stars. The equivalent width of the NaI D lines are determined for all the stars. A typical uncertainty of 5 to 10% is assigned to these determinations as is seen from repeating the width measurements. The values obtained in this way are tabulated in Table 6. The EW of the OI T lines are too weak ( 0.3 Å) to estimate with low resolution spectra and in a few cases due to low S/N ratio of the spectra. However, individual cases of enhanced OI T absorptions are remarked in the following subsections along with the Paschen line peculiarities.
The CaII T lines have been used to explore the disk frequency and disk accretion rate in late type pre-main sequence (PMS) candidates (see Hillenbrand et al. 1998). It can be inferred using transformations by Gullbring et al. (1998) that an EW (CaII T) Å corresponds to and at lower resolution as in present case a should correspond to a filled-in CaII T lines. The CaII T widths were determined for 54 stars. The mean value, best represented by 32 non-emission MS stars, is (s.d.) Å, which is comparable to the value quoted for CaII T widths ( 3 Å) for late type MS stars by Hillenbrand et al. (1998). There are stars having larger than 3 discrepancy (see Fig. 8(a)). The stars 87, 114, 149 and 211 have widths greater than 3.9 Å, two of these are classified supergiant in the literature, therefore we assign the supergiant (I) luminosity to the other two stars (114, 149). There are 11 stars with widths less than 2 Å indicating the presence of a circumstellar disk, moreover all of these except star 48 also show weak to strong emission features. For stars 5, 27 and 100, the width is near zero or negative indicating the presence of an accretion disk ( 10-8 M⊙ yr-1), while stars 6, 23, 32, 33, 34, 48, 92 and 99 have values between 1 to 2 Å, qualifying them for having circumstellar disks with low accretion rate 10-8 M⊙ yr-1.
The dependence of NaI D line widths on spectral types indicates higher values for late type stars (F, G, K) as the measure is affected by the stellar components (Fig. 8(b)). A large scatter (0.3 to 1.0 Å) for B type stars is measured, which indicates surplus circumstellar and intra-cluster gas components in addition to the normal extinction effects. The largest scatter in NaI D width is seen for the cluster NGC 1976 and NGC 2264. The average values and standard deviation of NaI D width determined from early type PM members for clusters NGC 1976, NGC 2264, NGC 2244, NGC 6530, NGC 6823 and NGC 6611 are , , , , and Å respectively. These values appear to show a weak correlation with the corresponding galacto-centric distances to the clusters (see Fig. 8(c)), however it is difficult to discuss the extinction effects on the NaI D widths due to circumstellar and intracluster dust and gas.
3.2.1 Early types - O, B and A stars
There are 22 O type stars. Eleven of these stars (107, 142, 154, 155, 156, 157, 161, 164, 169, 170, 171) have been observed only in the blue. Hα emission is reported for star 22 by Conti (1974) and for star 58 by Lesh (1968). The Hα appears to be partially filled in star 22 (indicating a weak core emission) while comparing its strength with the normal spectra of the stars 67 and 202. No indication of any emission was seen for star 58. The spectral features characteristic of Of stars are seen clearly in our spectra (see Fig 5) for example the stars 81, 110, 67, 155 and 156 show NIII 4630-34 Å line in emission, moreover, HeII 4686 Å is also seen in emission for star 161 (a brightgiant, IIb) confirming the reported spectral features from dispersions much higher than ours.
In a sample of 109 B type stars (86 early type - up to B4), 29 stars are reported to have weak to strong emission features. Seventeen of these are reported by Hiltner et al. (1965) on MK region observations for NGC 6530 with a caution for effects of nebulosity. We have Hα region spectra for only four stars namely 78, 97, 188 and 205. Altogether we could confirm Balmer emissions only in 7 of them viz 97, 122, 126, 160, 173, 174 and 175. Of these, stars 97, 122, 160 and 175 are reported to have Herbig Ae/Be (HAB) characteristics. A strong OI T absorption in star 97 (EW 0.83 Å) indicates that it is not a dwarf. The width of OI T features comes out to be around 0.3 Å for dwarfs. Star 97 is the only one which shows Paschen lines in weak emission. We find Hβ in strong emission for star 109 and in filled emission for star 115 (see Fig. 6). About 8% of our sample show characteristics of Be stars which is well in accordance with the general percentage of Be stars i.e. 11% (Jaschek and Jaschek 1987). The luminosity effects can be seen as sharper balmer lines for the stars 176 (B2.5 I), 195 (B0.5Ib), 52 (B2.5 II-III) and 198 (B1 III), however it is less evident for stars 1, 79, 183, 184 and 188 reported as subgiants in the literature.
A total of 20 A type stars were observed. Out of these, stars 35 and 98 are reported to have emission features by Herbig (1960) and by Young (1978) respectively. Our spectra shows Hα in strong single peak emission for star 35 and Hα totally filled up to continuum for star 98. A strong OI T in absorption in the star 35 (EW 0.85 Å) according to the relation obtained by Danks and Dennefield (1994) indicates that these are candidate HAB star. The star 8 is reported to be of Ap type by Levato and Abt (1976). Our spectrum shows sharp Balmer lines with enhanced CaII T absorption, very weak Hα absorption and large NaI D absorption, indicating a PMS star with weak core emission at Hα having a circumstellar shell and making it another candidate HAB star.
3.2.2 Late types - F, G and K stars
Our sample contains 20 stars of F spectral type. The star 5 was reported to have CaII HK in emission by Walker (1983). Our spectrum also shows Hα in strong emission in addition to CaII HK. The star 99 has totally filled Hα and partially filled CaII HK. The star 92 also appears to have a very weak Hα emission. These stars (5, 92, 99) have CaII T width of , 1.93 and 1.95 Å, respectively, indicating them to have a circumstellar disk, characteristics of a PMS star. The CaII T width indicates that star 114 is a supergiant. Of the 24 G type stars, five are reported to have Hα emission viz star 31 (Penston et al. 1975), 100 (Pérez 1988), 101, 106 (Young 1978) and 27 (Herbig and Bell 1988). We confirm emission features for stars 27, 31, 100 and 101, however star 106 does not have Hα in emission during present observations as found by Pérez (1988). The star 100 shows a strong Hα emission, this star is reported to show weak and partially filled Hα emission by Pérez (1988). In addition to these we also find totally filled Hα for stars 23 and 29. The star 6 shows a clear CaII HK core emission while star 91 shows partially filled CaII HK lines. A very weak EW ( 0.2 Å ) of NaI D line for star 91 indicates that it may be a field star.
There are only 16 K type stars in our sample, of which four stars (32, 33, 34 by Walker (1983) and 145 by van den Ancker et al. (1997)) are reported to have either Balmer or CaII line emissions. The star 33 is also reported to have more Li (6704 Å) absorption by Walker (1983). We confirm CaII emissions for stars 32, 33 and 34, in addition we report Hα emission also for stars 32 and 34. No emission features were seen for star 145. Moreover we report 2 more stars to show CaII emissions viz 15 and 87. The stars 149 and 151 are of special interest as they are reported to have post-AGB characteristics. The TiO bands around 6651 Å and 7054 Å can be seen very clearly in both of these stars along with a weak appearance in star 199. The MK spectra of star 149 matches best with K7 III (BD+590128 - a MK standard from the Jacoby library). The CaII T width for this star indicates that it is a supergiant. Therefore, we classify these stars (149, 151) as giants of type K7, however the star 149 may be a candidate supergiant.
Table 8 summarises the distribution of all the program stars according to their spectral type, luminosity class and emission line peculiarities.
4 Extinction Properties
4.1 Intrinsic colors and color excesses
To study the behavior of reddening and extinction properties, we derive , , , , , and color excesses of the cluster members using the MKK spectral-type-luminosity-class-colors relation given by FitzGerald (1970) for and ; by Johnson (1966) for and , transformed to the Cousins one using Bessell’s transformation (1979); and by Koornneef (1983) for , , and . Maximum uncertainties in the color excess determination in is considered to be about 0.08 mag and in to be 0.15 mag. The color excesses in some bands are found to be negative for stars 48, 59, 96, 100, 102 and 106 but the values are within the uncertainty limit. Most probably, this is due to non-simultaneous observations and/or due to variability of the star.
We have determined the value of using which is approximated as 1.1 . The ratio of to does not change appreciably with value (Whittet & van Breda 1980). He et al. (1995) estimated the by different methods and concluded that they agree to better than 3% for normal stars. However, the value of is very sensitive to the excess radiation at the band K as well as to very small values of . Therefore the value of for a sample of 41 stars, found to have anomalous radiation at NIR (see Section 5), are determined using assuming a normal reddening. Table 6 contains values of estimated in this way for all the program stars except for those 23 stars which have very low values ( 0.2 mag) of .
In order to understand the properties of interstellar matter in the direction of clusters, we plot the ratios of color excesses and against in Fig. 9. These shall be referred as color excess diagrams (CEDs) hereafter. As our sample belong to the star forming regions and is likely to have young stellar objects, the color excess ratios are plotted relative to primarily with the aim to minimise contributions from the blueing effect and ultraviolet excess on the band as well as to minimise contributions from circumstellar dust and gas shells at the band. Moreover, does not depend on properties such as the chemical composition, shape, structure and degree of alignment of the interstellar matter (Qian & Sagar 1994; Yadav & Sagar 2002). In Fig. 9, the dotted lines are drawn to represent the normal interstellar extinction law (Mathis 1990). Errors expected from the observational uncertainties are shown with crosses. Most of the sample stars are lying on the normal reddening line for all the clusters in the NIR CEDs, while a scatter of varying amount can be seen in diagrams with and . It is maximum for NGC 1976 and NGC 6611 and minimum for NGC 2244 and NGC 6530.
We divided the stars into three groups depending upon their deviation in the CEDs with respect to the normal line. Group 1 contains all the stars following the normal law within observational uncertainty, while Group 2 stars follow the normal law at NIR and deviate towards a lower ratio in the ultraviolet (UV). In addition to these, the sample also contains peculiar stars in the sense that they do not follow a particular trend and deviate at either one or two bands in the NIR and UV. These usually show emission features, chemically peculiarities and variability at visible or NIR wavelengths. All of these stars along with the ones with very low membership were kept in Group 3 and were not considered in estimating mean reddening for the cluster. The last column of Table 6 indicate the categorisation of Groups 1, 2 and 3 stars, while a number distribution for Group 1 and 2 stars are given in Table 9. A cluster-wise description of the reddening properties is given below.
4.2 Extinction law towards clusters
For NGC 1976, a wide variations in the reddening values e.g., = 4.8 (Mendez 1967), 5.0 (Johnson 1968), 3.1 (Walker 1961) have been reported. It has been argued that a part of the large value of may also be contributed by the far-infrared brightness of stars (Johnson 1967). A recent study by Qian and Sagar (1994) concludes that the cluster presents both normal as well as anomalous behavior. The UV extinction study also suggests an anomalous galactic curve towards higher values of (Bohlin & Savage 1981). Among most of our sample having high values of , there exists 6 stars in Group 1 which follow a normal extinction law and have a mean value of with a range from 3.07 to 3.30 (Tables 6 and 9). Group 2 stars, 28 in total, have a mean value of of with a range from 3.77 to 9.94. The extinction properties do indicate a shift in the grain size distribution towards larger than normal sized particles in these regions.
The cluster NGC 2244 has a mean reddening of mag with a normal reddening law and a small amount of differential reddening (Park & Sung 2002), though individual values towards the cluster field ranges from 0.08 to 0.98 mag (Massey et al. 1995; Berghöfer & Christian 2002). At the time of observations we selected highly probable members based on the study by Marshall et al. (1982), though a recent refined PM study on brighter members (Sabogal-Martínez et al. 2001) dubs many of the high PM member as non members. In our sample we have stars 48, 54, 59 and 69 with 0.05 mag. We adopt a synthetic of 0.05 and 0.07 mag for stars 48 and 59 as the V magnitude estimate in the literature were highly uncertain and the color excesses could not be determined at all bands for these stars. A re-estimated PM membership assigns a value less than 0.5 for stars 54, 59 and 69 (Sabogal-Martínez et al. 2001). Similarly the stars 51, 55, 63, 85 and 86 have 0.15 mag and have low membership according to the new study. Therefore all of these stars were not considered for determining the extinction law for the cluster. On the basis of 10 PM members in Group 1, we determine as 3.16 and a value of is obtained on the basis of 19 members in Group 2. Therefore a significant number of the reddened stars do show anomalous extinction contrary to the earlier finding that the cluster has a normal reddening law i.e. 3.2 (Ogura & Ishida 1981; Park & Sung 2002).
NGC 2264 has the lowest mean reddening i.e. mag in our sample (Sung et al. 1997). For stars 88, 89, 91, 96 and 102, is less than 0.02 mag. The accurate value of for these stars therefore could not be determined. The CEDs have a large scatter with most of them showing peculiar extinction. The remaining stars 92, 93, 99 and 103, all of late spectral type, show abnormal behavior with a mean . The star 104 show a normal behavior with 3.03. Moreover our sample contains a very small number of early type stars. The abnormal extinction for the late type stars may also be due to circumstellar material.
In NGC 6530, has a mean of 0.35 mag with abnormal reddening reported for a number of embedded members (Sung et al. 2000; van den Ancker et al. 1997). The only two stars which follow normal law in our sample are 107 and 135. A total of 32 stars fall in Group 2 and show abnormal extinction behavior with = .
NGC 6611 has a mean of 3.75 (3.5 to 4.8) and of 0.86 mag with variation from 0.4 to 1.8 mag (Hillenbrand et al. 1993). We have also included 8 BD stars on the basis of PM data from Kamp (1974), however five of these stars (181, 182, 183, 184, 186) have mag and hence have low membership probabilities. The stars 164, 169 and 171 show the normal law with a mean of with the remaining 23 showing abnormal reddening with a mean of .
NGC 6823 has a mean reddening of mag with a range of 0.64 to 1.16 mag and follows a normal reddening law (Sagar & Joshi 1981; Guetter 1992). The stars 206 and 208 have reddenings of mag making them unlikely to be cluster members. The stars 194, 195 and 198 show variability while stars 199, 209 and 211 occupy anomalous position in the color-magnitude diagram (Sagar and Joshi 1981). The remaining stars, 16 in total show a normal reddening with a mean of = 3.0, although a closer look at the CEDs may give the impression that the cluster region contains material representing a shallower as well as a steeper than the ISM.
Using data from highly reddened stars with no emission features and high membership probabilities (i.e. Group 1 + Group 2 stars), the clusters present diverse extinction properties. The clusters NGC 6530 and NGC 6823 are represented by single extinction laws with the value of and respectively. A small fraction of the stars (18%, 37% and 14% respectively) in the clusters NGC 1976, 2244 and 6611 show normal extinction with equal to , and respectively, while the major fraction of stars show anomalous extinction with the corresponding of , and respectively. We could not derive a representative value of for NGC 2264 due to small statistics. The clusters NGC 2264 and NGC 1976 have the largest scatter in the value of i.e., from 2.8 to 6.7 and from 3.07 to 9.9 respectively. The above observations based on reddened members led us to conclude that the young clusters, 4 out of 6, appears to have anomalous extinction in general, indicating the prevalence of larger than normal grain size dust distributions in the star forming regions. This supports the earlier finding of steeper than for the ISM in star forming regions (Terranegra et al. 1994). The mean normal value of for the clusters NGC 1976 and NGC 2244 (with distances, D, 2 kpc) is while for the clusters NGC 6611 and NGC 6823 (D 2 kpc) . These figures are in excellent agreement with the distance dependence of for the diffuse dust reported in literature (see Table 5 of He et al. 1995). This indicates that the early type stars with high does provide a reliable estimate of .
5 Infrared properties
5.1 NIR excess
The interstellar as well as intracluster material show normal reddening for wavelengths irrespective of the grain properties of the matter. Therefore the nature of extinction due to circumstellar material can be indicated by an excess or a deficit of radiation at wavelength longward of 1 m. In order to probe this aspect, we derive and color excesses individually for all program stars from the color excess assuming a normal extinction law. The differences between these and the observed color excesses derived on the basis of the spectra are plotted in Fig. 10 and show a random scatter around the mean indicating the independence of the extinction at . The scatter is best represented by the average values of (s.d.) mag for and (s.d.) mag for . These estimates were determined by ignoring highly deviant points and are based on 195 and 204 data points in and , respectively. We expect the star to have a NIR excess if it has differences greater than 2 at either or or at both. There are 10, 11 and 20 stars which have differences , 3-5 and 2-3 respectively at either or or both. Table 10 provides the list of all these stars with their differences. Several of these stars are reported to have large or moderate NIR excess e.g. for stars 5, 8, 14, 24, 27 and 33 by Qian & Sagar (1994); for stars 160 and 175 by Hillenbrand et al. (1993); for stars 115, 122, 136, 149 and 151 by van den Ancker et al. (1997). Stars 17, 18, 119, 194, 198 and 133 also show a NIR deficiency at or or both.
5.2 Dereddened color-color diagram
In order to understand the nature of a NIR excess we generate the dereddened color-color (() versus ()) diagram. For this we chose to estimate ( - assuming normal reddening) for stars showing a NIR excess (see subection 4.1 for detailed discussion). The color excesses and were derived as and respectively (Reike & Lebofsky 1985). A typical uncertainty in these colors is 0.1 mag with a maximum up to 0.15. The dereddened NIR color-color diagram is shown in Fig. 11 and is used to identify non-MS stars and their nature in combination with the spectral properties.
Most of the 14 stars showing only Balmer emissions, are of early type (F0) except star 92 which is of F8 type, and occupy positions towards right of the reddened MS and possess moderate to strong NIR excesses. These are probable HAB or classical Be stars. Four of these stars (8, 35, 97, 98) have strong NIR excesses and lie to the extreme right in the color-color diagram. These are late B or early A type stars and appears to show Group I HAB characteristics (Hillenbrand et al. 1992, 1993). While another group of 5 stars (109, 122, 126, 160, 175) have moderate NIR excesses and lie isolated towards the right and lower down in the diagram. These early type stars ( B5) are possible Group II or III HAB candidate. Two of these stars (160, 175) have rigorously been argued to have HAB characteristics and were kept in Group III by Hillenbrand et al. (1993). A further group of 4 stars (22, 115, 173, 174) shows weak emission features and lie within the reddened MS region are probably the so called classical Be stars. The list of these 13 probable PMS or Be stars are given in Table 11.
A group of 18 late type stars ( F8) are probable T Tauri stars (see Table 12). Six of these stars (5, 27, 32, 33, 100, 101) have high to moderate NIR excesses and Hα emission above the continuum with a mean EW of 5Å. In the () vs () diagrams they occupy the position just below the zero-age MS (ZAMS) track of classical T Tauri (CTT) stars. These stars have both CaII HK and Balmer lines in emission. Moreover, star 27 also has Paschen line emission; stars 27 and 33 have emission like spectrum; the stars 33 have strong Li absorption while stars 27 and 32 are reported to vary in the NIR. Therefore these stars appear to have characteristics of CTT stars. Another group of 12 stars (6, 15, 23, 29, 31, 34, 53, 90, 91, 92, 99, 178) occupy the location of weak-line T Tauri (WTT) stars. Six of these show weak excesses and the rest do not show any excess. Two of them (92 and 99 - both F8), probably belong to the post-T Tauri phase and are about to reach the ZAMS.
The stars 87, 149 and 151 are either giants or supergiants of K spectral type. Star 87 also shows CaII HK emissions and moderate IR excess while the star 151 is a variable (Sagar & Joshi 1978) and shows strong IR excess. Their distinct location a little to the left and above the reddened MS suggests that these may be supergiants. In fact two of these stars (149, 151) have been reported in the literature as probable post-asymptotic giant branch (AGB) candidates (van den Ancker et al. 1997).
5.3 Spectral energy distributions (SEDs)
The presence of circumstellar material, their geometry and the nature of radiation is best studied by SEDs covering the MIR region. The SEDs are derived using reddening corrected broad-band fluxes. The reddened broad-band optical and NIR fluxes were taken from Table 4 while MIR fluxes are taken from Table 5. The dereddened fluxes were derived using dependent analytical expression given by Cardelli et al. (1989). The values of Teff (effective temperature) and log() (gravity) corresponding to the adopted spectral type are taken from Schmidt-Kaler (1982). The reddened, dereddened and synthetic KURUCZ (1993) spectra based on Teff and log() were plotted and found to match in all the cases authenticating the determination of temperature, gravity and reddening. Fig. 12 provides these plots for stars having fluxes at MIR bands. The synthetic spectra are normalised at the band. The MIR region contains fluxes at 6 bands (7, 12, 15, 25, 60, 100 m). Of 65 stars with MIR fluxes, 32 have fluxes at more than 2 bands while another 13 have fluxes at 2 bands only. We determined the spectral index defined as ( ), in the region (2.2 to 25 m) as most of the known IRAS fluxes at 60 and 100 m are only upperlimits. The value of is listed in Table 5. It is seen that 17 stars have value of close to -3.0 representing a black-body (see Fig. 12). Another group of 17 stars have fluxes only at one, two or three bands but their values deviate significantly, however these determination may be considered uncertain. The remaining 31 stars have fluxes at more that 3 MIR bands and may be considered a reliable determination of spectral index (Table 5). The values of , if available, deviate significantly from blackbodies for the probable PMS stars with circumstellar material (Table 12). In addition, there is a group of MS and post-MS stars which also appears to deviate from blackbodies and are considered to be probable candidate with circumstellar material. The list of these stars, 37 in total, are provided in Table 12.
6 Evolutionary status and nature of individual stars
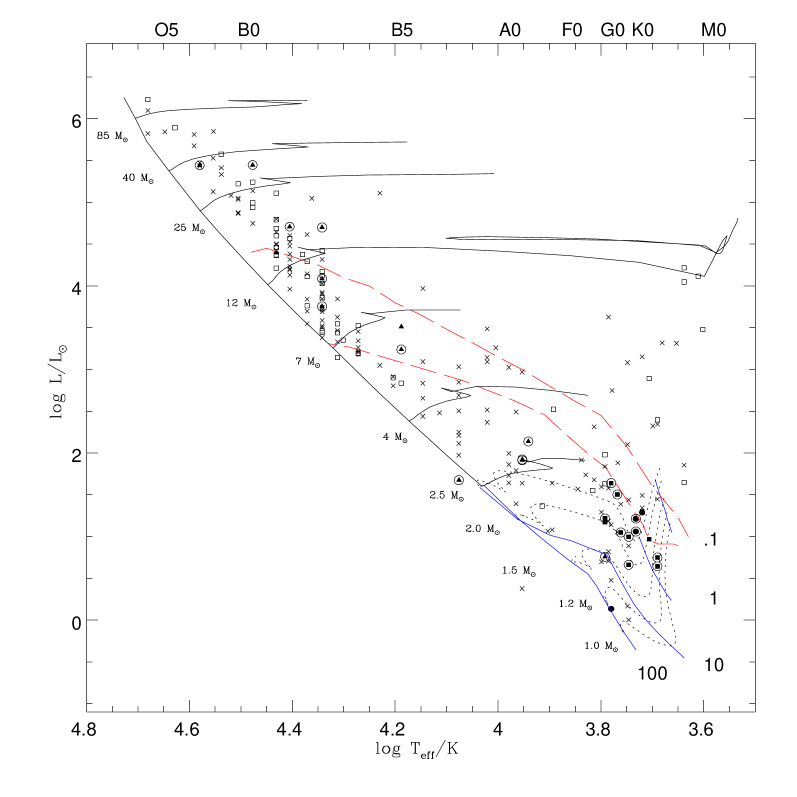
The luminosity was derived using log(L/L⊙) = 1.9 - 0.4Mbol, where Mbol is written as MJ + + BCV. The BCV is taken from Massey et al. (1989), Code et al. (1976) and Bessell & Brett (1988). MJ is derived using the cluster distances as given in Table 1 and the AJ is given as 0.28 AV. The uncertainty in luminosity is mainly contributed by uncertainty in J magnitude apart from the uncertainties in bolometric corrections, distances and extinction. All added together amounts to a maximum uncertainty of 0.06 in log(L). The uncertainties in log(Teff) are generally below 0.02. The Hertzsprung-Russell diagram (HRD) of all the program stars is shown in Fig. 13. The selected clusters have PMS (turn-on) age in the range 1 to 3 Myr and age spreads 8 Myr (see Table 1), where PMS age denotes the median value of the age distribution of individual stars while the value of age spread contains 95% of the stars in the cumulative age distribution (Park et al. 2000). The turn-on ages usually agree with the turn-off ages and provide clues on the duration of star formation. The derived PMS age and in particular, the age spread, depends on the treatment of convection and opacity in stellar atmospheres and is found to vary widely from model to model (see Hartigan et al. 1994; Park et al. 2002; Wolff et al. 2003). We have chosen the frequently used PMS tracks by D’Antona & Mazittelli (1994) as none of our stars have masses below 1 M⊙. In the HRD of sample clusters, the stars with masses 3 M⊙ are on the MS whereas the low mass stars ( 2-3 M⊙, i.e. 25% of the sample) are still in their PMS stage. In the present sample, most of the identified PMS stars lie around the 2 Myr evolutionary track and are below the birthline (Fig. 13), however, some of the stars are non-members and lie above the birthline. The spread seen in the MS is probably due to the effect of binarity, variability and uncertainty in the flux conversions than the real evolutionary effects on the MS. The HRDs of the clusters have been used to infer the nature and evolutionary status of individual stars as described below.
6.1 Clusters
NGC 1976 is a an open cluster with a high proportion of low-mass stars, a median age 1 Myr and an age spread 8.5 Myr as derived from PMS stars (Park et al. 2002). Fifty five to 99% of the low-mass stars in NGC 1976 are found to have circumstellar disks from NIR data by Hillenbrand et al. (1998). Our sample contains 19 stars with masses ranging from 1 to 3 M⊙ and ages from 1 to 3 Myr except stars 4, 10, 38 and 39 which have low luminosity and show ages 10 Myr. The latter are PM members with typical to NGC 1976 and have masses below 1.5 M⊙ with no PMS characteristics. Therefore, these are probably in the post-T Tauri phase with a nearly edge-on disk (Park et al. 2002). Eleven of these stars show PMS characteristics. The stars 5, 27, 32 and 33 show CTT characterisctics as is seen from strong NIR excesses, their location in dereddened NIR color-color diagram (as all of them lie along the CTT loci), Hα emission (EW 6 Å) and a circumstellar disk as seen from the CaII T line widths. These are identified as PMS objects in the literature. The stars 6, 12, 15, 23, 29, 31 and 34 have weak NIR excess, low or absent emission activities and some show light variability in the NIR suggesting that these are WTT stars, though a further investigation is needed to know their true nature. The CaII T measurements for stars 6 and 23 indicate them to have a weak accretion disk supporting the recent finding by Littlefair et al. (2003) that WTT stars also possess accretion disks in contrary to the earlier conception that they are non-accreting diskless objects. A recent PM study by Tian et al. (1996) makes star 6 a non-member (zero probability of membership) whereas the star has weak NIR excess, shows Ca II emission and is variable in the NIR light (Carpenter 2001) suggesting that it is a PMS object. The stars 6, 15, 23 and 29 are reported to show emission features for the first time. Another group of three intermediate mass stars (8, 22, 35) show PMS characteristics and probably belong to the HAB group. The star 35 is a well known HAB star (Herbig 1994; Hillenbrand et al. 1992; Maheswar et al. 2002; Leinert et al. 1997). The stars 8 and 22 have Hα filled-in with emission and show weak NIR excesses. As star 8 is located very close to star 35 in the HRD and is of early A type, it is most likely a HAB star. Further study is required to probe the true nature of star 8 and 22. The remaining group of 22 stars lie on the MS. Of these, stars 1, 12, 13, 14, 24, 30, 36 and 41 are found to have circumstellar material as is seen either from a weak NIR excess or above zero value of the MIR spectral index, . The mean value of for these stars is above zero, suggesting that they contain cool circumstellar dust. These are probable Vega-like stars or are precursors to such a phenomenon. The Vega-like stars are characterised by substantial far infrared excesses due to cool dust, relatively low NIR excesses, low polarization and a lack of emission lines in their spectra. In fact, one of these stars (13) has recently been studied in detail and was identified to have Vega-like characteristics by Manoj et al. (2002).
NGC 2244 is a young cluster and the recent studies suggest on-going star formation in the region (Pérez 1991, Berhöfer & Christian 2002). It has a median PMS age 1.9 Myr and an age spread of 6 Myr (Park & Sung 2002). Though Massey et al. (1995) suggests the existence of intermediate mass PMS stars, but a recent study by Park & Sung (2002) found a gap near 2M⊙, and the most massive PMS stars reported are of spectral type G2. Our sample contains 16 stars of spectral type later than A0, many of these are non-members as judged by more than one membership indicator supporting the scarcity of PMS objects near A0. The stars 48, 51, 54, 55, 59, 63, 69 and 86 are non-members (see Sect. 4.2). The stars 47, 53, 60 and 85 are PM members but their locations in the HRD suggests them to be non-members. Moreover, the star 60 has a value of 0.45 indicating that it is surrounded by cold circumstellar material, therefore it may also be a candidate PMS star. The stars 45 and 46 are PM non-members while the stars 62 and 87 appear to be members. The star 62 is probably an early A type Vega-like MS star with cool circumstellar dust as indicated by index while star 87 is probably a red-supergiant with mass 12 M⊙ and age 20 Myr. The remaining group of 28 stars are probably on the MS with masses in the range 3 to 80 M⊙. Of these, star 71 shows Vega-like characteristics.
Being a nearby cluster, NGC 2264 harbors a number of peculiar stars and has frequently been used to test PMS evolutionary models, to study the IMF and to understand the role of stellar variability in stellar evolution (Walker 1956; Kippenhahn 1965; Flaccomio et al. 1999; Park et al. 2000, 2002; Rebull et al. 2002). It is observed to have an age of 1.5 Myr and age spread 9 Myr. Our sample contains 19 stars and most of them are of spectral type A0 and later. The identified PMS stars (92, 99, 100, 101) do lie in the expected age range. The star 91 lies on the ZAMS and shows CaII HK in weak emission, therefore it is probably a foreground MS star or a BMS (below or near ZAMS) star in post T Tauri phase. The BMS stars are T Tauri stars with nearly edge-on disks which obscures the light from the central star and makes them low luminosity. Observations indicate that 3 to 5% of the stars with disks are edge-on systems (Park et al. 2002). The star 90 shows light-variability and is a field star. The stars 93, 103, 105 and 106 lie above the birthline and have large value of , therefore they are probably background non-members. The star 104, of A type, also appears to be a foreground non-member located far below the ZAMS. Among the intermediate mass objects, stars 97 and 98 are reported to be PMS candidates (Sung et al. 1997; Park et al. 2002). These are HAB stars. The stars 94 and 95 have weak NIR excesses and are located on the MS, therefore we consider them as candidates for Vega-like cluster members.
Star formation and PMS stars in NGC 6530 have been studied in detail by van den Ancker et al. (1997) and by Sung et al. (2000). It has a PMS age of 1.5 Myr with an age spread of 5 Myr. In HRD, the stars 117, 143, 145, 149 and 151 are located well above the birthline and are foreground non-members, though stars 149 and 151 are more luminous, show NIR excesses and are reported to be probable post-AGB candidates (van den Ancker et al. 1997). The star 151 also shows light variability. The post-MS track for a 12 M⊙ appears to follow their location in the HRD. These as well as the star 87 in NGC 2244 occupy red-giant branch (RGB) locations in the HRD, however, a 10 M⊙ evolutionary track would place them in an AGB phase pushing the age a little older to 30 Myr. So, the indicators do support these being cluster members in either RGB, AGB or post-AGB phases. If this scenario for cluster NGC 2244 and 6530 is true then these are the stars formed 20 to 30 Myrs ago extending the duration of star formation to a few tens of Myrs, although a further spectroscopic investigation is needed to confirm the nature of these stars. The star 114 is a foreground giant with a very low . Among the remaining objects, stars 109, 115, 122 and 126 have weak to moderate excesses and show Hβ in emission. Moreover, the stars 109, 122 and 126 also occupy separate positions in the dereddened NIR color-color diagram. They are probable Group II HAB stars as the values of for star 109 and 126 are above or near zero. Star 122 is suggested to be a HAB star by Boesono et al. (1987). Star 115 lies on the reddening line track in the NIR color-color diagram, hence this is a candidate Be star. Another group of 8 stars (110, 111, 119, 121, 129, 134, 136, 146) show Vega-like characteristics most showing substantial MIR excesses.
NGC 6611 is also well studied and is reported to contain hundreds of low-mass PMS stars with a median age of 2 Myr and an age spread 7 Myr (Hillenbrand et al. 1993; Belikov et al. 2000). In the HRD, the stars 177, 178 and 185 lie well above the birthline and have mag, lower than the cluster mean 0.86 mag. A recent PM study by Belikov et al. (1999) assigns Pμ = 0.08 for star 177, so these stars may be non-members. Another group of 5 BD stars (181, 182, 183, 184, 186) have mag and are located well above the birthline, therefore these stars also could be non-members. The stars 174 and 176 occupy positions away from the MS. The former is just evolving off the MS and is probably a member while the latter may be affected by binarity. Star 174 with Hβ filled-in with emission and a candidate for a classical Be star is therefore more likely to be a cluster member. Stars 180 and 187, both of B type, are quite interesting and are member as indicated from their PM, , and HRD location, however these are located diagonally 20 arcmin away from the cluster center. The projected corona radius for the cluster is 15 arcmin (Belikov et al. 1999). Therefore if these are members then they probably formed in the outer region. Their location also indicates that the region of cluster formation would have been quite extended. Further kinematical data is required to authenticate these possibilities. Among remaining objects, stars 160, 173 and 175 have HAB characteristics. Star 160 has value of , near blackbody and shows no intrinsic polarisation (Orsatti et al. 2000), therefore it is probably a group III HAB or a classical Be star. Star 175 has and shows strong intrinsic polarisation suggesting it to be a group I HAB star. The stars 154, 155, 166, 171, 172 and 179 show MIR excesses, stars 155 and 171 are reported to be spectroscopic binary (Bosch et al. 1999) while stars 155 and 166 show intrinsic polarisation (Orsatti et al. 2000). Therefore all these stars appears to have circumstellar material and the stars 154, 166 and 172 are probable Vega-like.
NGC 6823 has an age 3 Myr and an age spread 9 Myr (Guetter et al. 1992; Pigulski et al. 2000). A recent study by Pigulski et al. (2000) indicates that the stars with spectral classes later than A0 are in their PMS phase. Stars 194, 199, 206, 208, 209 and 211 are non-members, stars 206 and 208 have PM membership 0.5 while others lie above the birth line. The spectrum obtained by us indicates that star 209 is a late A type star, though it is reported to be of G8 type by Shi & Hu (1999). The remaining stars 18 in total are cluster members. Star 195 occupies a position slightly away from the MS and is reported to show light variability. It is either a binary or a single star about to leave the MS. Of these, stars 188, 200, 203 and 204 have circumstellar material as indicated from MIR spectral indices. The value of for star 210 is above zero and it is a probable candidate Vega-like star. Star 188 has recently been argued to be a hot post-AGB candidate (Gauba et al. 2003) based on its IR excess, but, being a PM member this is unlikely to be in a post-AGB phase.
6.2 Stars
Membership indicators suggest that the sample contains 34 non-members and 10 probable members while the remaining are members. These are indicated in the last column of Table 6. Around 16% of the PM members were found to be non-members in the present study and this is supported in a few cases by recent PM studies. The converse is also true in a few cases, for example star 6 is a PM non-member, but other indicators suggest it to be a bona-fide member. Out of the total 28 identified emission line stars, only 13 are of early type. Their characteristics suggests that they belong to the classical Be, Herbig Ae/Be or T Tauri populations. A group of 36 stars are reported to have weak to strong NIR excesses (29 members, 5 probable members and 2 non-members). Most of these are observed to be PMS objects. Another group of 6 stars (all members except one), show IR deficits. A group of 37 non-emission stars were identified to have circumstellar material as seen either from weak NIR excesses or MIR spectral indices. Of these, 25 (17 have above zero values of and 8 have weak NIR excesses) are Vega-like or precursors to such stars (see Table 12) - one of these stars (13) has recently been shown to have Vega-like characteristics by Manoj et al. (2002). Three of these stars (87, 149, 151) are probably in a highly evolved stage with ages 20 to 30 Myr and with masses 10 to 12 .
7 conclusions
We present the spectral and reddening properties of 211 highly reddened proper motion members (mostly early type with mag) in six young galactic clusters. The main conclusions of the study are given below.
(i) Emission features in CaII HK and HI lines are observed for a sample of 29 stars including 11 reported for the first time. We also provide either a new or more reliable spectral class for a sample of 24 stars. CaII triplet width measurements were used to indicate the presence of disks for a dozen stars, a few of them were found to be candidate weak-line T Tauri stars.
(ii) A significant fraction (70%) of cluster members in NGC 1976, NGC 2244, NGC 6530 and NGC 6611 show anomalous reddening with = , , and , respectively, indicating the presence of larger grain size dust in these star forming regions. A small number of stars in NGC 1976, NGC 2244 and NGC 6611 also show normal behavior while the cluster NGC 6823 appears to have normal reddening.
(iii) On the basis of spectral features, NIR excesses, dereddened color-color diagrams and MIR spectral indices we identify a highly probable group of 5 Herbig Ae/Be and 6 classical T Tauri stars. Moreover, a further probable group of 3 classical Be, 5 Herbig Ae/Be and 9 weak line T Tauri stars are also identified. These PMS population amount to 15% of the cluster members.
(iv) A total of 37 non-emission line stars, mostly of early type, were identified to have circumstellar material as seen from weak NIR excesses or MIR spectral indices. Of these, 25 or 10 % of the early-type MS members, appear to show Vega-like characteristics or are precursors to such a phenomenon.
(v) Three highly luminous late type giants in two of the six clusters appear to be members and are in the post-hydrogen-core-buring stage suggesting a prolonged duration ( 25 Myrs) of star formation in these clusters.
acknowledgements
We are grateful to Mount Stromlo Observatory, Australia for generous allotment of observing time. One of us (RS) is thankful to the IAU and the Anglo-Australian Observatory, Epping, Australia, for the financial support during the observations. We are thankful to Dr. A. K. Pandey for useful discussions. The present research makes use of data from (i) the open cluster data base at the website http://obswww.unige.ch/webda/ maintained by Dr. J. C. Mermilliod (ii) Two Micron All Sky Survey, which is a joint project of the university of Massachusetts and the Infrared Processing and Analysis center/California Institute of Technology, funded by the National Aeronautics and Space Administration and the National Science Foundation.
References
- [1] Abt H., 1970, ApJS 19, 387
- [2] Abt H. A., Levato H., 1977, PASP 89, 797
- [3] van Altena W. F., Jones B. F., 1972, A&A 20, 425
- [4] van Altena W. F., Lee J. T., Lee J. -F. et al., 1988, AJ 95, 1744
- [5] van den Ancker M. E., Thé P. S., Feinstein A., et a., 1997, A&AS 123, 63
- [6] Beichman C., Neugebauer G., Habing H. J. et al., 1988, in IRAS Catalogs and Atlases Explanatory Supplement, (Washington, DC: GPO), NASA RP-1190, vol 1
- [7] Belikov A. N., Kharchenko N. V., Piskunov A. E. et al., 1999, A&AS 134, 525
- [8] Belikov A. N., Kharchenko N. V., Piskunov A. E. et al., 2000, A&A 358, 886
- [9] Berghöfer T. W., Christian D. J., 2002, A&A 384, 890
- [10] Bessell M. S., 1979, PASP 91, 589
- [11] Bessell M. S., 1990, PASP 102, 1181
- [12] Bessell M. S., Brett J. M., 1988, PASP 100, 1134
- [13] Bessell M. S., 1999, PASP 111, 1426
- [14] Boesono B., Thé P. S., Tjin A Dijie H. R. E., 1987, Ap&SS 137 167
- [15] Boggs D., Böhm-Vitense E., 1989, ApJ 339, 209
- [16] Bohlin R. C., Savage B. D., 1981, ApJ 249, 109
- [17] Borgman J., 1960, Bull. Astron. Inst. Netherlands 15, 255
- [18] Bosch G. L., Morrell N. I., Niemelaö V. S., 1999, Rev. Mex. Astron. Astrofis. 35, 85
- [19] Breger M., Rybski P. M., 1975, PASP 87, 607
- [20] Breger M., 1976, ApJ 204, 789
- [21] Brown P. J. F., Dufton P. L., Lennon D. J. et al., 1986, A&A 155, 113
- [22] Burki G., 1975, A&A, 43, 37
- [23] Buscombe W., 1984, in Sixth General Catalogue of MK Spectral Classifications Northwestern University, Evanston, Illinois
- [24] Cannon A. J., Mayall W. M., 1949, Ann. Harvard Coll. Obs. 112
- [25] Cardelli J. A., Clayton G. C., Mathis J. A., 1989, ApJ 345, 245
- [26] Carpenter J. M., 2001, AJ 121, 2851
- [27] Code A. D., Bless R. C., Davis J., Brown R. H., 1976, ApJ 203, 417
- [28] Cohen M., Kuhi L. V., 1979, ApJS 41, 743
- [29] Conti P. S., 1974, ApJ 187, 589
- [30] Conti P. S., Leep E. M., 1974, ApJ 193, 113
- [31] Conti P. S., Frost S. A., 1977, ApJ 212, 728
- [32] Cutri R. M., 1998, BAAS 30, No. 2, 64.02
- [33] D’Antona F., Mazittelli I., 1994, ApJS 90, 467
- [34] Duchêne G., Simon T., Eisloffel J. et al., 2001, A&A 379, 147
- [35] Egret D., Wenger M., Dubois P., 1991, in Databases and On-line Data in Astronomy, ed. M. A. Albrecht, D. Egret, p. 79
- [36] Elmegreen B. G., Lada C. J., 1977, AJ 214, 725
- [37] Erickson R. R., 1971, A&A 10, 270.
- [38] FitzGerald M. P., 1970, A&A 4, 234
- [39] Flaccomio E., Micela G., Sciortino S. et al., 1999, A&A 345, 521
- [40] Garrison R. F., Hiltner W. A., Schild R. E., 1977, ApJS 35, 111
- [41] Gauba G., Parthasarathy M., Kumar B. et al., 2003, A&A 404, 305
- [42] Greenstein J. L., Struve O., 1946, PASP 58, 366
- [43] Guetter H. H., 1968, PASP 80, 197
- [44] Guetter H. H., 1992, AJ 103, 197
- [45] Gullbring E., Hartmann L., Briceno C. et al., 1998, ApJ 492, 323
- [46] Guseva N. G., 1985, Astrophysics 22, 299
- [47] Hartigan P., Strom K. M., Strom S. E., 1994, ApJ 427, 961
- [48] He L., Whittet D. C. B., Kilkenny D. et al., 1995, ApJ 101, 335
- [49] Hensberge H., Vrancken M., Verschueren W., 1998, A&A 339, 141
- [50] Hensberge H., Pavlovski K., Verschueren W., 2000, A&A 358, 553
- [51] Herbig G. H., 1954, ApJ 119, 483
- [52] Herbig G. H., 1960, ApJS 4, 337
- [53] Herbig G. H., Rao K. N. 1972, ApJ 174, 401
- [54] Herbig G. H., Bell K. R., 1988, Catalog of emission line stars of the Orion population, Lick Obs. Bull. 4, 1
- [55] Herbig G. H. 1994, ASP Conf. Ser. 62, 3
- [56] Hillenbrand L. A., Strom S. E., Vrba F. J. et al., 1992, ApJ 397, 613
- [57] Hillenbrand L. A., Massey P., Strom S. E. et al., 1993, AJ 106, 1906
- [58] Hillenbrand L. A., Strom S. E., Calvet N. et al., 1998, AJ 116, 1816
- [59] Hillenbrand L. A., 2003, Origins 2002: The Heavy Element Trail from Galaxies to Habitable Worlds, ed. C. E. Woodward, E. P. Smith, ASP Conf. Ser.
- [60] Hiltner W. A., 1956, ApJS 2, 389
- [61] Hiltner W. A., Morgan W. W., Neff J. S., 1965, ApJ 141, 183
- [62] Hiltner W. A., Morgan W. W., 1969, AJ 74, 1152
- [63] Hoag A. A., Smith E.P., 1959, PASP 71, 32
- [64] Hoag A. A., Applequist L., 1965, ApJS 12, 215
- [65] Houk N., Cowley A. P., Smith-Moore M., 1975, IAUCo 32, 357
- [66] Houck N., Smith-Moore M., 1988, The University of Michigan Cat. of Two-Dimensional Spectral Types for the HD Stars, Vol. 4
- [67] Humphreys R. M., 1978, ApJS 38, 309
- [68] Jacoby G. H., Hunter D. A., Christian C.A., 1984, ApJS 56, 257
- [69] Jaschek C., Jaschek M., 1990, in The Classification of Stars, Cambridge Univ. Press
- [70] Jeffers H. M., Bos W. H., van den Greeby F. M., 1963, Publ. Lick Obs., Vol. 21
- [71] Johnson H. L., Hiltner W. A., 1956, ApJ 123, 267
- [72] Johnson H. L., 1962, ApJ 136, 1135
- [73] Johnson H. L., Borgman J., 1963, Bull. Astron. Inst. Netherlands 17, 115
- [74] Johnson H. M., 1965, ApJ 142, 964
- [75] Johnson H. L., 1966, ARA&A 4, 193
- [76] Johnson H. L., 1967, ApJ 150, 39
- [77] Johnson H. L., 1968, in Stars and Stellar Systems, Vol. 7, Nebulae and Interstellar matter, ed. B. M. Middlehurst, L. H. Aller, Univ. Chicago Press
- [78] Kamp L.W., 1974, A&AS 16, 1
- [79] Kholopov P. N., Samus N. N., Frolov M. S. et al., 1998, Combined general catalogue of variable stars, 4.1 Ed(II/214A)
- [80] Killian-Montenbruck J., Gehren T., Nissen P. E., 1994, A&A 291, 757
- [81] Kippenhahn R., 1965, Veroeffentlichungen der Remeis-Sternwarte zu Bamberg, Nr. 40, 7
- [82] Kohoutek L., Wehmeyer R., 1997, Abhandlungen aus der Hamburger Sternwarte, Band XI, Teil 1
- [83] Koornneef J., 1983, A&A 128, 84
- [84] Krelowski J., Strobel A., 1979, Acta Astron. 29, 211
- [85] Krelowski J., Strobel A., 1987, A&A 175, 186
- [86] Kurucz R. L., 1993, private communication
- [87] LaSala J., Kurtz M. J., 1985, PASP 97, 605
- [88] Leinert C., Richichi A., Haas, M., 1997, A&A 318, 472
- [89] Lesh J.R., 1968, ApJS 17,371
- [90] Levato H., Abt H. A., 1976, PASP 88, 712
- [91] Littlefair S. P., Naylor T., Harries T. J. et al., 2003, MNRAS, in press
- [92] Maheswar G., Manoj P., Bhatt H. C., 2002, A&A 387, 1003
- [93] Manoj P., Maheswar G., Bhatt H. C., 2002, MNRAS 334, 419
- [94] Marcy G. W., 1980, AJ 85, 230
- [95] Margulis M., Lada C. J., 1984, Occ. Rep. R. Obs. Edin., No. 13, 41
- [96] Marschall L. A., van Altena W. F., Chiu L. T. C., 1982, AJ 87, 1497
- [97] Martin P. G., Whittet D. C. B., 1990, ApJ 357, 113
- [98] Massey P., Parker J. W., Garmany G. D., 1989, AJ 98, 1305
- [99] Massey P., Johnson K. E., DeGioia-Eastwood K., 1995, ApJ 454, 151
- [100] Mathis J. S., 1990, ARA&A 28, 37
- [101] McMillan R. S., 1977, ApJ 216, L41
- [102] McNamara B. J., 1976, AJ 81, 845
- [103] McNamara B. J., Huels S., 1983, A&AS 54, 221
- [104] Meeus G., Waters L. B. F. M., Bouwman J. et al., 2001, A&A 365, 476
- [105] Mendez M. E., 1967, Bol. Obs. Tonantzintla y Tacubaya 4, 91
- [106] Mendoza V. E. E., Gömez T., 1980, MNRAS 190, 623
- [107] Mermilliod J.-C., Paunzen E., 2003, A&A 410, 511
- [108] Meyer M. R., Calvet N., Hillenbrand L. A., 1997, AJ 114, 288
- [109] Millward C. G., Walker G. A. H., 1985, ApJS 57, 63
- [110] Morgan W. W., Code A. D., Whitford A. E., 1955, ApJS 2, 41
- [111] Morgan W. W., Hiltner W. A., Neff J. S. et al., 1965, ApJ 142, 974
- [112] Morrison N. D., Conti P. S. 1978, ApJ 224, 558
- [113] Ogura K., Ishida K., 1981, PASJ 33, 149
- [114] Omont A., Gilmore G. F., Alard C. et al., 2003, A&A 403, 975
- [115] Orsatti A. M., Vega E. I., Marraco H. G., 2000, A&AS 144, 195
- [116] Palla F., Stahler S. W., 1993, ApJ 418, 414
- [117] Pandey A. K., Mahra H. S., Sagar R., 1990, AJ 99, 617
- [118] Pandey A. K., Upadhyay K., Nakada Y. et al., 2003, A&A 388, 158
- [119] Parenago P. P., 1954, Trudy Sternberg Astron. Inst. Vol. 25
- [120] Park B.-G., Sung H., Bessell M. S. et al., 2000, AJ 120, 894
- [121] Park B.-G., Sung H., 2002, AJ 123, 892
- [122] Park B.-G., Sung H., Kang Y. H. et al., 2002, J. Korean Astron. Soc. 35, 197
- [123] Parthasarathy M., 1974, Bull. Astron. Soc. India 2, 37
- [124] Parthasarathy M., Vijapurkar J., Drilling J. S., 2000, A&AS 145, 269
- [125] Penny L. R., 1996, ApJ 463, 737
- [126] Penston M. V., Hunter J. K., O’Neill A., 1975, MNRAS 171, 219
- [127] Pérez M. R., Thé P. S., Westerlund B. E., 1987, PASP 99, 1050
- [128] Pérez M. R., 1988, PhD thesis
- [129] Pérez M. R., 1991, Rev. Mex. Astron. Astrofis 22, 99
- [130] Pigulski A., Kolaczkowski Z., Kopacki G., 2000, Acta Astron. 50, 113
- [131] Price S. D., Egan M. P., Carey S. J. et al., 2001, AJ 121, 2819
- [132] Pronik I. I., 1958, Publ. Krym. Obs. 20, 208
- [133] Qian Z. Y., Sagar R., 1994, MNRAS 266, 114
- [134] Rebull L. M., Makidon R. B., Strom S. E. et al., 2002, AJ 123, 1528
- [135] Rieke G. H., Lebofsky M. J., 1985, ApJ 288, 618
- [136] Riddle R. K., 1972, A study of a region in Monoceros, PhD thesis, Univ. of Maryland
- [137] Rydgren A. E. 1979, AJ 84, 90
- [138] Rydgren A. E., Vrba F.J., 1987, PASP 99, 482
- [139] Sabogal-Martínez B. E., García-Varela M. A., Higuera G. et al., 2001, Rev. Mex. Astron. Astrofis. 37, 105
- [140] Sagar R., Joshi U. C., 1978, MNRAS 184, 467
- [141] Sagar R., Joshi U. C., 1979, A&AS 66, 3
- [142] Sagar R., Joshi U. C., 1981, Ap&SS 75, 465
- [143] Sagar R., Joshi U. C., 1983, MNRAS 205, 747
- [144] Sagar R., 1987, MNRAS 228, 483
- [145] Sagar R., Qian Z. Y., 1993, Bull. Astron. Soc. India 21, 565
- [146] Schaller G., Schaerer D., Meynet G., Maerder A., 1992, A&AS 96, 269
- [147] van Schewick H., 1962, Veröff. Univ. Sternwarte Bonn, No. 62
- [148] Schild R., Romanishin W., 1976, ApJ 204, 493
- [149] Schmidt-Kaler Th., 1982, Landolt Börstein Catalogue, Vol. VI/2b
- [150] Schuller F., Ganesh S., Messineo M. et al., 2003, A&A 403, 955
- [151] Sharpless S., 1952, ApJ 116, 251
- [152] Shi H. M., Hu J. Y., 1999, A&AS 136, 313
- [153] Simon T., Cash W., Snow T. P. Jr., 1985, ApJ 293, 542
- [154] Skrutskie M. F., Schneider S. E., Stiening R. et al., 1997, in The Impact of Large Scale near-IR Sky Surveys, ed. F. Garzon et al., (Dordrecht: Kluwer), 25
- [155] Smith M. A., 1972, ApJ 175, 765
- [156] Strand K. A., 1958, ApJ 128, 14
- [157] Sung H., Bessell M. S., See-Woo L., 1997, AJ 114, 2644
- [158] Sung H., Chun M.-Y., Bessell M. S., 2000, AJ 120, 333
- [159] Terranegra L., Chavarria-K C., Diaz S. et al., 1994, A&AS 104, 557
- [160] Thé, P. S., de Winter, D., Feinstein, A. et al., 1990, A&AS 82, 319
- [161] Tian K. P., van Leeuwen Zhao, J. L. et al., 1996, A&AS 118, 503
- [162] Tonry J., Davis M., 1979, AJ 84, 1511
- [163] Torres A. V., 1987, ApJ 322, 949
- [164] Tucholke H. -J., Geffert M., Thé P. S., 1986, A&AS 66, 311
- [165] Turner D. G., 1979, J. R. Astron. Soc. Can. 73, 74
- [166] Vasilevskis S., Sanders W. L., Balk A. C. A., 1965, AJ 70, 797
- [167] Verschueren W., 1991, PhD Thesis, Free Univ. Brussels
- [168] Walborn N. R., 1972, AJ 77, 312
- [169] Walborn N. R., 1973, AJ 78, 1067
- [170] Walborn N. R., 1982, AJ 87, 1300
- [171] Walker G. A. H., Hodge S. M., 1968, PASP 80, 290
- [172] Walker M. F., 1956, ApJS 2, 365
- [173] Walker M. F., 1957, ApJ 125, 636
- [174] Walker M. F., 1961, ApJ 133, 438
- [175] Walker M. F., 1969, ApJ 155, 447
- [176] Walker M. F., 1983, ApJ 271, 642
- [177] Warner J. W., Strom S. E., Strom K. M., 1977, ApJ 213, 427
- [178] Whittet D. C. B., van Breda I. G., 1980, MNRAS 192, 467
- [179] Wilson R. E., 1953, in General Catalogue of Stellar Radial Velocities, Carneige Institution of Washington Publications, No. 601
- [180] de Winter D., Koulis C., Thé P. S. et al., 1997, A&AS 121, 223
- [181] Wolff S. C., Strom S. E., Hillenbrand L. A., 2003, ApJ, in press
- [182] Yadav R. K. S., Sagar R., 2001, MNRAS 328, 370
- [183] Yadav R. K. S., Sagar R., 2002, MNRAS 337, 133
- [184] Young A., 1978, PASP 90, 144
- [185] Zappala R. R., 1972, ApJ 172, 57
| Cluster | Age | Distance | Memb. | Source | Samples | |
|---|---|---|---|---|---|---|
| (Myr) | (kpc) | (mag) | (p 50%) | |||
| NGC 1976 | 1.0(9) | 0.47 | 0.06 (0.02-1.00) | 50 | McNamara and Huels (1983) | 44 |
| NGC 2244 | 1.9(6) | 1.70 | 0.47 (0.40-0.56) | 100 | Marshall et al. (1982) | 43 |
| NGC 2264 | 1.5(9) | 0.76 | 0.07 (0.06-1.20) | 140 | Vasilevskis et al. (1965) | 19 |
| NGC 6530 | 1.5(5) | 1.80 | 0.35 (0.25-0.50) | 88 | van Altena and Jones (1972) | 45 |
| NGC 6611 | 2.0(7) | 2.14 | 0.86 (0.40-1.60) | 50 | Kamp (1974) | 36 |
| NGC 6823 | 3.0(9) | 2.10 | 0.85 (0.60-1.16) | 41 | Erickson (1971) | 24 |
| Spectrographs | Grating | Dispersion | CCDs | ||
|---|---|---|---|---|---|
| (g/mm) | Å/mm | Å/pixel | (Å) | ||
| BCS | 258 | 260 | 5.7 | 4825 | GEC (576 380, 22) |
| DBS-B | 300 | 140 | 4.5 | 4500 | SITe(1752 532, 15) |
| DBS-R | 316 | 280 | 4.1 | 8400 | SITe(1752 532, 15) |
| Date | Telescope | Instrument | Clusters | Objects | Standards | Arcs |
|---|---|---|---|---|---|---|
| 13/14 Aug 1989 | 1-m | BCS | NGC 6611 | 36 | 10 | 1 |
| 13/14 Aug 1989 | 1-m | BCS | NGC 6530 | 42 | 14 | - |
| 08/09 Oct 1995 | 2.3m | DBS | NGC 2244 | 12 | 15 | 2 |
| 09/10 Oct 1995 | 2.3m | DBS | NGC 1976, 2244 | 31 | 16 | 1 |
| 10/11 Oct 1995 | 2.3m | DBS | NGC 1976, 2244, 6823 | 38 | 7 | - |
| 11/12 Oct 1995 | 2.3m | DBS | NGC 6530, 6823 | 8 | 1 | - |
| 12/13 Oct 1995 | 2.3m | DBS | NGC 1976, 2264, 6530, 6823 | 38 | 9 | - |
| 13/14 Oct 1995 | 2.3m | DBS | NGC 1976, 2264 | 25 | 4 | - |
| ID | Object | Others | p(%) | SpT | Ref. | (U-V) | (B-V) | V | (V-R) | (V-I) | (V-J) | (V-H) | (V-K) |
|---|---|---|---|---|---|---|---|---|---|---|---|---|---|
| 1* | N1976 P1044 | HD 36629 | 96 | B2.5 IV | 28 | 0.64 | 0.01 | 7.69 | 0.10 | - | 0.19 | 0.13 | 0.17 |
| 2 | N1976 P1049 | 61 | K2 IV | 22 | 3.14 | 1.60 | 11.87 | - | - | 3.11 | 3.90 | 4.11 | |
| 3* | N1976 P1212 | HD 294224 | 92 | B8 V | 26 | 1.15 | 0.69 | 11.39 | 0.49 | 0.98 | 1.62 | 1.87 | 2.04 |
| 4* | N1976 P1360 | 87 | G8 V | 32 | 1.36 | 0.94 | 13.81 | - | - | 1.60 | 2.03 | 2.16 | |
| 5* | N1976 P1409 | EZ Ori | 94 | F8 Vn(e) | 32 | 1.16 | 0.86 | 11.57 | 0.48 | 0.98 | 1.90 | 2.61 | 3.15 |
| 6* | N1976 P1469 | 73 | G9 IV-V | 24 | 1.38 | 1.19 | 11.92 | 0.58 | 1.13 | 2.29 | 2.96 | 3.23 | |
| 7 | N1976 P1539 | 92 | B8: | 17 | 1.00 | 0.71 | 10.77 | 0.54 | 1.06 | 1.69 | 1.94 | 2.04 | |
| 8* | N1976 P1623 | BD -05o1306 | 93 | A2 Vp | 25 | 1.00 | 0.57 | 10.13 | 0.44 | 0.84 | 1.35 | 2.13 | 2.88 |
| 9 | N1976 P1683 | BD -05o1309 | 92 | A0 | 17 | 0.85 | 0.46 | 10.93 | 0.27 | 0.53 | 0.89 | 0.97 | 1.08 |
| 10* | N1976 P1699 | 83 | G0 V | 32 | 0.87 | 0.81 | 13.04 | 0.46 | 0.96 | 1.70 | 2.12 | 2.19 | |
| 11 | N1976 P1712 | BD -05o1310 | 91 | B9 | 17 | 0.83 | 0.57 | 10.47 | 0.40 | 0.68 | 1.30 | 1.54 | 1.70 |
| 12 | N1976 P1736 | 95 | G5 | 17 | 2.01 | 1.27 | 11.11 | 0.90 | 1.64 | 2.94 | 3.57 | 3.96 | |
| 13* | N1976 P1772 | HD 36982 | 96 | B2 V | 25 | 0.52 | 0.09 | 8.46 | 0.18 | 0.42 | 0.72 | 0.82 | 1.01 |
| 14 | N1976 P1798 | HD 294264 | 94 | B3 Vn | 18 | 0.05 | 0.36 | 9.47 | 0.29 | 0.69 | 1.38 | 1.73 | 1.91 |
| 15* | N1976 P1799 | LT Ori | 96 | K0? IV,V? | 32 | 1.98 | 1.36 | 12.76 | 0.74 | 1.82 | 3.22 | 3.90 | 4.17 |
| 16* | N1976 P1854 | HD 294263 | 95 | A0 | 8 | 0.49 | 0.33 | 10.10 | - | - | 0.80 | 0.97 | 1.09 |
| 17* | N1976 P1863 | HD 37021 | 95 | B0 V | 16 | 0.04 | 0.23 | 7.72 | - | - | 2.09 | 2.39 | 2.37 |
| 18* | N1976 P1865 | HD 37020 | 96 | B0.5 V | 25 | 0.85 | 0.03 | 6.74 | 0.22 | 0.42 | 1.94 | 2.13 | 2.01 |
| 19 | N1976 P1881 | HD 294262 | 85 | A0 | 17 | 0.11 | 0.21 | 9.81 | - | - | 1.05 | 1.27 | 1.44 |
| 20* | N1976 P1885 | MR Ori | 93 | A2: V | 1 | 0.49 | 0.34 | 10.55 | 0.28 | 0.69 | 1.31 | 1.57 | 1.71 |
| 21* | N1976 P1889 | HD 37023 | 96 | B0.5 V | 25 | 0.73 | 0.08 | 6.68 | 0.18 | 0.38 | 0.62 | 0.79 | 0.95 |
| 22* | N1976 P1891 | HD 37022 | 96 | O6: | 25 | 0.97 | -0.02 | 5.14 | 0.14 | 0.32 | 0.63 | 0.81 | 0.96 |
| 23* | N1976 P1955 | 90 | G0-1 IV-III | 26 | 1.69 | 1.09 | 10.91 | 0.61 | 1.28 | 2.26 | 2.85 | 3.06 | |
| 24* | N1976 P1956 | V1230 Ori | 90 | B2: V | 25 | 0.11 | 0.32 | 9.61 | 0.13 | 0.60 | 1.54 | 2.01 | 2.26 |
| 25* | N1976 P1993 | HD 37041 | 93 | O9.5 V | 25 | 1.04 | -0.08 | 5.06 | 0.03 | - | 0.15 | 0.14 | 0.24 |
| 26* | N1976 P2001 | V358 Ori | 94 | G8 V, K3 | 8 | 1.24 | 0.90 | 12.44 | 0.55 | 1.32 | 2.21 | 2.82 | 2.94 |
| 27* | N1976 P2029 | AI Ori | 93 | G3: IV-V | 24 | 2.64 | 1.81 | 12.26 | 0.79 | 1.92 | 3.26 | 4.37 | 5.31 |
| 28* | N1976 P2033 | V1232 Ori | 94 | G3 IV-V | 24 | 1.07 | 0.91 | 11.73 | 0.61 | 1.14 | 2.03 | 2.58 | 2.79 |
| 29* | N1976 P2069 | 97 | G8 V | 8 | 2.43 | 1.15 | 12.20 | 0.52 | 1.36 | 2.25 | 2.90 | 3.08 | |
| 30* | N1976 P2074 | HD 37061 | 94 | B0.5 V | 25 | 0.43 | 0.26 | 6.83 | 0.28 | 0.57 | 1.08 | 1.24 | 1.36 |
| 31 | N1976 P2100 | 96 | G9: IV-Ve: | 24 | 2.04 | 1.20 | 11.77 | 0.56 | 1.47 | 2.46 | 3.16 | 3.40 | |
| 32* | N1976 P2115 | TV Ori | 77 | K2 IV(e) | 32 | 1.92 | 1.17 | 13.40 | - | 1.36 | 3.09 | 3.83 | 4.31 |
| 33* | N1976 P2181 | V500 Ori | 95 | K2: V (Li) | 32 | 2.07 | 1.20 | 12.93 | 0.63 | 1.67 | 2.94 | 3.64 | 4.06 |
| 34* | N1976 P2244 | 97 | K1-2 V(e) | 32 | 2.05 | 1.19 | 12.62 | 0.69 | 1.38 | 2.67 | 3.34 | 3.53 | |
| 35* | N1976 P2247 | T Ori | 93 | B8-A3 Vp | 14 | 0.82 | 0.41 | 10.00 | 0.08 | 0.40 | 1.73 | 2.76 | 3.85 |
| 36 | N1976 P2248 | 95 | B4 V | 24 | 0.47 | 0.63 | 11.31 | 0.59 | 1.23 | 2.44 | 2.97 | 3.27 | |
| 37 | N1976 P2302 | HD 37130 | 87 | B9 | 17 | 0.12 | 0.19 | 9.94 | 0.15 | 0.36 | 0.70 | 0.75 | 0.88 |
| 38* | N1976 P2317 | 59 | F6: IV | 32 | 0.94 | 0.72 | 12.49 | 0.40 | 0.93 | 1.58 | 1.92 | 2.04 | |
| 39 | N1976 P2367 | 92 | 1.40 | 0.83 | 13.24 | 0.47 | 1.11 | 1.48 | 1.86 | 1.97 | |||
| 40* | N1976 P2424 | BD -05o1337 | 88 | A9-F0 IV | 14 | 0.33 | 0.26 | 10.74 | - | - | 0.58 | 0.67 | 0.74 |
| 41 | N1976 P2425 | 96 | B5 V | 34 | 0.67 | 0.71 | 10.67 | 0.66 | 1.23 | 2.05 | 2.33 | 2.48 | |
| 42 | N1976 P2476 | 95 | G0-G5 | 17 | 2.60 | 1.60 | 12.83 | 0.75 | - | 3.43 | 4.15 | 4.41 | |
| 43 | N1976 P2500 | 96 | A3 | 36 | 0.58 | 0.37 | 11.34 | 0.26 | 0.45 | 0.96 | 1.13 | 1.18 | |
| 44 | N1976 P2519 | BD -04o1193 | 95 | A0 | 36 | 0.89 | 0.69 | 11.27 | 0.40 | 0.90 | 1.52 | 1.75 | 1.82 |
| 45* | N2244 OI14 | 97 | G0 III | 37 | 1.47 | 1.05 | 12.80 | - | - | 2.01 | 2.44 | 2.61 | |
| 46* | N2244 OI20 | 98 | F9 V | 37 | 0.79 | 0.75 | 12.62 | - | - | 1.34 | 1.63 | 1.70 | |
| 47 | N2244 OI29 | 91 | 2.28 | 1.25 | 13.13 | - | - | 2.86 | 3.52 | 3.78 | |||
| 48 | N2244 OI44 | 95 | F6 V | 37 | 0.43 | 0.46 | 13.02 | - | - | 1.02 | 1.29 | 1.33 | |
| 49 | N2244 OI45 | HDE 258859 | 92 | A1 IV | 37 | 0.47 | 0.21 | 10.55 | - | - | 0.56 | 0.56 | 0.67 |
| 50 | N2244 OI46 | 62 | B9 V | 37 | 0.73 | 0.51 | 12.37 | - | - | 1.28 | 1.38 | 1.51 | |
| 51 | N2244 OI48 | 89 | F1 V | 37 | 0.65 | 0.48 | 12.53 | - | - | 1.07 | 1.22 | 1.29 | |
| 52 | N2244 OI62 | 53 | B2.5 II-III | 37 | 0.57 | 0.71 | 12.93 | - | 1.17 | 1.95 | 2.22 | 2.41 | |
| 53 | N2244 OI63 | 93 | F4 | 36 | 3.41 | 1.66 | 14.11 | - | 1.89 | 3.46 | 4.29 | 4.61 | |
| 54* | N2244 OI72 | 00 | 0.53 | 0.47 | 12.53 | - | 0.66 | 1.08 | 1.34 | 1.45 | |||
| 55 | N2244 OI78 | 50 | A7 V | 37 | 0.58 | 0.33 | 12.27 | - | - | 0.69 | 0.78 | 0.82 | |
| 56* | N2244 OI79 | 94 | B2 V | 10 | 0.39 | 0.16 | 10.70 | 0.21 | 0.35 | 0.43 | 0.48 | 0.49 | |
| 57* | N2244 OI80 | HDE 259012 | 97 | B0.5 V | 10 | 0.50 | 0.14 | 9.39 | 0.28 | 0.46 | 0.49 | 0.55 | 0.61 |
| 58* | N2244 OI84 | HD 46056 | 92 | O8 V(e) | 21 | 0.58 | 0.15 | 8.22 | 0.17 | 0.33 | 0.38 | 0.39 | 0.41 |
| 59* | N2244 OI91 | HDE 258986 | 62 | F4 V | 37 | 0.53 | 0.49 | 10.15 | - | - | 0.66 | 0.85 | 0.92 |
| 60 | N2244 OI102 | 74 | 1.23 | 0.84 | 13.49 | - | - | 2.00 | 2.41 | 2.54 | |||
| 61 | N2244 OI108 | 83 | B8 V | 37 | 0.06 | 0.22 | 11.42 | - | 0.33 | 0.60 | 0.66 | 0.67 | |
| 62 | N2244 OI109 | 82 | A0: | 36 | 0.77 | 0.49 | 13.80 | - | 0.69 | 1.22 | 1.36 | 1.50 | |
| 63 | N2244 OI110 | 58 | G7 III | 37 | 1.85 | 1.09 | 10.78 | - | 1.14 | 1.97 | 2.46 | 2.67 | |
| 64* | N2244 OI114 | HD 46149 | 95 | O8.5 V | 21 | 0.43 | 0.18 | 7.72 | 0.28 | 0.41 | 0.48 | 0.47 | 0.48 |
| 65* | N2244 OI115 | HD 46106 | 93 | B0 V | 15 | 0.67 | 0.08 | 8.03 | 0.22 | 0.33 | 0.42 | 0.44 | 0.42 |
| 66* | N2244 OI116 | 90 | B8 V | 37 | 0.20 | 0.32 | 12.79 | - | 0.49 | 0.88 | 0.99 | 1.09 | |
| 67* | N2244 OI122 | HD 46150 | 86 | O5 V((f)) | 19 | 0.70 | 0.16 | 6.74 | 0.13 | 0.24 | 0.29 | 0.27 | 0.32 |
| 68* | N2244 OI125 | 87 | B4 V | 37 | 0.07 | 0.27 | 12.01 | 0.45 | 1.17 | 0.75 | 0.85 | 0.97 | |
| 69* | N2244 OI127 | HD 46107 | 61 | A2 V | 9 | 0.17 | 0.08 | 8.76 | 0.20 | 0.24 | 0.24 | 0.22 | 0.30 |
| 70 | N2244 OI128 | HDE 259105 | 97 | B1.5 V | 15 | 0.54 | 0.14 | 9.39 | 0.15 | 0.29 | 0.39 | 0.40 | 0.45 |
Table 4. Continued.
| ID | Object | Others | p(%) | SpT | Ref. | (U-V) | (B-V) | V | (V-R) | (V-I) | (V-J) | (V-H) | (V-K) |
|---|---|---|---|---|---|---|---|---|---|---|---|---|---|
| 71 | N2244 OI130 | 94 | B2.5 V | 15 | 0.17 | 0.26 | 11.65 | - | 0.39 | 0.65 | 0.71 | 0.79 | |
| 72* | N2244 OI133 | 94 | B9 V | 37 | 0.48 | 0.40 | 11.73 | 0.85 | 1.50 | 1.06 | 1.20 | 1.35 | |
| 73 | N2244 OI167 | HDE 259172 | 97 | B3 V | 65 | 0.40 | 0.19 | 10.70 | 0.14 | 0.29 | 0.52 | 0.61 | 0.63 |
| 74 | N2244 OI172 | 95 | B2.5 V | 15 | 0.17 | 0.27 | 11.27 | 0.26 | 0.49 | 0.72 | 0.78 | 0.86 | |
| 75* | N2244 OI180 | HD 46202 | 93 | O9 V | 21 | 0.53 | 0.14 | 8.21 | 0.17 | 0.32 | 0.43 | 0.43 | 0.50 |
| 76 | N2244 OI190 | 98 | B2.5 Vn | 15 | 0.20 | 0.24 | 11.25 | 0.19 | 0.37 | 0.60 | 0.67 | 0.72 | |
| 77 | N2244 OI192 | 87 | B7 V | 37 | 0.31 | 0.45 | 12.55 | - | 0.49 | 1.15 | 1.32 | 1.49 | |
| 78* | N2244 OI194 | 95 | B6 Vne | 15 | 0.03 | 0.31 | 12.02 | 0.30 | 0.56 | 0.87 | 1.02 | 1.08 | |
| 79* | N2244 OI197 | 87 | B8 IV | 37 | 0.17 | 0.33 | 12.64 | - | 0.48 | 0.93 | 1.12 | 1.21 | |
| 80* | N2244 OI200 | HDE 259135 | 98 | B0.5 V | 15 | 0.56 | 0.14 | 8.54 | 0.12 | 0.27 | 0.39 | 0.41 | 0.43 |
| 81* | N2244 OI203 | HD 46223 | 96 | O4 V((f)) | 19 | 0.59 | 0.21 | 7.24 | 0.16 | 0.35 | 0.50 | 0.54 | 0.58 |
| 82* | N2244 OI253 | HDE 259300 | 96 | B3 Vp | 15 | 0.01 | 0.30 | 10.78 | 0.19 | 0.46 | 0.91 | 1.13 | 1.47 |
| 83 | N2244 OI256 | 92 | B6 V | 37 | 0.23 | 0.41 | 12.82 | - | 0.60 | 1.07 | 1.19 | 1.27 | |
| 84 | N2244 OI376 | HDE 258691 | 81 | O9.5 V | 37 | 0.07 | 0.54 | 9.71 | 0.36 | 0.78 | 1.49 | 1.69 | 1.80 |
| 85 | N2244 OI377 | 94 | F3 V | 37 | 0.99 | 0.62 | 12.28 | - | - | 1.25 | 1.45 | 1.57 | |
| 86* | N2244 OI393 | HDE 259635 | 99 | G1 V | 37 | 1.02 | 0.79 | 9.74 | - | - | 1.46 | 1.81 | 1.93 |
| 87* | N2244 OI397 | HDE 259696 | 97 | K3 Ib | 37 | 4.58 | 2.19 | 8.85 | - | - | 3.74 | 5.02 | 5.35 |
| 88* | N2264 VAS1 | 95 | F4 V | 30 | 0.85 | 0.62 | 12.58 | 0.35 | 0.71 | 1.19 | 1.47 | 1.58 | |
| 89 | N2264 VAS2 | 98 | F7 V | 30 | 0.88 | 0.74 | 13.33 | 0.49 | 0.91 | 1.52 | 1.93 | 2.04 | |
| 90* | N2264 VAS10 | 98 | K1 V | 30 | 5.27 | 2.52 | 11.67 | 1.20 | 2.80 | 4.72 | 5.76 | 6.20 | |
| 91 | N2264 VAS11 | 84 | 0.68 | 0.63 | 14.22 | 0.47 | 0.70 | 1.18 | 1.47 | 1.58 | |||
| 92 | N2264 VAS22 | 96 | F5 V | 30 | 1.07 | 0.78 | 13.22 | 0.44 | 0.94 | 1.51 | 1.97 | 2.24 | |
| 93* | N2264 VAS32 | 94 | 2.77 | 1.59 | 13.94 | 0.93 | - | 3.44 | 4.14 | 4.42 | |||
| 94 | N2264 VAS46 | V780 Mon | 96 | A0 V | 30 | 0.83 | 0.71 | 12.34 | 0.58 | 1.43 | 2.69 | 3.34 | 3.79 |
| 95* | N2264 VAS47 | 93 | B2 V | 5 | 0.19 | 0.62 | 10.83 | 0.45 | 1.20 | 2.42 | 2.99 | 3.37 | |
| 96 | N2264 VAS48 | 93 | G0 IV-V | 5 | 0.77 | 0.62 | 11.71 | 0.30 | 0.74 | 1.18 | 1.49 | 1.59 | |
| 97* | N2264 VAS62 | HRC 219 | 92 | B4 V | 30 | 0.22 | 0.14 | 12.76 | 0.35 | 0.84 | 1.32 | 2.31 | 3.50 |
| 98* | N2264 VAS72 | HD 261841 | 94 | A2 IV | 5 | 0.23 | 0.14 | 10.04 | 0.10 | 0.28 | 0.52 | 0.91 | 1.60 |
| 99 | N2264 VAS86 | 92 | F8 V | 30 | 1.05 | 0.86 | 12.47 | 0.42 | 0.90 | 1.69 | 2.16 | 2.29 | |
| 100* | N2264 VAS92 | 96 | G5 V | 30 | 1.35 | 0.94 | 12.30 | 0.35 | 0.86 | 1.65 | 2.24 | 2.64 | |
| 101* | N2264 VAS122 | V360 Mon | 96 | G8 V | 30 | 1.33 | 0.95 | 13.39 | 0.49 | 0.96 | 1.75 | 2.38 | 2.88 |
| 102* | N2264 VAS188 | 65 | F5 V | 30 | 0.83 | 0.66 | 11.53 | 0.27 | 0.61 | 1.08 | 1.42 | 1.49 | |
| 103* | N2264 VAS192 | 86 | 3.53 | 1.95 | 14.43 | 1.14 | 2.30 | 4.03 | 4.82 | 5.20 | |||
| 104 | N2264 VAS227 | 86 | 1.09 | 0.61 | 15.04 | 0.18 | - | 1.36 | 1.56 | 1.69 | |||
| 105* | N2264 VAS228 | 67 | 2.92 | 1.67 | 13.53 | 0.70 | - | 3.11 | 3.83 | 4.09 | |||
| 106* | N2264 VAS238 | 93 | K5 V | 30 | 2.12 | 1.01 | 11.21 | 0.37 | 0.82 | 1.56 | 2.02 | 2.16 | |
| 107 | N6530 W2 | HD 164536 | 00 | O7 | 23 | 0.95 | -0.03 | 7.11 | - | - | -0.01 | -0.04 | -0.01 |
| 108 | N6530 W3 | CD -24o13785 | 72 | B0.5 | 40 | 0.76 | 0.01 | 8.68 | 0.04 | 0.09 | 0.13 | 0.04 | 0.09 |
| 109 | N6530 W5 | HD 314900 | 02 | B5 | 2 | 0.37 | 0.13 | 10.42 | - | - | 0.47 | 0.63 | 0.84 |
| 110 | N6530 W7 | HD 164794 | 08 | O4 V((f)) | 19 | 0.88 | 0.03 | 5.97 | 0.13 | 0.19 | 0.22 | 0.22 | 0.25 |
| 111* | N6530 W9 | HD 164816 | O9.5 IVn | 28 | 0.89 | 0.00 | 7.07 | - | 0.08 | 0.06 | 0.02 | 0.01 | |
| 112 | N6530 W15 | 57 | B7 | 6 | 0.20 | 0.17 | 11.60 | - | 0.31 | 0.57 | 0.66 | 0.68 | |
| 113 | N6530 W19 | HD 315025 | 00 | B8 | 2 | 0.23 | 0.25 | 10.78 | - | 0.50 | 0.94 | 1.21 | 1.35 |
| 114* | N6530 W27 | 79 | F0: | 40 | 0.90 | 0.66 | 12.95 | 0.58 | 1.20 | 1.54 | 1.82 | 1.94 | |
| 115 | N6530 W29 | 20 | F5-G0 | 11 | 0.93 | 0.81 | 13.19 | 0.53 | 1.23 | 2.58 | 3.36 | 3.77 | |
| 116 | N6530 W32 | 84 | B3 Ve | 12 | 0.48 | 0.11 | 10.51 | 0.19 | 0.34 | 0.48 | 0.56 | 0.63 | |
| 117 | N6530 W35 | CD -24o13822 | 76 | K0 III | 12 | 1.94 | 1.14 | 9.84 | - | 1.22 | 2.17 | 2.66 | 2.87 |
| 118* | N6530 W42 | HD 315032 | 84 | B2 Vne | 12 | 0.71 | 0.04 | 9.18 | 0.08 | 0.14 | 0.18 | 0.17 | 0.22 |
| 119* | N6530 W43 | HD 315026 | B2 | 40 | 0.64 | 0.09 | 9.02 | - | 0.05 | 0.23 | 0.09 | 0.16 | |
| 120* | N6530 W46 | 60 | B8e: | 40 | 0.03 | 0.19 | 11.63 | - | 0.49 | 0.95 | 1.18 | 1.33 | |
| 121* | N6530 W56 | CD -24o13829 | 86 | B1.5 Vne | 12 | 0.61 | 0.10 | 9.03 | 0.06 | 0.20 | 0.39 | 0.42 | 0.50 |
| 122* | N6530 W58 | CD -24o13830 | 81 | B2 Ve | 12 | 0.47 | 0.18 | 9.86 | 0.14 | 0.39 | 0.77 | 1.00 | 1.32 |
| 123* | N6530 W59 | HD 315033 | 75 | B2 Vp | 12 | 0.56 | 0.09 | 8.93 | 0.05 | 0.19 | 0.51 | 0.56 | 0.67 |
| 124* | N6530 W60 | 81 | B1 Ve | 12 | 0.59 | 0.07 | 9.66 | 0.07 | 0.20 | 0.34 | 0.41 | 0.46 | |
| 125 | N6530 W61 | 25 | B2 Ve | 12 | 0.49 | 0.12 | 10.29 | - | 0.24 | 0.42 | 0.46 | 0.48 | |
| 126 | N6530 W65 | HD 164906 | 01 | B0 IVpne | 12 | 0.60 | 0.16 | 7.42 | 0.20 | 0.46 | 0.77 | 0.94 | 1.28 |
| 127* | N6530 W66 | CD -24o13831 | 79 | B2 Vpe | 12 | 0.54 | 0.11 | 10.14 | 0.06 | 0.21 | 0.35 | 0.41 | 0.45 |
| 128 | N6530 W70 | 83 | B2 Ve | 12 | 0.46 | 0.15 | 10.45 | 0.04 | 0.18 | 0.48 | 0.54 | 0.62 | |
| 129* | N6530 W73 | HD 315031 | 48 | B2 IVn | 12 | 0.62 | 0.08 | 8.24 | - | - | 0.31 | 0.27 | 0.35 |
| 130 | N6530 W74 | 86 | B2.5 Ve | 12 | 0.46 | 0.10 | 10.69 | - | 0.27 | 0.43 | 0.53 | 0.58 | |
| 131 | N6530 W76 | HD 315024 | 85 | B2.5 Ve | 12 | 0.72 | 0.06 | 9.56 | 0.11 | 0.18 | 0.31 | 0.32 | 0.39 |
| 132* | N6530 W80 | CD -24o13837 | B1 Ve | 12 | 0.71 | 0.07 | 9.40 | - | 0.23 | 0.35 | 0.38 | 0.42 | |
| 133* | N6530 W83 | 75 | B2.5 Vne | 12 | 0.48 | 0.13 | 10.49 | 0.12 | 0.24 | 0.44 | 0.66 | 0.64 | |
| 134 | N6530 W85 | HD 164933 | 00 | B0.5 V | 28 | 0.66 | 0.13 | 8.55 | - | - | 0.38 | 0.39 | 0.43 |
| 135* | N6530 W86 | CD -24o13840 | 77 | B2 Vne | 12 | 0.42 | 0.16 | 9.75 | -0.04 | 0.12 | 0.33 | 0.42 | 0.55 |
| 136* | N6530 W93 | HD 315021 | 84 | B2 IVn | 12 | 0.77 | 0.02 | 8.63 | 0.13 | 0.21 | 0.13 | 0.32 | 0.42 |
| 137 | N6530 W99 | CD -24o13844 | 50 | B2.5 Vne | 12 | 0.43 | 0.09 | 10.81 | - | 0.28 | 0.44 | 0.47 | 0.55 |
| 138* | N6530 W100 | HD 164947 | B2 IVe | 12 | - | 0.09 | 9.48 | - | - | 0.19 | 0.22 | 0.26 | |
| 139 | N6530 W105 | HD 315022 | 56 | B6 | 40 | 0.31 | 0.17 | 10.54 | - | 0.32 | 0.51 | 0.53 | 0.58 |
| 140 | N6530 W110 | 70 | B3 V | 33 | 0.33 | 0.16 | 11.22 | 0.17 | 0.31 | 0.59 | 0.64 | 0.70 | |
| 141* | N6530 W117 | HD 315035 | 71 | B2.5 Ve | 12 | 0.20 | 0.25 | 10.81 | 0.20 | 0.43 | 0.80 | 0.99 | 1.08 |
| 142* | N6530 W118 | HD 165052 | 39 | O6.5 V | 19 | 0.76 | 0.09 | 6.87 | 0.11 | 0.21 | 0.39 | 0.40 | 0.41 |
| 143 | N6530 VA92 | 85 | K5: | 40 | 2.34 | 1.28 | 12.05 | - | 1.26 | 2.28 | 2.84 | 3.01 | |
| 144 | N6530 VA94 | 80 | B6 | 40 | 0.02 | 0.24 | 11.86 | - | 0.48 | 0.97 | 1.15 | 1.28 | |
| 145* | N6530 VA97 | 45 | K2e: | 40 | 2.03 | 1.24 | 10.94 | - | 1.29 | 2.28 | 2.76 | 2.96 |
Table 4. Continued.
| ID | Object | Others | p(%) | SpT | Ref. | (U-V) | (B-V) | V | (V-R) | (V-I) | (V-J) | (V-H) | (V-K) |
|---|---|---|---|---|---|---|---|---|---|---|---|---|---|
| 146* | N6530 VA107 | 86 | B2e | 40 | 0.38 | 0.16 | 10.01 | 0.15 | 0.27 | 0.77 | 0.88 | 0.99 | |
| 147 | N6530 VA247 | 81 | B3 | 40 | 0.12 | 0.28 | 11.51 | - | - | 0.74 | 0.91 | 1.01 | |
| 148 | N6530 VA259 | CD -24o13858 | 84 | B8 | 40 | 0.17 | 0.41 | 11.61 | - | - | 1.24 | 1.46 | 1.59 |
| 149* | N6530 VA304 | 73 | K5: | 40 | 4.49 | 2.32 | 9.89 | - | - | 4.87 | 6.17 | 6.67 | |
| 150* | N6530 VA330 | 45 | B6+? | 40 | 1.00 | 0.86 | 10.82 | 0.67 | 1.27 | 2.30 | 2.59 | 2.79 | |
| 151* | N6530 VA338 | 69 | K5: | 40 | 4.89 | 2.45 | 10.27 | - | - | 4.98 | 6.26 | 6.63 | |
| 152* | N6611 W125 | BD | 94 | B1 V | 38 | 0.09 | 0.47 | 10.05 | 0.33 | 0.73 | 1.23 | 1.36 | 1.47 |
| 153* | N6611 W150 | BD | 93 | B0.5 V | 38 | 0.03 | 0.47 | 9.89 | 0.36 | 0.76 | 1.29 | 1.47 | 1.54 |
| 154 | N6611 W161 | 94 | O8.5 V | 38 | 0.84 | 1.02 | 11.21 | 0.74 | 1.63 | 3.05 | 3.48 | 3.79 | |
| 155* | N6611 W175 | BD | 94 | 05.5 V((f)) | 41 | 0.41 | 0.80 | 10.02 | 0.60 | 1.34 | 2.43 | 2.80 | 3.04 |
| 156* | N6611 W197 | BD | 94 | O6-7 V((f)) | 41 | 0.24 | 0.44 | 8.77 | 0.35 | 0.74 | 1.24 | 1.34 | 1.50 |
| 157* | N6611 W205 | BD | 94 | O4 V((f+)) | 41 | 0.25 | 0.45 | 8.21 | 0.39 | 0.84 | 1.32 | 1.52 | 1.66 |
| 158* | N6611 W223 | 69 | B1 V | 38 | 0.22 | 0.65 | 11.19 | 0.45 | 1.02 | 1.65 | 1.88 | 2.02 | |
| 159* | N6611 W227 | 92 | B1.5 Ve | 38 | 0.48 | 0.69 | 12.87 | 0.42 | 0.93 | 1.82 | 2.14 | 2.30 | |
| 160* | N6611 W235 | 94 | Herbig Be | 38 | 0.36 | 0.83 | 11.00 | 0.62 | 1.38 | 2.44 | 2.88 | 3.32 | |
| 161* | N6611 W246 | BD | 94 | O7 IIb(f) | 41 | 0.52 | 0.87 | 9.55 | 0.63 | 1.31 | 2.33 | 2.69 | 2.87 |
| 162* | N6611 W254 | 94 | B1 V | 38 | 0.03 | 0.44 | 10.80 | 0.29 | 0.69 | 1.24 | 1.43 | 1.54 | |
| 163* | N6611 W259 | 94 | B0.5 V | 38 | 0.41 | 0.73 | 11.61 | 0.54 | 1.17 | 2.00 | 2.30 | 2.44 | |
| 164* | N6611 W280 | BD | 94 | O9.5 V | 41 | 0.17 | 0.49 | 10.05 | 0.29 | 0.68 | 1.09 | 1.18 | 1.31 |
| 165* | N6611 W301 | 94 | B2 V | 38 | 0.28 | 0.53 | 12.27 | 0.57 | 1.05 | 1.64 | 1.87 | 1.99 | |
| 166* | N6611 W306 | 89 | B1.5 Ve | 38 | 0.40 | 0.63 | 12.72 | 0.48 | 1.06 | 1.86 | 2.13 | 2.20 | |
| 167* | N6611 W314 | BD | 92 | B0 V | 38 | 0.08 | 0.62 | 9.92 | 0.45 | 0.96 | 1.67 | 1.84 | 2.00 |
| 168* | N6611 W343 | 93 | B1 V | 38 | 0.62 | 0.82 | 11.83 | 0.70 | 1.40 | 2.35 | 2.71 | 2.96 | |
| 169* | N6611 W367 | BD | 92 | O9.5 V | 41 | 0.52 | 0.28 | 9.43 | 0.19 | 0.38 | 0.64 | 0.66 | 0.69 |
| 170* | N6611 W401 | BD | O8.5 V | 41 | 0.34 | 0.40 | 8.96 | 0.32 | 0.66 | 1.13 | 1.28 | 1.39 | |
| 171* | N6611 W412 | BD | 93 | O9.5 I | 41 | 0.40 | 0.34 | 8.26 | 0.25 | 0.52 | 0.73 | 0.81 | 0.89 |
| 172* | N6611 W468 | BD | 93 | B1 Vp | 38 | 0.42 | 0.29 | 9.44 | 0.17 | 0.42 | 0.73 | 0.79 | 0.84 |
| 173* | N6611 W469 | BD | 94 | B0.5 Ve | 38 | 0.19 | 0.42 | 10.71 | 0.30 | 0.66 | 1.13 | 1.26 | 1.42 |
| 174* | N6611 W483 | BD | 93 | Be | 27 | 0.20 | 0.43 | 10.96 | 0.29 | 0.62 | 1.09 | 1.20 | 1.37 |
| 175* | N6611 W503 | BD | 94 | Herbig Be | 38 | 0.30 | 0.32 | 10.35 | 0.96 | 1.45 | 1.62 | 1.92 | 2.27 |
| 176* | N6611 K556 | BD | 93 | B2.5 I | 38 | 1.27 | 1.15 | 9.91 | 0.72 | 1.58 | 2.96 | 3.38 | 3.68 |
| 177* | N6611 K576 | 72 | G5 | 7 | 2.45 | 1.31 | 10.21 | - | - | 2.63 | 3.20 | 3.43 | |
| 178 | N6611 K599 | 90 | Late G | 41 | 2.43 | 1.28 | 10.13 | 0.70 | 1.39 | 2.52 | 3.11 | 3.38 | |
| 179 | N6611 K601 | BD | 93 | B1.5 V | 38 | 0.14 | 0.37 | 10.66 | 0.28 | 0.62 | 0.96 | 1.14 | 1.28 |
| 180* | N6611 | BD | 94 | B0 | 7 | - | 0.38 | 10.26 | - | - | 1.15 | 1.20 | 1.35 |
| 181 | N6611 | BD | 94 | B9 V | 35 | - | 0.34 | 9.61 | - | - | 0.94 | 1.03 | 1.11 |
| 182 | N6611 | BD | 66 | A0 III | 35 | - | 0.38 | 10.17 | - | - | 1.18 | 1.29 | 1.45 |
| 183 | N6611 | BD | 86 | B9.5 III/IV | 35 | - | 0.16 | 9.78 | - | - | 0.64 | 0.69 | 0.77 |
| 184 | N6611 | BD | 69 | B9 III/IV | 35 | - | 0.10 | 10.40 | - | - | 0.78 | 0.90 | 1.01 |
| 185 | N6611 | BD | 61 | G3 | 7 | - | 1.24 | 10.06 | - | - | 2.25 | 2.77 | 2.98 |
| 186 | N6611 | BD | 85 | A0 IV | 35 | - | 0.17 | 10.13 | - | - | 0.77 | 0.88 | 0.97 |
| 187 | N6611 | BD | 75 | B1/2(n) | 35 | - | 0.34 | 9.41 | - | - | 1.00 | 1.13 | 1.17 |
| 188* | N6823 E4 | 91 | B0 IVe | 31 | 0.55 | 0.82 | 10.28 | - | - | 1.70 | 1.88 | 2.00 | |
| 189 | N6823 E5 | 97 | B2 V | 42 | 0.47 | 0.72 | 12.67 | - | - | 1.69 | 1.87 | 1.96 | |
| 190* | N6823 E8 | HD 344777 | 98 | O9.5 III | 31 | 0.33 | 0.78 | 9.48 | - | - | 1.71 | 1.88 | 1.95 |
| 191 | N6823 E18 | 98 | B2 V | 42 | 0.55 | 0.75 | 11.99 | - | - | 1.66 | 1.84 | 1.97 | |
| 192* | N6823 E24 | 94 | B1.5 V | 39 | 0.28 | 0.70 | 11.85 | - | - | 1.39 | 1.58 | 1.66 | |
| 193 | N6823 E30 | 85 | B1.5 V | 42 | 0.51 | 0.70 | 12.61 | - | - | 1.40 | 1.60 | 1.72 | |
| 194* | N6823 E36 | 97 | G8 III | 42 | 3.08 | 1.70 | 12.50 | - | - | 3.03 | 3.63 | 3.90 | |
| 195* | N6823 E46 | HD 344776 | 88 | B0.5 Ib | 3 | 0.68 | 0.86 | 8.90 | 0.56 | 0.97 | 1.68 | 1.85 | 1.92 |
| 196 | N6823 E50 | 96 | B4 V | 42 | 0.32 | 0.59 | 12.94 | - | - | 1.54 | 1.78 | 1.90 | |
| 197* | N6823 E68 | HD 344783 | 95 | B0 IV | 4 | 0.16 | 0.44 | 9.79 | - | - | 1.01 | 1.08 | 1.15 |
| 198* | N6823 E77 | HD 344775 | 97 | B1 III | 4 | 0.64 | 0.81 | 10.53 | - | - | 1.52 | 1.64 | 1.75 |
| 199* | N6823 E78 | 93 | K8 V | 31 | 3.95 | 1.97 | 10.45 | - | - | 3.51 | 4.32 | 4.67 | |
| 200 | N6823 E80 | 96 | B2.5 V | 42 | 0.36 | 0.66 | 12.38 | - | - | 1.37 | 1.57 | 1.73 | |
| 201* | N6823 E81 | 98 | B1.5 V | 31 | 0.02 | 0.57 | 11.07 | - | - | 1.38 | 1.48 | 1.61 | |
| 202* | N6823 E83 | HD 344784 | 97 | O7 V((f)) | 20 | 0.03 | 0.56 | 9.39 | 0.40 | 0.82 | 1.36 | 1.50 | 1.56 |
| 203* | N6823 E84 | 97 | B0.5 V | 13 | 0.44 | 0.76 | 11.60 | 0.51 | 1.05 | 1.80 | 1.99 | 2.11 | |
| 204* | N6823 E86 | 96 | O9 V | 31 | 0.35 | 0.74 | 11.89 | 0.50 | 1.04 | 1.67 | 2.00 | 2.16 | |
| 205* | N6823 E88 | 97 | B0 V:pe | 31 | 0.40 | 0.73 | 11.83 | - | - | 1.81 | 2.02 | 2.16 | |
| 206 | N6823 E92 | 51 | F8 V | 42 | 0.80 | 0.75 | 12.65 | - | - | 1.46 | 1.77 | 1.87 | |
| 207* | N6823 E93 | 93 | O9.5 V | 31 | 0.54 | 0.80 | 12.72 | - | - | 2.03 | 2.27 | 2.43 | |
| 208 | N6823 E96 | 55 | F2 IV | 42 | 0.44 | 0.48 | 11.98 | - | - | 1.00 | 1.20 | 1.27 | |
| 209* | N6823 E103 | HD 344789 | 95 | G8 III | 42 | 2.21 | 1.38 | 12.95 | 0.81 | 1.52 | 2.61 | 3.21 | 3.39 |
| 210* | N6823 E104 | 98 | B0.5 V | 31 | 0.65 | 0.87 | 11.74 | - | - | 2.05 | 2.29 | 2.44 | |
| 211* | N6823 E110 | HD 344787 | 79 | F8 Ib | 31 | 1.84 | 1.19 | 9.25 | - | - | 2.23 | 2.66 | 2.84 |
References to SpT
1 - Greenstein & Struve (1946), 2 - Cannon & Mayall (1949), 3 - Morgan et al. (1955), 4 - Hiltner (1956),
5 - Walker (1956), 6 - Walker (1957), 7 - Pronik (1958), 8 - Strand (1958), 9 - Hoag & Smith (1959), 10 - Johnson (1962),
11 - Johnson & Borgman (1963), 12 - Hiltner et al. (1965), 13 - Hoag & Applenquist (1965), 14 - Johnson (1965),
15 - Morgan et al. (1965), 16 - Guetter (1968), 17 - Walker (1969), 18 - Smith (1972), 19 - Walborn (1972),
20 - Walborn (1973), 21 - Conti & Leep (1974), 22 - Breger & Rybski (1975), 23 - Houk et al. (1975),
24 - Penston et al. (1975), 25 - Levato & Abt (1976) 26 - McNamara (1976), 27 - Schild & Romanishin (1976),
28 - Abt & Levato (1977), 29 - Garrison et al. (1977), 30 - Young (1978), 31 - Turner (1979), 32 - Walker (1983),
33 - Buscombe (1984), 34 - van Altena et al. (1988), 35 - Houck & Smith-Moore (1988),
36 - Egret et al. 1991 (SIMBAD database), 37 - Verschueren (1991), 38 - Hillenbrand et al. (1993),
39 - Massey et al. (1995), 40 - van den Ancker et al. (1997), 41 - Bosch et al.(1999), 42 - Shi & Hu (1999)
Notes to Table 4
1. Suspected variable (Walker 1969); B2 (Breger & Rybski 1975).
3. Vr = +25 km/s (McNamara 1976).
4. Vr = +23 km/s based on metallic absorptions, Hγ+Hδ Vr = 140 km/s, these may be affected by nebular emission (Walker 1983).
5. Variable (Kholopov et al. 1998); Vr = 13 km/s, CaII HK in emission only, large rotational broadening Vsini = 60 20 km/s, suspected velocity variable (Walker 1983); Vr = 51 km/s (Abt 1970); NIR variable (Carpenter 2001).
6. Non-member, = 0.0 (Tian et al. 1996); NIR variable (Carpenter 2001).
8. CaII K as in A0.5 (Levato & Abt 1976).
10. Vr = +68 km/s based on Hγ plus metallic absorptions (Walker 1983).
13. LP Ori; variable (Kholopov et al. 1998); B1.5Vp (Sharpless 1952); polarized source (Breger 1976); youngest Vega-like star (Manoj et al. 2002).
15. Variable (Kholopov et al. 1998); absorption spectrum veiled by a stellar blue continuum, line depths are 0.66 times the normal value, strong nebular lines and continuous emission (Walker 1983); G5: (Breger & Rybski 1975).
16. LZ Ori; variable (Kholopov et al. 1998); forms a double with 1881 (Jeffers et al. 1963).
17. (D) Ori = ADS 4186 B = MB Ori; variable (Kholopov et al. 1998).
18. (C) Ori = ADS 4186 A; broad HI lines probably due to high surface gravity (Levato & Abt 1976).
20. Variable (Kholopov et al. 1998); strong nebular spectrum, broad H wings and K line visible (Greenstein & Struve 1946).
21. (B) Ori = ADS 4186 D; broad HI lines probably due to high surface gravity (Levato & Abt 1976); B0.5 Vp (Borgman 1960).
22. (A) Ori = ADS 4186 C; O6 (Johnson & Hiltner 1956); O6pe (Lesh 1968).
23. Vr = +17 km/s (McNamara 1976).
24. Variable (Kholopov et al. 1998); shell, the fairly narrow shell lines are due to FeI and MgII 4481 Å but they may represent a second star (Levato & Abt 1976); B0 Vp (Johnson 1965); B8 (Walker 1969); B8 IV or V (Greenstein & Stuve 1946).
25. Ori = ADS 4188 A.
26. Variable (Kholopov et al. 1998); two spectral types from two different sources (Strand 1958).
27. Variable, K0:e (Kholopov et al. 1998); PMS object, emission line star, HBC 141 (Herbig & Bell 1988); NIR variable (Carpenter 2001).
28. Variable (Kholopov et al. 1998).
29. NIR variable (Carpenter 2001).
30. NU Ori; Variable (Kholopov et al. 1998); broad HI lines probably due to high surface gravity (Levato & Abt 1976); polarized source (Breger 1976).
32. Variable (Kholopov et al. 1998); CaII HK in emission only, Vr = +31 km/s based on metallic absorptions, Hγ+Hδ Vr = +218 30 km/s, this measure may be affected by faint nebular emission visible at Hγ, Hδ, Hβ. CaII HK emission Vr = +94 km/s, suspected velocity variable (Walker 1983); Vr = 31 km/s (Wilson 1953); K6 (Cohen & Kuhi 1979); K0e (Herbig & Rao 1972).
33. Variable (Kholopov et al. 1998); Vr = +82 km/s from metallic absorptions, HI and CaII HK in emission, strong LiI 6707 Å absorption feature, CaII K emission Vr = +1 km/s, nebular continuum contamination, absorption lines veiled by stellar blue continuum, line depths are 0.49 normal, Hα emission Vr = +17 km/s (Walker 1983).
34. Vr = 58 km/s based on metallic absorptions, Hγ absorption Vr = 154 km/s, measurement affected by nebular emission, CaII HK emission only, CaII HK emission Vr = +36 km/s (Walker 1983).
35. Variable (Kholopov et al. 1998); Vr = +73 km/s (Johnson 1965); 9.9 to 12.2 mag. variability, the absorption velocities from different elements differ significantly (Greenstein & Struve 1946, Herbig 1960); possible spectroscopic binary, strong H lines with sharp cores, strong broad K line of type A3, CaI 4227 Å as strong as HeI 4472 Å indicating a late B-type or a binary influence or disturbance of nebular material (Greenstein & Struve 1946); A3e (Herbig 1960); Herbig Ae/Be, SB (Leinert et al. 1997, Maheswar et al. 2002).
38. Suspected variable (Walker 1969); Vr = 36 km/s, member, F4 to F8 (Walker 1983).
40. Vr = +19 km/s, broad Balmer lines suspected (Johnson 1965).
45. (Sabogal-Martínez et al. 2001).
46. (Sabogal-Martínez et al. 2001).
54. In observing log it is OI74 (an emission line B type star) but in our spectrum it is actually a F6 type star with no emission and hence we assumed that we observed OI72 instead of OI74; (Sabogal-Martínez et al. 2001).
56. Member according to photometry indicators and radial velocity +34 2.5 km/s (Riddle 1972).
57. Magnitude variable (Johnson 1962); binary system (Pérez 1988); X-ray source (Park & Sung 2002).
58. 08 Vn (Walborn 1973); X-ray emitter (Berghöfer & Christian 2002); Hα emitter (Conti 1974); strong Hydrogen absorption lines, variable radial velocity (Humphreys 1978).
59. (Sabogal-Martínez et al. 2001).
64. X-ray emitter (Berghöfer & Christian 2002, Park & Sung 2002); probable spectroscopic binary (Millward & Walker 1985).
65. X-ray emitter (Berghöfer & Christian 2002, Park & Sung 2002); variable radial velocity (Humphreys 1978); spectroscopic binary (Millward & Walker 1985).
66. Chemical peculiarity near 5200 Å flux (Hensberge et al. 1998).
67. Weak NIII 4634-4640-4642 emission (Walborn 1972); magnitude variable (Johnson 1962); PMS object (Ogura & Ishida 1981); X-ray emitter (Berghöfer & Christian 2002).
68. X-ray emitter (Berghöfer & Christian 2002, Park & Sung 2002).
69. Polarisation 0.2 (Hoag & Smith 1959); X-ray emitter (Berghöfer & Christian 2002); (Sabogal-Martínez et al. 2001).
72. X-ray emitter (Berghöfer & Christian 2002).
75. X-ray emitter (Park & Sung 2002).
78. X-ray emitter (Berghöfer & Christian 2002); B4Vne (Pérez 1988); foreground star (Guseva 1985).
79. Member (Guseva 1985).
80. V578 Mon; eclipsing variable (Kholopov et al. 1998); two line spectroscopic binary (Morgan et al. 1965); X-ray variable probably due to binarity (Bergh”ofer & Christian 2002); eclipsing binary with two early type B stars, 2.4 days orbit (Hensberge et al. 2000).
81. NIII multiplet 4634-4640-4642Å in weak emission (Walborn 1972); X-ray emitter (Berghöfer & Christian 2002).
82. Hydrogen lines very strong, may be an exception to the relation between line intensity and luminosity (Morgan et al. 1965); X-ray emitter (Berghöfer & Christian 2002).
86. (Sabogal-Martínez et al. 2001).
87. (Sabogal-Martínez et al. 2001).
88. Hα emission (Young 1978).
90. Probable field and variable star (Sagar & Joshi 1983); either a carbon or a background star (Mendoza & Gömez 1980); non-member on the basis of radial velocity Vr = +70 km/s (Zappala 1972); dM foreground star (Walker 1956).
93. Probable field star (Sagar & Joshi 1983).
95. Broad interstellar NaI 5890-5896 (Pérez 1988); probably a member star, highly reddened (Walker 1956); strong interstellar circular polarization (McMillan 1977); probable field star (Sagar & Joshi 1983).
97. LkHα 25; classified as Herbig Ae/Be by Herbig (1960); suspected X-ray source (Simon et al. 1985); abnormal extinction due to an edge-on circumstellar disk (Rydgren & Vrba 1987); B8pe, shell, hot member (Herbig & Rao 1972); Hα emission (Herbig 1954, Young 1978); variable star (Warner et al. 1956); edge-on circumstellar disk (Park et al. 2002).
98. Hα emission (Young 1978); variable star (Warner et al. 1977); variable radial velocity, spectroscopic binary (Mendoza & Gömez 1980); PMS star (Sung et al. 1997); variable radial velocity (Walker 1956).
100. Variable star (Sagar & Joshi 1983); Hα in filled emission (Pérez 1988); LiI 6707 Å present (Zappala 1972).
101. LkHα 53; Hβ shows a weak emission, no Hα detected by Marcy (1980); SpT. K2 (Rydgren 1979); T Tauri star (Herbig & Rao 1972); Hα emission (Herbig 1954, Young 1978); variable star (Walker 1956).
102. Variable star (Warner et al. 1977).
103. Probable field star (Sagar & Joshi 1983).
105. Probable field star (Sagar & Joshi 1983).
106. Hα emission (Young 1978); probable field star (Sagar & Joshi 1983); no emission (Pérez 1988); non-member on the basis of its radial velocity Vr = +73 km/s (Zappala 1972).
111. B0 V (Boggs & Böhm-Vitense 1989).
114. F0-G5 (Johnson & Borgman 1963).
118. B1 V (Boggs & Böhm-Vitense 1989).
119. B1.5 V (Boggs & Böhm-Vitense 1989); triple system (Torres 1987).
120. A0 (Walker 1957).
121. B0.5 V, binary (Boggs & Böhm-Vitense 1989).
122. LkHα112; probable Herbig Ae/Be star, intermediate mass PMS star (Boesono et al. 1987).
123. B1 Vp (Torres 1987).
124. Radial velocity probably variable, perhaps double line in the spectrum (Walker 1957).
127. HeI star, strong He I absorption lines (Hiltner et al. 1965).
129. B1 V, binary system with a secondary of the same type as of primary (Boggs & Böhm-Vitense 1989).
132. B1 V (Boggs & Böhm-Vitense 1989); radial velocity variable, double line in the spectrum (Walker 1957).
133. LSS 4621.
135. B2.5 V (Boggs & Böhm-Vitense 1989); double line spectroscopic binary (Hiltner et al. 1965).
136. B1 V (Boggs & Böhm-Vitense 1989).
138. B2.5 V (Boggs & Böhm-Vitense 1989); a double system, the combined magnitude and color are given, the and of the brighter component are 9.48 and 0.09 respectively (Walker 1957).
141. B3 V (Boggs & Böhm-Vitense 1989).
142. Double-lined spectroscopic binary, consisting of two O6.5 V star with a period of 6.14 days (Morrison & Conti 1978).
145. K4 III (Buscombe 1984).
146. B2.5 V (Buscombe 1984).
149. Late type giant (Parthasarathy 1974)
150. Probable member and a close binary with a mid-B type and a cool star (van den Ancker et al. 1997)
151. Late type giant (Parthasarathy 1974); Variable star (Sagar & Joshi 1978).
152. B1.5 V (Hiltner & Morgan 1969).
153. Vsini = 86 km/s (Killian-Montenbruck et al. 1994); O9 V (Walker 1961); B0.5 V (Hiltner & Morgan 1969); intrinsic polarisation (Orsatti et al. 2000).
155. Long period spectroscopic binary (Bosch et al. 1999); Visual Binary (Duchêne et al. 2001); Intrinsic polarisation (Orsatti et al. 2000); O5.5 V((f)) (Hillenbrand et al. 1993).
156. Long period spectroscopic binary (Bosch et al. 1999); radial velocity variable (Walker 1961, Conti and Frost 1977); Vsini = 79 km/s (Penny 1996); polarimetric variable (Orsatti et al. 2000); O7 V((f)) (Hillenbrand et al. 1993); (Belikov et al. 1999); member (van Schewick 1962).
157. Blue straggler (Mermilliod 1995); large dispersion in radial velocity (Bosch et al. 1999); variable radial velocity (Conti & Frost 1977); Vsini = 109 km/s (Penny 1996); no Intrinsic polarisation (Orsatti et al. 2000); visual binary (Duchêne et al. 2001); O5 V((f*)) (Hillenbrand et al. 1993); (Belikov et al. 1999); member (van Schewick 1962).
158. No Intrinsic polarisation (Orsatti et al. 2000); visual binary (Duchêne et al. 2001); Be (Schild & Romanishin 1976); B1 V (Hiltner & Morgan 1969).
159. Visual binary (Duchêne et al. 2001).
160. Be: (Walker 1961); no intrinsic polarisation (Orsatti et al. 2000); group III Herbig Ae/Be (Hillenbrand et al 1993).
161. Vr=15 km/s (Bosch et al. 1999); Vr=6 km/s (Walker 1961); O7 Ib(f) (Walborn 1982); O7 IIb(f) (Hillenbrand et al. 1993); No intrinsic polarisation (Orsatti et al. 2000).
162. B1 V (Thé et al. 1990); Vr = 49 km/s (Brown et al. 1986); Vr = 3.8 km/s (Walker 1961); intrinsic polarisation (Orsatti et al. 2000); sharp lines (Hillenbrand et al. 1993); Vsini = 38 km/s (Killian-Montenbruck et al. 1994); visual binary (Duchêne et al. 2001).
163. Intrinsic polarisation (Orsatti et al. 2000).
164. O9.5 V (Hillenbrand et al. 1993); Vr = 13 km/s (Bosch et al. 1999); radial velocity variable (Walker 1961); broad lines (van Schewick 1962); fast emission rotation variable line star, no intrinsic polarisation (Orsatti et al. 2000).
165. (Tucholke et al. 1986); (Belikov et al. 1999); member (van Schewick 1962); Intrinsic polarisation (Orsatti et al. 2000).
166. Intrinsic polarisation (Orsatti et al. 2000); B3-4e: (de Winter et al 1997).
167. Probable binary or multiple systems, Vr = 19 km/s (Bosch et al. 1999); Vr = 1.7 km/s, double lines (Walker 1961); no intrinsic polarisation (Orsatti et al. 2000).
168. No intrinsic polarisation (Orsatti et al. 2000).
169. O9.5 V (Hiltner & Johnson 1956, Hiltner & Morgan 1969, Hillenbrand et al. 1993); probable binary or multiple systems, Vr = 4 km/s (Bosch et al. 1999); variable radial velocity (Walker 1961); Vsini = 29 km/s (Killian-Montenbruck et al. 1994).
170. O8.5 V (Hillenbrand et al. 1993); Vr =18 km/s (Bosch et al. 1999); Vr = 12.1 km/s (Walker 1961); intrinsic polarisation (Orsatti et al. 2000); (Belikov et al. 1999); member (van Schewick 1962).
171. O9.5 I (Hillenbrand et al. 1993); short period single lined spectroscopic binary (Bosch et al. 1999).
172. B0.5 V (Thé et al. 1990); Vr = 21 km/s (Brown et al. 1986).
173. B1.5 V (Hiltner & Morgan 1969).
174. Member (de Winter et al. 1997).
175. Suspected circumstellar shell, e-vector deviate significantly (Orsatti et al. 2000); group III Herbig Ae/Be (Hillenbrand et al 1993).
176. cB4 (Wilson 1953); (Tucholke et al. 1986); (Belikov et al. 1999); probable member (de Winter et al. 1997).
177. (Tucholke et al. 1986); (Belikov et al. 1999).
180. (Belikov et al. 1999).
188. B0.5 IV (Shi & Hu 1999); B1 III (Parthasarathy et al. 2000); probable post-AGB star with cold dust 127 K (Gauba et al. 2003).
190. O8 V (Shi & Hu 1999).
192. B1.5 V (Shi & Hu 1999).
194. probable variable, anomalous position in the HR diagram (Sagar & Joshi 1981).
195. B0.5 Ib (Shi & Hu 1999, Massey et al. 1995); = +0.17, B0.5 Ia (Hiltner 1956); probable variable (Sagar & Joshi 1981).
197. B1 III (Shi & Hu 1999); polarisation = 0.059 (Hiltner 1956); O9.5 Ia (Massey et al. 1995); B0 IV (Hoag & Applenquist 1965); B1 (Walker & Hodge 1968); H emission (Kohoutek & Wehmeyer 1997); No H emission (Pigulski et al. 2000).
198. B1 III (Shi & Hu 1999, Massey et al. 1995); polarisation = 0.066 (Hiltner 1956); Variable star (Sagar & Joshi 1981)
199. K4 V (Shi & Hu 1999); anomalous position in the HR diagram (Sagar & Joshi 1981).
201. B1 V (Shi & Hu 1999).
202. O7 V((f)) (Massey et al. 1995, Shi & Hu 1999).
203. B1 V (Shi & Hu 1999); B0.5 III (Massey et al. 1995).
204. B0.5 V (Shi & Hu 1999, Massey et al. 1995).
205. B1 V (Shi & Hu 1999); B1.5 V (Massey et al. 1995); EA-type eclipsing binary, , A-type secondary (Pigulski et al. 2000).
207. B0 V (Shi & Hu 1999); B1 V (Massey et al. 1995).
209. Non-member on the basis of spectral type (Pigulaski et al. 2000); A3 (Egret et al. 1991); anomalous position in the HR diagram (Sagar & Joshi 1981).
210. B2 III (Shi & Hu 1999); B1 V (Massey et al. 1995).
211. F8 Ib (Shi & and Hu 1999), anomalous position in the HR diagram (Sagar & Joshi 1981).
| ID | ISOGAL-PJ../IRAS.. | F7 | F12 | F15 | F25 | F60 | F100 | SpI |
|---|---|---|---|---|---|---|---|---|
| MSX5C-G.. | A | C | D | E | () | |||
| (Name) | (Jy) | (Jy) | (Jy) | (Jy) | (Jy) | (Jy) | ||
| 1 | 05304-0435 | - | 0.48L | - | 4.25 | 36.45 | 32.03 | |
| 5 | 05318-0506 | - | 0.46 | - | 0.55 | 4.79L | 46.55L | |
| 13 | 05327-0529 | - | 33.86 | - | 366.60 | 4798.00 | 24.48 | |
| 27 | 05329-0512 | 22.77 | - | 54.22L | 630.70L | 22.69L | ||
| 30 | 05330-0517 | - | 82.07 | - | 560.70 | 1613.00L | 1600.00L | |
| 36 | 05333-0543 | - | 8.52 | - | 8.07 | 290.20L | 31.41L | |
| 41 | 05341-0530 | - | 3.68 | - | 7.64 | 122.30L | 648.20L | |
| 54 | 06288+0456 | - | 1.24 | - | 1.23 | 2.22L | 18.95L | |
| 57 | 06288+0452 | - | 0.71 | - | 0.63L | 2.28L | 11.42L | |
| G206.3519-02.1984 | 0.42 | - | - | - | - | - | ||
| 60 | 06291+0511 | - | 0.27L | - | 2.21 | 17.54L | 16.67L | |
| 62 | 06290+0508 | - | 0.98 | - | 1.55 | 2.16L | 19.82L | |
| 65 | 06289+0504 | - | 0.30L | - | 0.98 | 2.18L | 19.46L | |
| 71 | 06291+0456 | - | 0.43L | - | 0.88 | 2.47L | 20.44L | |
| 87 | 06311+0515 | - | 2.44 | - | 0.71 | 2.55 | 24.10L | |
| G206.2715-01.5439 | 3.40 | 1.74 | 1.74 | - | - | - | ||
| 90 | 06372+0936 | - | 0.27L | - | 0.28L | 2.53 | 15.27L | |
| G203.1040+01.8224 | 0.37 | - | - | - | - | - | ||
| 95 | G202.9883+02.0728 | 0.22 | - | - | - | - | - | |
| 97 | 06379+0950 | - | 1.82 | - | 3.77 | 1.57L | 619.80L | |
| G202.9947+02.1040 | 1.25 | - | 1.64 | 5.14 | - | - | ||
| 98 | G202.9478+02.1479 | 0.23 | - | - | - | - | - | |
| 101 | 06382+0939 | - | 7.06 | - | 16.25 | 212.80 | 499.30 | |
| 109 | G005.9186-00.9944 | 0.83 | - | - | - | - | - | |
| 110 | 18008-2421 | - | 21.41L | - | 32.91 | 7755.00L | 9036.00L | |
| 111 | 18008-2419 | - | 17.63 | - | 78.79 | 347.50L | 9036.00L | |
| G006.0569-01.1969 | 1.20 | 5.25 | 6.66 | 9.83 | - | - | ||
| 119 | G006.1532-01.2200 | 0.20 | - | 1.22 | 2.89 | - | - | |
| 121 | 18012-2421 | - | 3.98 | - | 25.68 | 26.20L | 9036.00L | |
| 126 | 18013-2423 | - | 6.85 | - | 51.59 | 429.60L | 1184.00L | |
| G006.0495-01.3286 | 1.17 | 2.87 | 4.34 | 17.20 | - | - | ||
| 129 | G006.0755-01.3232 | 0.43 | 1.76 | 3.06 | 10.77 | - | - | |
| 132 | G006.0617-01.3519 | - | - | - | 6.34 | - | - | |
| 134 | 18015-2409 | - | 2.99 | - | 3.46 | 513.50L | 1307.00L | |
| 146 | 18006-2422 | - | 167.70 | - | 1842.00 | 7755.00 | 9036.00 | |
| 149 | G006.3342-01.5543 | 4.03 | 2.06 | 1.55 | - | - | - | |
| 151 | G006.4488-01.6002 | 2.22 | - | 1.15 | - | - | - | |
| 152 | J181826.2-135005 | 0.04 | - | - | - | - | - | |
| 153 | J181830.0-134957 | 0.02 | - | - | - | - | - | |
| 154 | 18156-1343 | - | 22.78L | - | 55.62 | 1684.00 | 5317.00 | |
| 155 | J181832.7-134512 | 0.24 | - | 0.52 | - | - | - | |
| 156 | J181836.1-134736 | 0.08 | - | - | - | - | - | |
| 157 | J181836.4-134802 | 0.24 | - | - | - | - | - | |
| 160 | J181838.8-134644 | 0.22 | - | - | - | - | - | |
| G016.9605+00.8388 | 0.17 | - | - | - | - | - | ||
| 161 | J181840.1-134518 | 0.17 | - | - | - | - | - | |
| 166 | 18159-1346 | - | 5.97 | - | 19.30 | 169.90L | 5317.00L | |
| 167 | J181845.9-134631 | - | - | 0.52 | - | - | - | |
| 169 | J181853.2-134939 | - | - | 0.38 | - | - | - | |
| 170 | J181856.2-134830 | 0.11 | - | - | - | - | - | |
| 171 | J181858.7-135928 | 0.07 | - | - | - | - | - | |
| G016.8149+00.6699 | - | - | - | 3.38 | - | - | ||
| 172 | G016.8927+00.6807 | - | - | 1.13 | 5.06 | - | - | |
| 173 | J181904.9-134819 | 0.22 | - | 1.26 | - | - | - | |
| G016.9870+00.7339 | 0.34 | 1.88 | 2.67 | 7.89 | - | - | ||
| 175 | J181910.8-135649 | 0.37 | - | 0.37 | - | - | - | |
| G016.8754+00.6455 | 0.41 | - | - | 3.32 | - | - | ||
| 176 | J181751.1-135055 | 0.29 | - | 0.08 | - | - | - | |
| G016.8083+00.9765 | 0.17 | - | - | - | - | - | ||
| 177 | J181806.4-133625 | 0.13 | - | - | - | - | - | |
| 178 | J181906.5-135745 | 0.20 | - | - | - | - | - | |
| G016.8516+00.6530 | 0.27 | - | - | - | - | - | ||
| 179 | J181920.1-135420 | 0.05 | - | 0.37 | - | - | - | |
| 188 | 19399+2312 | - | 1.13 | 2.27 | 23.31L | 80.20L | ||
| 190 | J194211.2+232604 | 0.10 | - | 0.02 | - | - | - | |
| 191 | J194222.4+232305 | 0.01 | - | - | - | - | - | |
| 192 | J194227.1+232038 | 0.01 | - | - | - | - | - | |
| 195 | J194249.2+232754 | 0.16 | - | 0.03 | - | - | - | |
| 196 | J194254.8+231855 | - | - | 0.01 | - | - | - | |
| 197 | J194306.5+231618 | 0.03 | - | - | - | - | - | |
| 198 | J194309.5+232621 | 0.03 | - | 0.01 | - | - | - | |
| 199 | 19410+2322 | - | 0.59 | - | 0.93 | 2.26L | 43.78L | |
| 200 | J194310.7+231751 | 0.08 | - | 0.02 | - | - | - | |
| 203 | J194312.2+231634 | 0.02 | - | 0.05 | - | - | - | |
| 204 | J194313.3+231912 | 0.02 | - | 0.02 | - | - | - | |
| G059.4253-00.1490 | 0.10 | - | - | - | - | - | ||
| 207 | J194316.5+231915 | - | - | 0.04 | - | - | - | |
| 210 | G059.3539-00.2348 | 0.51 | 1.35 | - | - | - | - |
| ID | SpT | E(U-V) | E(B-V) | E(V-R) | E(V-I) | E(V-J) | E(V-H) | E(V-K) | EW(Å) | EW(Å) | Grp | Memb | |
|---|---|---|---|---|---|---|---|---|---|---|---|---|---|
| CaIIT | NaID | ||||||||||||
| 1 | B2.5 IV | 0.33 | 0.23 | 0.20 | - | 0.69 | 0.71 | 0.79 | 3.78 | 0.45 | 2 | M | |
| 2 | K2 IV | 1.21 | 0.57 | - | - | 1.36 | 1.62 | 1.69 | 3.26 | 2.87 | 1.11 | 1 | M |
| 3 | B8 V | 1.62 | 0.80 | 0.53 | 1.07 | 1.83 | 2.11 | 2.29 | 3.15 | 0.35 | 1 | M | |
| 4 | G8 V | 0.32 | 0.20 | - | - | 0.41 | 0.52 | 0.56 | - | 3.08 | 0.93 | 1 | M |
| 5 | F8 Ve | 0.61 | 0.33 | 0.17 | 0.39 | 1.07 | 1.55 | 2.03 | 4.42 | 0.26 | 0.73 | 3 | M |
| 6 | G9 IV-Ve | 0.05 | 0.36 | 0.14 | 0.31 | 0.95 | 1.27 | 1.45 | 3.60 | 1.80 | 1.06 | 2 | M |
| 7 | B8 | 1.47 | 0.82 | 0.58 | 1.15 | 1.90 | 2.18 | 2.29 | 3.07 | 0.20 | 1 | M | |
| 8 | A2 IIIe* | 0.90 | 0.52 | 0.41 | 0.77 | 1.26 | 2.01 | 2.75 | 3.31 | 0.45 | 3 | M | |
| 9 | A1 | 0.82 | 0.44 | 0.26 | 0.49 | 0.85 | 0.91 | 1.02 | 2.55 | 0.18 | 3 | M | |
| 10 | G0 V | 0.21 | 0.21 | 0.12 | 0.33 | 0.79 | 0.97 | 0.97 | 5.08 | 2.75 | 0.61 | 2 | M |
| 11 | A0 | 0.86 | 0.58 | 0.42 | 0.68 | 1.31 | 1.54 | 1.70 | 3.22 | 0.29 | 1 | M | |
| 12 | F8 | 1.46 | 0.74 | 0.59 | 1.05 | 2.11 | 2.51 | 2.84 | 3.89 | 2.65 | 0.49 | 2 | M |
| 13 | B2 V | 0.53 | 0.33 | 0.28 | 0.65 | 1.26 | 1.45 | 1.68 | 5.60 | 0.43 | 2 | M | |
| 14 | B3 V | 0.83 | 0.56 | 0.38 | 0.88 | 1.84 | 2.27 | 2.48 | 4.48 | 0.41 | 2 | M | |
| 15 | K0 Ve | 0.73 | 0.55 | 0.30 | 1.00 | 1.94 | 2.25 | 2.42 | 4.84 | 3.54 | 0.64 | 2 | M |
| 16 | A2 | 0.39 | 0.28 | - | - | 0.71 | 0.85 | 0.96 | 3.77 | 0.40 | 2 | M | |
| 17 | B0 V | 1.42 | 0.53 | - | - | 2.77 | 3.19 | 3.22 | 6.68 | 0.25 | 2 | M | |
| 18 | B0.5 V | 0.43 | 0.31 | 0.34 | 0.70 | 2.58 | 2.88 | 2.80 | 9.94 | 0.38 | 3 | M | |
| 19 | A0 | 0.14 | 0.22 | - | - | 1.06 | 1.27 | 1.44 | 7.20 | 0.19 | 2 | M | |
| 20 | A1 V | 0.46 | 0.32 | 0.27 | 0.65 | 1.27 | 1.51 | 1.65 | 5.67 | 0.63 | 2 | M | |
| 21 | B0.5 V | 0.55 | 0.36 | 0.30 | 0.66 | 1.26 | 1.54 | 1.74 | 5.32 | 0.27 | 2 | M | |
| 22 | O7 e | 0.52 | 0.30 | 0.28 | 0.66 | 1.35 | 1.69 | 1.89 | 6.14 | 0.30 | 2 | M | |
| 23 | G0 IV-IIIe | 0.94 | 0.47 | 0.27 | 0.65 | 1.35 | 1.70 | 1.84 | 2.92 | 1.95 | 0.87 | 2 | M |
| 24 | B2 V | 0.94 | 0.56 | 0.23 | 0.83 | 2.08 | 2.64 | 2.93 | 5.07 | 0.33 | 2 | M | |
| 25 | O9.5 V | 0.36 | 0.22 | 0.16 | - | 0.84 | 0.96 | 1.11 | 5.55 | 0.34 | 2 | M | |
| 26 | G8 V | 0.20 | 0.16 | 0.16 | 0.57 | 1.02 | 1.31 | 1.34 | - | 2.74 | 1.26 | 2 | M |
| 27 | G3 IV-Ve | 1.91 | 1.21 | 0.43 | 1.24 | 2.07 | 2.86 | 3.71 | 2.33 | 1.54 | 0.44 | 3 | M |
| 28 | G3 IV-V | 0.34 | 0.31 | 0.25 | 0.46 | 0.84 | 1.07 | 1.19 | 4.22 | 2.61 | 0.64 | 2 | M |
| 29 | G8 Ve | 1.39 | 0.41 | 0.13 | 0.61 | 1.06 | 1.39 | 1.48 | 3.53 | 2.32 | 0.88 | 2 | M |
| 30 | B0.5 V | 0.85 | 0.54 | 0.40 | 0.85 | 1.72 | 1.99 | 2.15 | 4.38 | 0.60 | 2 | M | |
| 31 | G9 IV-Ve | 0.71 | 0.37 | 0.12 | 0.65 | 1.12 | 1.47 | 1.62 | 4.13 | 2.56 | 1.22 | 2 | M |
| 32 | K2 IVe | 0.33 | 0.25 | - | 0.41 | 1.16 | 1.41 | 1.76 | 6.33 | 1.64 | 0.95 | 3 | M |
| 33 | K2 Ve | 0.48 | 0.28 | 0.12 | 0.72 | 1.01 | 1.22 | 1.51 | 4.92 | 1.33 | 1.13 | 3 | M |
| 34 | K1 Ve | 0.71 | 0.33 | 0.22 | 0.49 | 1.21 | 1.45 | 1.53 | 5.10 | 1.90 | 1.05 | 2 | M |
| 35 | A3 IIIe* | 0.66 | 0.33 | 0.03 | 0.30 | 1.58 | 2.57 | 3.65 | 6.53 | 0.42 | 3 | M | |
| 36 | B4 V | 1.28 | 0.81 | 0.67 | 1.40 | 2.84 | 3.44 | 3.77 | 4.48 | 0.41 | 2 | M | |
| 37 | A0 | 0.15 | 0.20 | 0.17 | 0.36 | 0.71 | 0.75 | 0.88 | 4.84 | 0.17 | 2 | M | |
| 38 | F6 IV | 0.46 | 0.26 | 0.12 | 0.40 | 0.80 | 0.93 | 0.99 | 4.19 | 3.12 | 0.30 | 2 | M |
| 39 | G6* | 0.41 | 0.11 | 0.10 | 0.40 | 0.33 | 0.40 | 0.42 | - | 2.70 | 0.68 | 3 | M |
| 40 | A7 | 0.03 | 0.06 | - | - | 0.25 | 0.24 | 0.29 | - | 0.22 | 2 | M | |
| 41 | B5 V | 1.41 | 0.87 | 0.73 | 1.39 | 2.40 | 2.74 | 2.91 | 3.68 | 0.11 | 2 | M | |
| 42 | F6 | 2.13 | 1.12 | 0.47 | - | 2.65 | 3.16 | 3.36 | 3.30 | 3.03 | 0.50 | 1 | M |
| 43 | A6* | 0.32 | 0.20 | 0.16 | 0.26 | 0.66 | 0.75 | 0.78 | 4.29 | 0.29 | 2 | M | |
| 44 | A0* | 0.92 | 0.70 | 0.42 | 0.90 | 1.53 | 1.75 | 1.82 | 2.86 | 0.23 | 3 | M | |
| 45 | G0 III | 0.70 | 0.41 | - | - | 1.10 | 1.29 | 1.39 | 3.73 | 2.50 | 0.50 | 2 | M |
| 46 | F9 V | 0.19 | 0.19 | - | - | 0.47 | 0.52 | 0.53 | - | 2.20 | 0.41 | 1 | M |
| 47 | G6* | 1.29 | 0.53 | - | - | 1.71 | 2.06 | 2.23 | 4.63 | 2.76 | 0.75 | 2 | NM |
| 48 | F6 V | 0.04 | 0.02 | - | - | 0.24 | 0.30 | 0.28 | - | 1.65 | 0.37 | 3 | NM |
| 49 | A1 IV | 0.48 | 0.21 | - | - | 0.52 | 0.50 | 0.61 | 3.20 | 0.37 | 1 | M | |
| 50 | B9 V | 0.98 | 0.58 | - | - | 1.40 | 1.51 | 1.65 | 3.13 | 0.37 | 1 | M | |
| 51 | F1 V | 0.31 | 0.14 | - | - | 0.43 | 0.40 | 0.43 | - | 2.35 | 0.44 | 3 | NM |
| 52 | B2.5 II-III | 1.62 | 0.91 | - | 1.38 | 2.45 | 2.80 | 3.03 | 3.66 | 0.59 | 2 | M | |
| 53 | K5 | 1.20 | 0.51 | - | 0.63 | 1.23 | 1.45 | 1.61 | 3.47 | 3.23 | 0.96 | 3 | NM |
| 54 | F4* | 0.12 | 0.05 | - | 0.19 | 0.35 | 0.42 | 0.47 | - | 2.47 | 0.38 | 3 | NM |
| 55 | A7 V | 0.28 | 0.13 | - | - | 0.36 | 0.35 | 0.37 | - | 0.42 | 3 | NM | |
| 56 | B2 V | 0.66 | 0.40 | 0.31 | 0.58 | 0.97 | 1.11 | 1.16 | 3.19 | 0.46 | 1 | M | |
| 57 | B0.5 V | 0.78 | 0.42 | 0.40 | 0.74 | 1.13 | 1.30 | 1.40 | 3.67 | 0.48 | 3 | M | |
| 58 | O8 V | 0.87 | 0.46 | 0.31 | 0.67 | 1.10 | 1.27 | 1.34 | 3.20 | 0.57 | 1 | M | |
| 59 | F4 V | 0.12 | 0.07 | - | - | -0.07 | -0.07 | -0.06 | - | 2.32 | 0.42 | 3 | NM |
| 60 | F7 | 0.73 | 0.34 | - | - | 1.19 | 1.38 | 1.45 | 4.69 | 2.06 | 0.49 | 2 | PM |
| 61 | B8 V | 0.53 | 0.33 | - | 0.42 | 0.81 | 0.90 | 0.92 | 3.07 | 0.37 | 2 | M | |
| 62 | A5 | 0.53 | 0.34 | - | 0.52 | 0.96 | 1.03 | 1.15 | 3.72 | 0.54 | 2 | M | |
| 63 | G7 III | 0.24 | 0.15 | - | 0.23 | 0.41 | 0.44 | 0.53 | - | 3.00 | 0.67 | 3 | NM |
| 64 | O8.5 V | 1.02 | 0.49 | 0.42 | 0.75 | 1.19 | 1.33 | 1.39 | 3.12 | 0.48 | 3 | M | |
| 65 | B0 V | 0.71 | 0.38 | 0.34 | 0.63 | 1.10 | 1.24 | 1.27 | 3.68 | 0.46 | 2 | M | |
| 66 | B8 V | 0.67 | 0.43 | - | 0.58 | 1.09 | 1.23 | 1.34 | 3.43 | 0.32 | 2 | M | |
| 67 | O5 V | 0.81 | 0.48 | 0.27 | 0.58 | 1.01 | 1.15 | 1.25 | 2.86 | 0.50 | 1 | M | |
| 68 | B4 V | 0.74 | 0.45 | 0.53 | 1.34 | 1.15 | 1.32 | 1.47 | 3.59 | 0.46 | 2 | M | |
| 69 | A2 V | 0.07 | 0.03 | 0.17 | 0.17 | 0.15 | 0.10 | 0.17 | - | 0.24 | 3 | NM | |
| 70 | B1 V | 0.67 | 0.40 | 0.26 | 0.55 | 1.01 | 1.12 | 1.21 | 3.33 | 0.58 | 2 | M |
Table 6. Continued.
| ID | SpT | E(U-V) | E(B-V) | E(V-R) | E(V-I) | E(V-J) | E(V-H) | E(V-K) | EW(Å) | EW(Å) | Grp | Memb | |
|---|---|---|---|---|---|---|---|---|---|---|---|---|---|
| CaIIT | NaID | ||||||||||||
| 71 | B2.5 V | 0.77 | 0.48 | - | 0.60 | 1.15 | 1.29 | 1.41 | 3.23 | 0.50 | 2 | M | |
| 72 | B9 V | 0.73 | 0.47 | 0.88 | 1.54 | 1.18 | 1.33 | 1.49 | 3.49 | 0.35 | 2 | M | |
| 73 | B3 V | 0.48 | 0.39 | 0.23 | 0.48 | 0.98 | 1.15 | 1.20 | 3.38 | 0.57 | 2 | M | |
| 74 | B2.5 V | 0.77 | 0.49 | 0.36 | 0.70 | 1.22 | 1.36 | 1.48 | 3.32 | 0.44 | 2 | M | |
| 75 | O9 V | 0.91 | 0.45 | 0.31 | 0.66 | 1.13 | 1.27 | 1.39 | 3.40 | 0.45 | 1 | M | |
| 76 | B2 V | 0.85 | 0.48 | 0.29 | 0.60 | 1.14 | 1.30 | 1.39 | 3.19 | 0.47 | 2 | M | |
| 77 | B7 V | 0.87 | 0.58 | - | 0.61 | 1.40 | 1.60 | 1.79 | 3.39 | 0.45 | 2 | M | |
| 78 | B6 V | 0.66 | 0.45 | 0.37 | 0.70 | 1.17 | 1.37 | 1.45 | 3.54 | 0.42 | 2 | M | |
| 79 | B8 IV | 0.68 | 0.43 | - | 0.57 | 1.14 | 1.36 | 1.46 | 3.73 | 0.37 | 2 | M | |
| 80 | B0.5 V | 0.72 | 0.42 | 0.24 | 0.55 | 1.03 | 1.16 | 1.22 | 3.20 | 0.34 | 1 | M | |
| 81 | O4 V | 0.93 | 0.53 | 0.30 | 0.69 | 1.22 | 1.42 | 1.51 | 3.13 | 0.37 | 1 | M | |
| 82 | B3 V | 0.89 | 0.50 | 0.28 | 0.65 | 1.37 | 1.67 | 2.04 | 3.74 | 0.43 | 3 | M | |
| 83 | B6 V | 0.86 | 0.55 | - | 0.74 | 1.37 | 1.54 | 1.64 | 3.28 | 0.52 | 2 | M | |
| 84 | O9.5 V | 1.47 | 0.84 | 0.49 | 1.11 | 2.18 | 2.51 | 2.67 | 3.50 | 0.43 | 2 | M | |
| 85 | F3 V | 0.59 | 0.21 | - | - | 0.53 | 0.54 | 0.61 | 3.20 | 3.10 | 0.47 | 3 | NM |
| 86 | G1 V | 0.32 | 0.17 | - | - | 0.48 | 0.57 | 0.62 | - | 2.80 | 0.43 | 3 | NM |
| 87 | K3 Ibe | 1.62 | 0.77 | - | - | 1.91 | 2.66 | 2.63 | 3.38 | 4.56 | 1.44 | 3 | PM |
| 88 | F9 V* | 0.25 | 0.06 | 0.03 | 0.10 | 0.32 | 0.36 | 0.41 | - | 2.55 | 0.34 | 3 | M |
| 89 | F9* | 0.28 | 0.18 | 0.17 | 0.30 | 0.65 | 0.82 | 0.87 | - | 2.37 | 0.36 | 3 | M |
| 90 | K1 V | 3.93 | 1.66 | 0.73 | 1.91 | 3.26 | 3.87 | 4.20 | 2.68 | 3.58 | 0.96 | 3 | NM |
| 91 | G0 e* | 0.02 | 0.03 | 0.13 | 0.07 | 0.27 | 0.32 | 0.36 | - | 3.04 | 0.20 | 3 | PM |
| 92 | F8 Ve* | 0.52 | 0.25 | 0.13 | 0.35 | 0.68 | 0.91 | 1.12 | 3.71 | 1.95 | 0.62 | 3 | M |
| 93 | G5* | 1.89 | 0.91 | 0.57 | - | 2.30 | 2.69 | 2.89 | 3.49 | 3.01 | 0.76 | 3 | NM |
| 94 | B3 | 1.71 | 0.91 | 0.67 | 1.62 | 3.15 | 3.88 | 4.36 | 4.71 | 0.24 | 3 | PM | |
| 95 | B2 V | 1.24 | 0.86 | 0.55 | 1.43 | 2.96 | 3.62 | 4.04 | 4.77 | 0.59 | 3 | PM | |
| 96 | G0 IV-V | 0.04 | 0.02 | 0.04 | 0.11 | 0.27 | 0.34 | 0.37 | - | 3.14 | 0.61 | 3 | M |
| 97 | B8 IIIe* | 0.69 | 0.25 | 0.39 | 0.93 | 1.53 | 2.55 | 3.75 | 8.35 | 0.49 | 3 | M | |
| 98 | A2 IVe | 0.11 | 0.08 | 0.07 | 0.21 | 0.43 | 0.79 | 1.47 | - | 0.44 | 3 | M | |
| 99 | F8 Ve | 0.50 | 0.33 | 0.11 | 0.31 | 0.86 | 1.10 | 1.17 | 3.90 | 1.93 | 0.71 | 3 | M |
| 100 | G5 Ve | 0.47 | 0.26 | 0.01 | 0.17 | 0.51 | 0.79 | 1.11 | 2.70 | 0.06 | 0.73 | 3 | M |
| 101 | G8 Ve | 0.29 | 0.21 | 0.10 | 0.21 | 0.56 | 0.87 | 1.28 | 3.64 | 2.38 | 0.45 | 3 | M |
| 102 | F9* | 0.23 | 0.10 | 0.05 | 0.00 | 0.21 | 0.31 | 0.32 | - | 2.82 | 0.34 | 3 | M |
| 103 | K0* | 2.28 | 1.14 | 0.70 | 1.48 | 2.75 | 3.17 | 3.45 | 3.33 | 3.13 | 0.69 | 3 | NM |
| 104 | A2* | 0.99 | 0.56 | 0.15 | - | 1.27 | 1.44 | 1.56 | 3.06 | 0.53 | 1 | NM | |
| 105 | K0* | 1.67 | 0.86 | 0.26 | - | 1.83 | 2.18 | 2.34 | 2.99 | 2.83 | 0.67 | 3 | NM |
| 106 | G8 | 1.08 | 0.27 | 0.02 | 0.07 | 0.37 | 0.51 | 0.56 | 2.28 | 3.15 | 0.89 | 3 | NM |
| 107 | O7 | 0.54 | 0.29 | - | - | 0.71 | 0.84 | 0.92 | 3.49 | 0.56 | 1 | M | |
| 108 | B0.5 | 0.52 | 0.29 | 0.16 | 0.37 | 0.77 | 0.79 | 0.88 | 3.34 | 0.52 | 2 | M | |
| 109 | B5 e | 0.37 | 0.29 | - | - | 0.82 | 1.04 | 1.27 | 3.86 | 0.68 | 3 | M | |
| 110 | O4 V | 0.64 | 0.35 | 0.27 | 0.53 | 0.94 | 1.10 | 1.18 | 3.71 | 0.58 | 2 | M | |
| 111 | B0 V | 0.49 | 0.30 | - | 0.38 | 0.74 | 0.82 | 0.86 | 3.15 | 0.52 | 2 | M | |
| 112 | B4 | 0.61 | 0.35 | - | 0.48 | 0.97 | 1.13 | 1.18 | 3.71 | 0.58 | 2 | M | |
| 113 | B8 | 0.24 | 0.36 | - | 0.59 | 1.15 | 1.45 | 1.60 | 4.89 | 0.29 | 2 | M | |
| 114 | F4 I* | 0.49 | 0.24 | 0.33 | 0.73 | 0.81 | 0.90 | 0.96 | 4.40 | 5.07 | 0.42 | 3 | NM |
| 115 | B2 e | 1.98 | 1.05 | 0.63 | 1.46 | 3.12 | 3.99 | 4.44 | 4.05 | 0.67 | 3 | M | |
| 116 | B3 V | 0.40 | 0.31 | 0.28 | 0.53 | 0.94 | 1.10 | 1.20 | 4.26 | 0.58 | 2 | M | |
| 117 | G7 | 0.92 | 0.41 | - | 0.50 | 1.00 | 1.17 | 1.29 | 3.46 | 0.86 | 3 | NM | |
| 118 | B2 V | 0.34 | 0.28 | 0.18 | 0.37 | 0.72 | 0.80 | 0.89 | 3.50 | 0.56 | 2 | M | |
| 119 | B2 | 0.41 | 0.33 | - | 0.18 | 0.77 | 0.72 | 0.83 | 3.17 | 0.63 | 2 | M | |
| 120 | B8 | 0.44 | 0.30 | - | 0.58 | 1.16 | 1.42 | 1.58 | 5.79 | 0.39 | 2 | M | |
| 121 | B1.5 V | 0.52 | 0.35 | 0.16 | 0.44 | 0.95 | 1.08 | 1.20 | 3.77 | 0.62 | 2 | M | |
| 122 | B2 V | 0.58 | 0.42 | 0.24 | 0.62 | 1.31 | 1.63 | 1.99 | 4.25 | 0.68 | 3 | M | |
| 123 | B2 V | 0.49 | 0.33 | 0.15 | 0.42 | 1.05 | 1.19 | 1.34 | 4.47 | 0.67 | 2 | M | |
| 124 | B1 V | 0.62 | 0.33 | 0.18 | 0.46 | 0.96 | 1.13 | 1.22 | 4.07 | 0.60 | 2 | M | |
| 125 | B2 V | 0.56 | 0.36 | - | 0.47 | 0.96 | 1.09 | 1.15 | 3.51 | 0.75 | 2 | M | |
| 126 | B0 IVe | 0.78 | 0.46 | 0.32 | 0.76 | 1.45 | 1.74 | 2.13 | 4.30 | 0.38 | 3 | M | |
| 127 | B2 V | 0.51 | 0.35 | 0.16 | 0.44 | 0.89 | 1.04 | 1.12 | 3.52 | 0.91 | 2 | M | |
| 128 | B2 V | 0.59 | 0.39 | 0.14 | 0.41 | 1.02 | 1.17 | 1.29 | 3.64 | 0.85 | 2 | M | |
| 129 | B2 IV | 0.53 | 0.32 | - | - | 0.85 | 0.90 | 1.02 | 3.51 | 0.50 | 2 | M | |
| 130 | B2.5 V | 0.48 | 0.32 | - | 0.48 | 0.93 | 1.11 | 1.20 | 4.13 | 0.72 | 2 | M | |
| 131 | B2.5 V | 0.22 | 0.28 | 0.21 | 0.39 | 0.81 | 0.90 | 1.01 | 3.97 | 0.62 | 2 | M | |
| 132 | B1 V | 0.50 | 0.33 | - | 0.49 | 0.97 | 1.10 | 1.18 | 3.93 | 0.68 | 2 | M | |
| 133 | B2.5 V | 0.46 | 0.35 | 0.22 | 0.45 | 0.94 | 1.24 | 1.26 | 3.66 | 0.58 | 2 | M | |
| 134 | B0.5 V | 0.62 | 0.41 | - | - | 1.02 | 1.14 | 1.22 | 3.27 | 0.86 | 2 | M | |
| 135 | B2 V | 0.63 | 0.40 | 0.06 | 0.35 | 0.87 | 1.05 | 1.22 | 3.36 | 0.65 | 1 | M | |
| 136 | B2 IV | 0.38 | 0.26 | 0.23 | 0.44 | 0.67 | 0.95 | 1.09 | 4.51 | 0.56 | 3 | M | |
| 137 | B2 V | 0.62 | 0.33 | - | 0.51 | 0.98 | 1.10 | 1.22 | 4.07 | 0.50 | 2 | M | |
| 138 | B2 V | - | 0.33 | - | - | 0.73 | 0.85 | 0.93 | 3.10 | 0.48 | 2 | M | |
| 139 | B6 | 0.32 | 0.31 | - | 0.46 | 0.81 | 0.88 | 0.95 | 3.37 | 0.40 | 2 | M | |
| 140 | B3 | 0.55 | 0.36 | 0.26 | 0.50 | 1.05 | 1.18 | 1.27 | 3.88 | 0.55 | 2 | M |
Table 6. Continued.
| ID | SpT | E(U-V) | E(B-V) | E(V-R) | E(V-I) | E(V-J) | E(V-H) | E(V-K) | EW(Å) | EW(Å) | Grp | Memb | |
|---|---|---|---|---|---|---|---|---|---|---|---|---|---|
| CaIIT | NaID | ||||||||||||
| 141 | B2.5 V | 0.74 | 0.47 | 0.30 | 0.64 | 1.30 | 1.57 | 1.70 | 3.98 | 0.85 | 2 | M | |
| 142 | O6.5 V | 0.74 | 0.41 | 0.25 | 0.55 | 1.11 | 1.28 | 1.34 | 3.60 | 0.67 | 2 | M | |
| 143 | K5 | 0.13 | 0.13 | - | 0.00 | 0.05 | 0.00 | 0.01 | - | 3.38 | 1.15 | 3 | NM |
| 144 | B6 | 0.61 | 0.38 | - | 0.62 | 1.27 | 1.50 | 1.65 | 4.78 | 0.70 | 2 | M | |
| 145 | K2 | 0.44 | 0.32 | - | 0.34 | 0.35 | 0.34 | 0.41 | 1.41 | 0.75 | 3 | NM | |
| 146 | B2 | 0.67 | 0.40 | 0.25 | 0.50 | 1.31 | 1.51 | 1.66 | 4.57 | 0.65 | 2 | M | |
| 147 | B3 | 0.76 | 0.48 | - | - | 1.20 | 1.45 | 1.58 | 3.62 | 0.82 | 2 | M | |
| 148 | B8 | 0.64 | 0.52 | - | - | 1.45 | 1.70 | 1.84 | 3.89 | 0.60 | 2 | M | |
| 149 | K7 I-III* | 2.28 | 1.17 | - | - | 2.64 | 3.33 | 3.67 | 3.68 | 6.41 | 2.63 | 3 | PM |
| 150 | B6 | 1.63 | 1.00 | 0.74 | 1.41 | 2.60 | 2.94 | 3.16 | 3.48 | 0.22 | 2 | M | |
| 151 | K7 III-IV* | 2.68 | 1.30 | - | - | 2.75 | 3.42 | 3.63 | 3.26 | 2.20 | 3 | PM | |
| 152 | B1 V | 1.12 | 0.73 | 0.44 | 0.99 | 1.85 | 2.08 | 2.23 | 3.36 | 1.17 | 2 | M | |
| 153 | B0.5 V | 1.25 | 0.75 | 0.48 | 1.04 | 1.93 | 2.22 | 2.33 | 3.42 | 0.76 | 2 | M | |
| 154 | O8.5 V | 2.29 | 1.33 | 0.88 | 1.97 | 3.76 | 4.34 | 4.70 | 3.89 | 0.45 | 2 | M | |
| 155 | 05.5 V | 1.92 | 1.12 | 0.74 | 1.68 | 3.15 | 3.68 | 3.97 | 3.90 | 0.60 | 2 | M | |
| 156 | O6.5 V | 1.26 | 0.76 | 0.49 | 1.08 | 1.96 | 2.22 | 2.43 | 3.52 | 0.68 | 2 | M | |
| 157 | O4 V | 1.27 | 0.77 | 0.53 | 1.18 | 2.04 | 2.40 | 2.59 | 3.70 | 0.60 | 2 | M | |
| 158 | B1 V | 1.43 | 0.91 | 0.56 | 1.28 | 2.27 | 2.60 | 2.78 | 3.36 | 0.51 | 2 | M | |
| 159 | B1.5 V | 1.61 | 0.94 | 0.52 | 1.17 | 2.38 | 2.80 | 3.00 | 3.51 | 0.53 | 2 | M | |
| 160 | B2 | 1.41 | 1.07 | 0.72 | 1.61 | 2.98 | 3.51 | 3.99 | 3.80 | 0.42 | 3 | M | |
| 161 | O7 IIb | 2.01 | 1.19 | 0.77 | 1.65 | 3.05 | 3.57 | 3.80 | 3.51 | 0.68 | 2 | M | |
| 162 | B1 V | 1.18 | 0.70 | 0.40 | 0.95 | 1.86 | 2.15 | 2.30 | 3.61 | 0.40 | 2 | M | |
| 163 | B0.5 V | 1.69 | 1.01 | 0.66 | 1.45 | 2.64 | 3.05 | 3.23 | 3.52 | 0.63 | 2 | M | |
| 164 | O9.5 V | 1.23 | 0.79 | 0.42 | 1.01 | 1.78 | 2.00 | 2.18 | 3.04 | 0.99 | 1 | M | |
| 165 | B2 V | 1.33 | 0.77 | 0.67 | 1.28 | 2.18 | 2.50 | 2.66 | 3.80 | 1.04 | 2 | M | |
| 166 | B1.5 V | 1.53 | 0.88 | 0.58 | 1.30 | 2.42 | 2.79 | 2.90 | 3.63 | 0.66 | 2 | M | |
| 167 | B0 V | 1.46 | 0.92 | 0.57 | 1.26 | 2.35 | 2.64 | 2.85 | 3.41 | 0.75 | 2 | M | |
| 168 | B1 V | 1.83 | 1.08 | 0.81 | 1.66 | 2.97 | 3.43 | 3.72 | 3.79 | 0.98 | 2 | M | |
| 169 | O9.5 V | 0.88 | 0.58 | 0.32 | 0.71 | 1.33 | 1.48 | 1.56 | 2.96 | 0.71 | 1 | M | |
| 170 | O8.5 V | 1.11 | 0.71 | 0.46 | 1.00 | 1.84 | 2.14 | 2.30 | 3.56 | 0.85 | 2 | M | |
| 171 | O9.5 I | 0.95 | 0.61 | 0.38 | 0.85 | 1.37 | 1.52 | 1.65 | 2.98 | 0.90 | 1 | M | |
| 172 | B1 V | 0.79 | 0.55 | 0.28 | 0.68 | 1.35 | 1.51 | 1.60 | 3.20 | 0.78 | 2 | M | |
| 173 | B0.5 Ve | 1.09 | 0.70 | 0.42 | 0.94 | 1.77 | 2.01 | 2.21 | 3.47 | 0.67 | 2 | M | |
| 174 | B5 e | 0.94 | 0.59 | 0.36 | 0.78 | 1.44 | 1.61 | 1.80 | 3.36 | 0.81 | 2 | PM | |
| 175 | B1 e | 0.91 | 0.58 | 1.07 | 1.71 | 2.24 | 2.64 | 3.03 | 5.27 | 0.61 | 3 | M | |
| 176 | B2.5 I | 2.27 | 1.30 | 0.82 | 1.79 | 3.46 | 3.96 | 4.30 | 3.64 | 0.83 | 2 | PM | |
| 177 | G9* | 1.36 | 0.55 | - | - | 1.40 | 1.62 | 1.76 | 3.52 | 0.84 | 3 | NM | |
| 178 | G6 | 1.44 | 0.56 | 0.33 | 0.68 | 1.37 | 1.65 | 1.83 | 3.59 | 1.22 | 3 | NM | |
| 179 | B1.5 V | 0.99 | 0.62 | 0.38 | 0.86 | 1.52 | 1.80 | 1.98 | 3.51 | 0.92 | 2 | M | |
| 180 | B1 | - | 0.64 | - | - | 1.77 | 1.92 | 2.11 | 3.63 | 0.67 | 2 | M | |
| 181 | B9 V | - | 0.41 | - | - | 1.06 | 1.16 | 1.25 | 3.35 | 0.54 | 3 | NM | |
| 182 | A0 III | - | 0.41 | - | - | 1.19 | 1.29 | 1.45 | 3.89 | 0.49 | 3 | NM | |
| 183 | B9.5 IV | - | 0.21 | - | - | 0.70 | 0.75 | 0.84 | 4.40 | 0.57 | 3 | NM | |
| 184 | B9 IV | - | 0.18 | - | - | 0.90 | 1.03 | 1.15 | - | 0.57 | 3 | NM | |
| 185 | K0* | - | 0.43 | - | - | 0.97 | 1.12 | 1.23 | 3.15 | 0.74 | 3 | NM | |
| 186 | A0 IV | - | 0.19 | - | - | 0.78 | 0.88 | 0.97 | - | 0.63 | 3 | M | |
| 187 | B1.5 | - | 0.59 | - | - | 1.56 | 1.79 | 1.87 | 3.49 | 0.67 | 1 | M | |
| 188 | B0.5 IV | 1.87 | 1.10 | - | - | 2.34 | 2.63 | 2.79 | 2.79 | 0.70 | 1 | M | |
| 189 | B2 V | 1.52 | 0.96 | - | - | 2.23 | 2.50 | 2.63 | 3.01 | 0.85 | 1 | M | |
| 190 | O8 V | 1.78 | 1.09 | - | - | 2.43 | 2.76 | 2.88 | 2.91 | 1.00 | 1 | M | |
| 191 | B2 V | 1.60 | 0.99 | - | - | 2.20 | 2.47 | 2.64 | 2.93 | 0.87 | 1 | M | |
| 192 | B1.5 V | 1.41 | 0.95 | - | - | 1.95 | 2.24 | 2.36 | 2.73 | 0.87 | 1 | M | |
| 193 | B1.5 V | 1.64 | 0.95 | - | - | 1.96 | 2.26 | 2.42 | 2.80 | 0.97 | 1 | M | |
| 194 | G8 III | 1.46 | 0.76 | - | - | 1.46 | 1.49 | 1.74 | 2.62 | 3.39 | 0.98 | 3 | NM |
| 195 | B0.5 I | 1.93 | 1.08 | 0.68 | 1.25 | 2.32 | 2.60 | 2.71 | 2.76 | 0.83 | 3 | PM | |
| 196 | B4 V | 1.13 | 0.77 | - | - | 1.94 | 2.25 | 2.40 | 3.43 | 0.45 | 1 | M | |
| 197 | B0 IV | 1.22 | 0.74 | - | - | 1.69 | 1.88 | 2.00 | 2.97 | 0.90 | 1 | M | |
| 198 | B1 III | 1.86 | 1.07 | - | - | 2.14 | 2.26 | 2.51 | 2.73 | 0.82 | 3 | M | |
| 199 | K8 V | 1.38 | 0.62 | - | - | 1.16 | 1.34 | 1.52 | 2.70 | 2.98 | 1.20 | 3 | NM |
| 200 | B2.5 V | 1.30 | 0.88 | - | - | 1.87 | 2.15 | 2.35 | 2.94 | 0.74 | 1 | M | |
| 201 | B1.5 V | 1.11 | 0.82 | - | - | 1.94 | 2.14 | 2.31 | 3.10 | 0.91 | 1 | M | |
| 202 | O7 V | 1.46 | 0.88 | 0.54 | 1.16 | 2.08 | 2.38 | 2.49 | 3.11 | 0.39 | 1 | M | |
| 203 | B0.5 V | 1.72 | 1.04 | 0.63 | 1.33 | 2.44 | 2.74 | 2.90 | 3.07 | 0.47 | 1 | M | |
| 204 | B0.5 V | 1.63 | 1.02 | 0.62 | 1.32 | 2.31 | 2.75 | 2.95 | 3.18 | 0.81 | 1 | M | |
| 205 | B1 V | 1.61 | 0.99 | - | - | 2.43 | 2.74 | 2.92 | 3.24 | 0.42 | 1 | M | |
| 206 | F8 V | 0.25 | 0.22 | - | - | 0.63 | 0.71 | 0.75 | 3.75 | 2.84 | 0.87 | 3 | NM |
| 207 | B1 V | 1.75 | 1.06 | - | - | 2.65 | 2.99 | 3.19 | 3.31 | 0.53 | 1 | M | |
| 208 | F2 IV | 0.05 | 0.11 | - | - | 0.31 | 0.32 | 0.34 | - | 2.75 | 0.69 | 3 | NM |
| 209 | A9 | 1.83 | 1.08 | 0.64 | 1.21 | 2.10 | 2.57 | 2.71 | 2.65 | 0.45 | 3 | NM | |
| 210 | B0.5 V | 1.93 | 1.15 | - | - | 2.69 | 3.04 | 3.23 | 3.09 | 0.46 | 1 | M | |
| 211 | F8 Ib | 1.29 | 0.66 | - | - | 1.40 | 1.60 | 1.72 | 2.87 | 4.43 | 0.54 | 3 | NM |
| ID | SpT | Emission peculiarities |
|---|---|---|
| 5+ | F8 V | CaII HK in core emission, Strong Hα, totally filled Hβ |
| 6* | G9 IV-V | CaII HK in emission |
| 8* | A2 III | Hα partially filled in emission |
| 15*+ | K0 V | CaII HK in emission on wide absorption |
| 22 | O7 | Hα partially filled in emission |
| 23* | G0 III-IV | CaII HK partially filled, Hα in weak emission |
| 27+ | G3 IV-V | CaII HK and Balmer lines in emission |
| 29* | G8 V | CaII HK partially filled, Hα in weak emission |
| 31 | G9 IV-V | CaII HK in emission on absorption |
| 32+ | K2 IV | CaII HK in emission, Hα in strong emission |
| 33+ | K2 V | CaII HK and Balmer lines in emission |
| 34 | K1 V | CaII HK in filled emission, weak Hα emission |
| 35+ | A3 III | Hα in strong emission |
| 87* | K3 Ib | CaII HK in emission |
| 91* | G0 | CaII HK weak emission on wide absorption |
| 92* | F8 V | Hα partially filled in emission |
| 97+ | B8 | Hα in strong emission, Hβ partially filled in emission |
| 98+ | A2 IV | Hα totally filled in emission |
| 99* | F8 V | CaII HK partially filled, Hα totally filled in emission |
| 100+ | G5 V | CaII HK in emission, Hα in strong emission |
| 101+ | G8 V | CaII partially filled, Hα in strong emission |
| 109* | B5 | Hβ in emission, Hγ partially filled in emission |
| 115* | B2 | Hβ and Hγ partially filled in emission |
| 122 | B2 V | Hβ in emission, Hγ partially filled in emission |
| 126 | B0 IV | Hβ in emission, Hγ partially filled in emission |
| 160 | B2 | Hβ in emission |
| 173 | B0.5 V | Hβ partially filled in emission |
| 175 | B1 | Hβ totally filled in emission |
| 174 | B5 | Hβ totally filled in emission |
| SpT | N | Luninosity types | Emission line stars | ||||
| I | II | III | IV | V | (Balmer, CaII HK, both) | ||
| O | 22 | 1 | 1 | 19 | 1 (1, -, -) | ||
| B | 109 | 2 | 2 | 5 | 91 | 9 (9, -, -) | |
| A | 20 | 1 | 2 | 14 | 3 (3, -, -) | ||
| F | 20 | 2 | 2 | 13 | 3 (3, 2, 2) | ||
| G | 24 | 3 | 13 | 8 (5, 8, 5) | |||
| K | 16 | 1 | 1 | 9 | 5 (3, 5, 3) | ||
| Total | 211 | 5 | 1 | 7 | 10 | 159 | 29 |
| Source | Groups | No. | RV | ||||||
|---|---|---|---|---|---|---|---|---|---|
| Cluster | |||||||||
| van den Hulst | 0.75 | 0.43 | 1.13 | 1.21 | |||||
| Cardelli et al. | 0.78 | 0.44 | 0.27 | 0.56 | 1.14 | 1.24 | |||
| NGC 1976 | 1 | 6 | |||||||
| 2 | 28 | ||||||||
| NGC 2244 | 1 | 10 | |||||||
| 2 | 19 | ||||||||
| 1,2 | 30 | ||||||||
| NGC 6530 | 2 | 33 | |||||||
| NGC 6611 | 1 | 3 | |||||||
| 2 | 23 | ||||||||
| NGC 6823 | 1 | 16 |
| ID | ID | |||||||
|---|---|---|---|---|---|---|---|---|
| 5 | 1.07 | 0.33 | 0.70 | 94 | 3.15 | 0.29 | 0.45 | |
| 6 | 0.95 | 0.19 | 0.27 | 95 | 2.96 | 0.25 | 0.37 | |
| 8 | 1.26 | 0.57 | 1.19 | 97 | 1.53 | 0.81 | 1.85 | |
| 12 | 2.11 | 0.10 | 0.22 | 98 | 0.43 | 0.30 | 0.94 | |
| 14 | 1.84 | 0.17 | 0.20 | 100 | 0.51 | 0.21 | 0.48 | |
| 17 | 2.77 | 0.03 | -0.21 | 101 | 0.56 | 0.23 | 0.59 | |
| 18 | 2.58 | -0.06 | -0.40 | 109 | 0.82 | 0.11 | 0.25 | |
| 22 | 1.35 | 0.15 | 0.22 | 115 | 3.12 | 0.43 | 0.57 | |
| 23 | 1.35 | 0.16 | 0.17 | 119 | 0.77 | -0.16 | -0.12 | |
| 24 | 2.08 | 0.27 | 0.35 | 122 | 1.31 | 0.14 | 0.37 | |
| 27 | 2.07 | 0.50 | 1.14 | 126 | 1.45 | 0.09 | 0.33 | |
| 29 | 1.06 | 0.18 | 0.17 | 133 | 0.94 | 0.17 | 0.09 | |
| 31 | 1.12 | 0.19 | 0.23 | 136 | 0.67 | 0.19 | 0.26 | |
| 32 | 1.16 | 0.09 | 0.32 | 149 | 2.13 | 0.25 | 0.33 | |
| 33 | 1.01 | 0.07 | 0.26 | 151 | 2.75 | 0.29 | 0.22 | |
| 35 | 1.58 | 0.77 | 1.69 | 160 | 2.98 | 0.11 | 0.29 | |
| 36 | 2.84 | 0.20 | 0.25 | 175 | 2.24 | 0.09 | 0.25 | |
| 82 | 1.37 | 0.11 | 0.34 | 194 | 1.46 | -0.17 | -0.07 | |
| 87 | 1.91 | 0.48 | 0.26 | 198 | 2.14 | -0.18 | -0.14 | |
| 90 | 3.26 | 0.15 | 0.16 | 209 | 2.10 | 0.18 | 0.11 | |
| 92 | 0.68 | 0.13 | 0.28 |
| ID | SpT | HI | CaII | Excess | EW (Hα) | SpI | Memb | Remark |
|---|---|---|---|---|---|---|---|---|
| (NIR) | (Å) | |||||||
| 5+ | F8 V | Y | Y | S | -4.0 | Y | CTT | |
| 6 | G9 IV-V | - | Y | W | - | - | Y | WTT |
| 8 | A2 e | Y | - | S | 1.6 | - | Y | HAB I |
| 15+ | K0 V | - | Y | - | - | - | Y | WTT |
| 22 | O7 | Y | - | W | - | - | Y | CBe |
| 23 | G0 III-IV | Y | Y | W | - | - | Y | WTT |
| 27+ | G3 IV-V | Y | Y | S | -7.0 | Y | CTT | |
| 29 | G8 V | Y | Y | W | - | - | Y | WTT |
| 31 | G9 IV-V | - | Y | W | - | - | Y | WTT |
| 32+ | K2 IV | Y | Y | M | -4.1 | - | Y | CTT |
| 33+ | K2 V | Y | Y | W | -3.0 | - | Y | CTT |
| 34 | K1 V | Y | Y | - | - | - | Y | WTT |
| 35+ | A3 e | Y | - | S | -3.0 | - | Y | HAB I |
| 91 | G0 | - | Y | - | - | - | Y | WTT |
| 92 | F8 | Y | - | W | - | - | Y | WTT |
| 97+ | B8 e | Y | - | S | -14.7 | Y | HAB I | |
| 98+ | A2 IVe | Y | - | S | 0.2 | Y | HAB I | |
| 99 | F8 V | Y | Y | - | - | - | Y | WTT |
| 100+ | G5 V | Y | Y | S | -4.3 | - | Y | CTT |
| 101+ | G8 V | Y | Y | S | -2.1 | Y | CTT | |
| 109 | B5 | Y | - | W | - | Y | HAB I or III | |
| 115 | B2 | Y | - | W | - | - | Y | CBe |
| 122 | B2 V | Y | - | M | - | - | Y | HAB I or III |
| 126 | B0 IV | Y | - | M | - | Y | HAB I or III | |
| 160 | B2 | Y | - | M | - | Y | HAB III or CBe | |
| 173 | B0.5 | Y | - | - | - | Y | HAB I or III | |
| 174 | B5 | Y | - | - | - | - | Y | CBe |
| 175 | B1 | Y | - | W | - | Y | HAB I or III |
| ID | SpT | Excess | SpI | Memb | Remarks |
| (near-IR) | |||||
| 1 | B2.5 IV | - | Y | PVLS | |
| 12 | F8 | W | - | Y | PVLS |
| 13 | B2 V | - | Y | PVLS | |
| 14 | B3 V | W | - | Y | PVLS |
| 24+ | B2 V | W | - | Y | PVLS |
| 30 | B0.5 V | - | Y | PVLS | |
| 36 | B4 V | W | Y | PVLS | |
| 41 | B5 V | - | Y | PVLS | |
| 54 | F4 | - | N | PVLS | |
| 57 | B0.5 V | - | Y | ||
| 60 | F7 | - | PY | PVLS | |
| 62 | A5 | - | Y | PVLS | |
| 65 | B0 V | - | Y | ||
| 71 | B2.5 V | - | Y | PVLS | |
| 82 | B3 V | M | - | Y | |
| 87* | K3 Ib | S | PY | AGB ? | |
| 94 | B3 V | W | - | Y | PVLS |
| 95 | B2 V | W | - | Y | VLS |
| 110 | O4 V | - | Y | ||
| 111 | B0 V | - | Y | PVLS | |
| 119 | B2 V | - | Y | PVLS | |
| 121 | B1.5 V | - | Y | PVLS | |
| 129 | B2 IV | - | Y | PVLS | |
| 134 | B0.5 V | - | Y | PVLS | |
| 136 | B2 IV | W | - | Y | PVLS |
| 146 | B2 | - | Y | PVLS | |
| 149 | K7 III | M | PY | AGB ? | |
| 151+ | K7 III-IV | M | PY | AGB ? | |
| 154 | O5.5 V | - | Y | PVLS | |
| 166 | B1.5 V | - | Y | PVLS | |
| 172 | B1 V | - | Y | PVLS | |
| 179 | B1.5 V | - | Y | ||
| 188 | B0.5 IV | - | Y | ||
| 200 | B2.5 V | - | Y | ||
| 203 | B0.5 V | - | Y | ||
| 204 | B0.5 V | - | Y | ||
| 210 | B0.5 V | - | Y | PVLS |
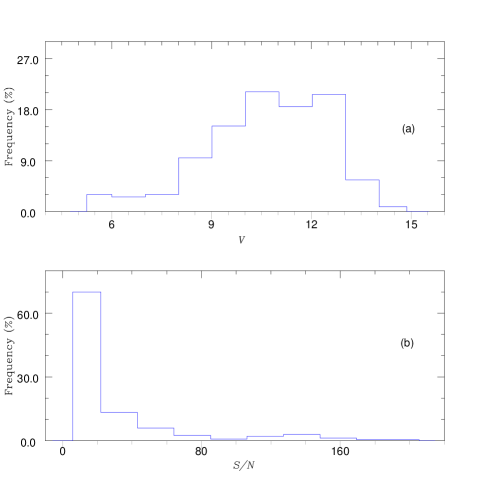
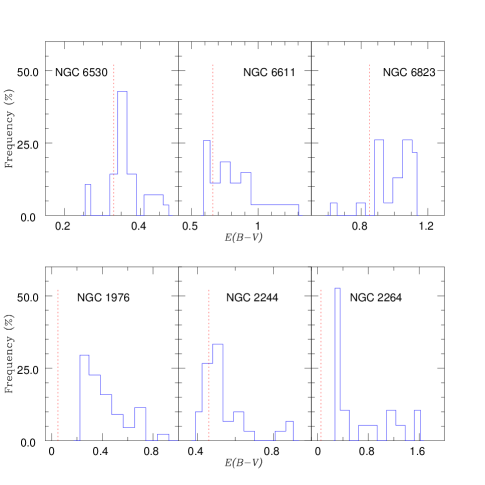


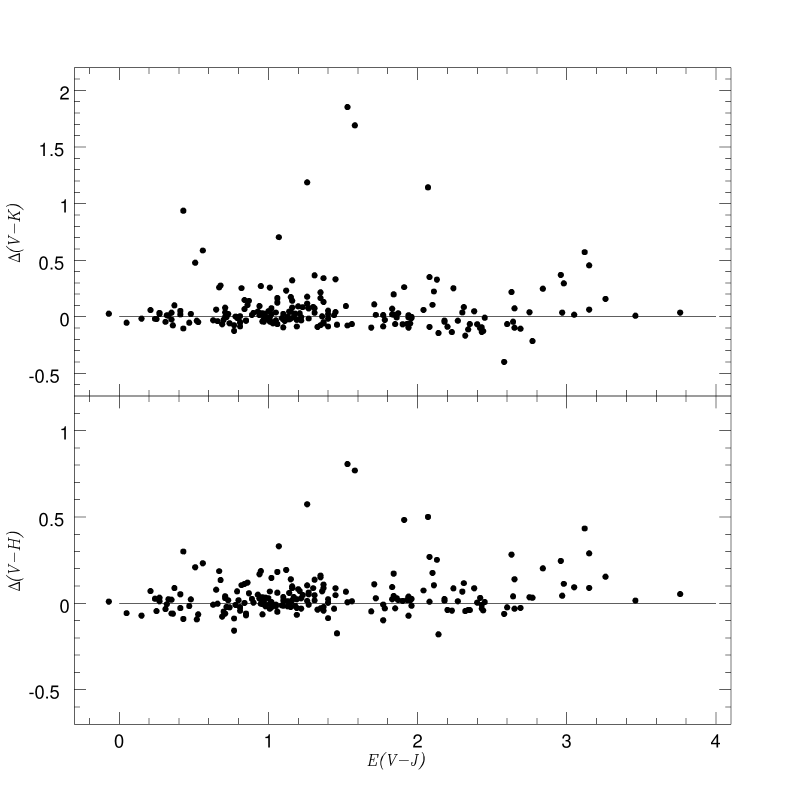
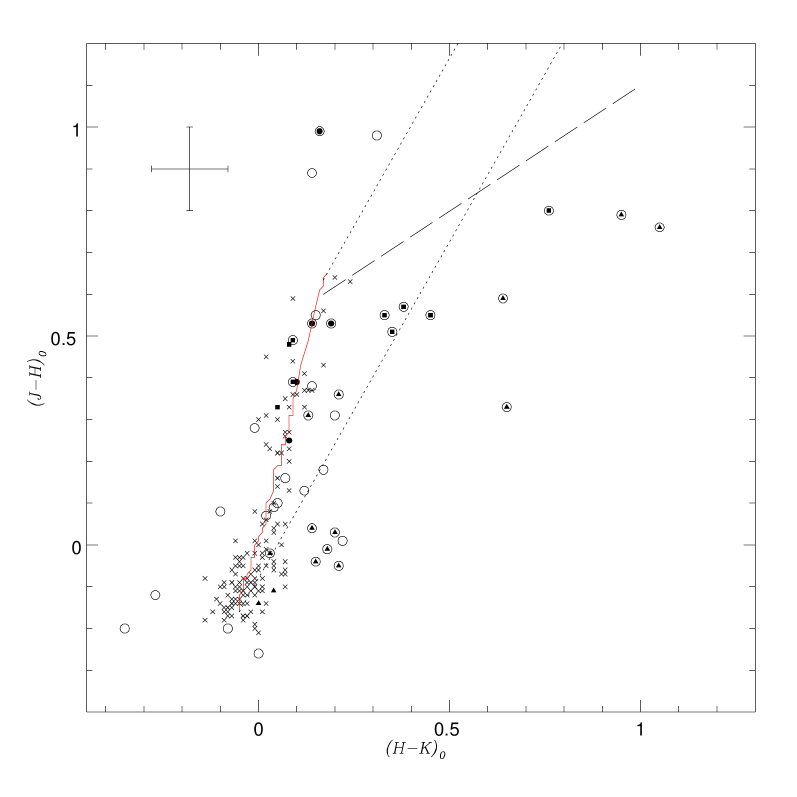
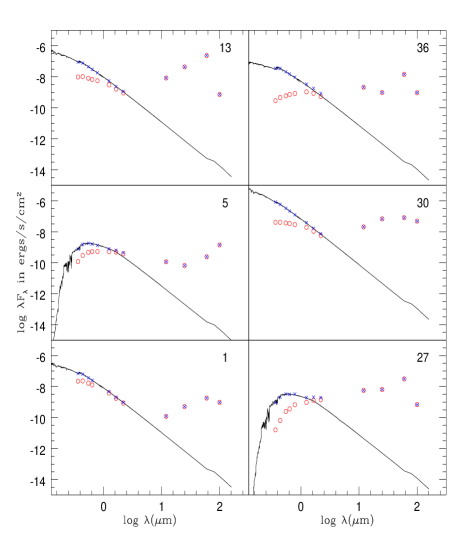
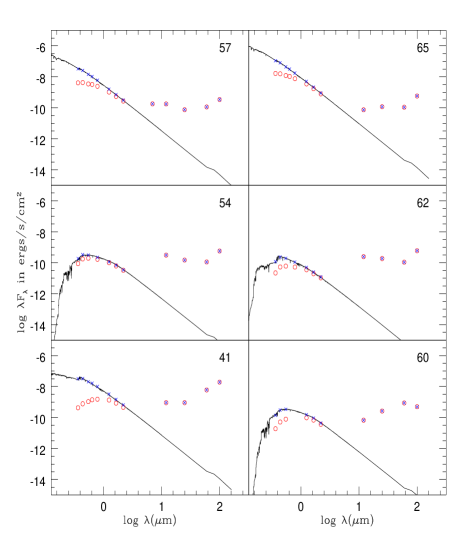
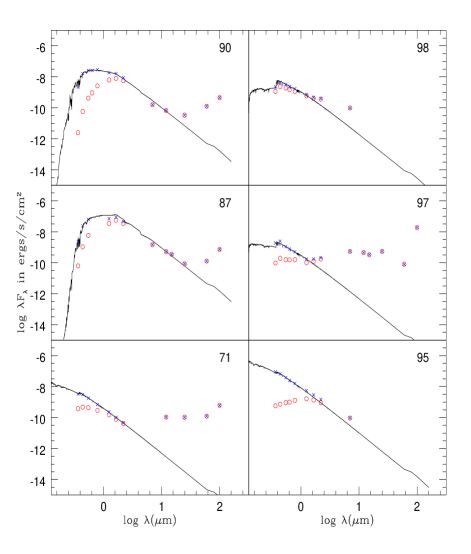

![[Uncaptioned image]](/html/astro-ph/0312485/assets/x14.png)
![[Uncaptioned image]](/html/astro-ph/0312485/assets/x15.png)
![[Uncaptioned image]](/html/astro-ph/0312485/assets/x16.png)
![[Uncaptioned image]](/html/astro-ph/0312485/assets/x17.png)
Figure. 12 Continued.