Star formation history and dust attenuation in galaxies drawn from ultraviolet surveys
Abstract
We compile a new sample of 115 nearby, non-Seyfert galaxies spanning a wide range of star formation activities, from starburst to nearly dormant, based on ultraviolet observations with various satellites. We combine these observations with infrared observations to study the relation between ratio of total far-infrared to ultraviolet luminosities and ultraviolet spectral slope (the ‘IRX-UV’ relation). We show that, at fixed ultraviolet spectral slope, quiescent star-forming galaxies in our sample have systematically lower ratio of total far-infrared to ultraviolet luminosities than starburst galaxies. The strengths of spectral indices sensitive to star formation history, such as the 4000 Å spectral discontinuity and the H emission equivalent width, correlate well with distance from the mean relation for starburst galaxies in the IRX-UV diagram, while there is little or no correlation between the dust-sensitive H/H ratio and this distance. This is strong observational evidence that the star formation history is relevant to the ‘second parameter’ affecting the IRX-UV relation. We show that these results can be understood in the framework of the simple model of Charlot & Fall 2000 for the transfer of starlight through the interstellar medium in galaxies. We confirm that, for starburst galaxies, the tight IRX-UV relation can be understood most simply as a sequence in overall dust content. In addition, we find that the broadening of the relation for quiescent star-forming galaxies can be understood most simply as a sequence in the ratio of present to past-averaged star formation rates. We use a library of Monte Carlo realizations of galaxies with different star formation histories and dust contents to quantify the accuracy to which the ultraviolet attenuation of a galaxy can be estimated from either the ratio of far-infrared to ultraviolet luminosities or the ultraviolet spectral slope. We provide simple formulae for estimating as a function of either of these observational quantities and show that the accuracy of these estimates can be significantly improved if some constraints are available on the ratio of present to past-averaged star formation rates.
keywords:
dust, extinction — galaxies: general — ultraviolet: galaxies1 Introduction
Much of what we know about the universe at high redshift arises from observations of the rest-frame ultraviolet emission of distant galaxies that is accessible from the ground at optical and near-infrared wavelengths. For this reason, significant effort has been devoted over the past several years to improve our understanding of the star formation history and dust attenuation in galaxies drawn from ultraviolet surveys. Recent progress in this area has come mainly from studies of a sample of 57 nearby starburst galaxies, for which a wide range of observations were compiled by Meurer, Heckman & Calzetti (1999). In particular, for these galaxies there is a remarkably tight correlation between ratio of total far-infrared to ultraviolet luminosities, , and ultraviolet spectral slope, , which is referred to as the ‘infrared excess (IRX)-ultraviolet (UV)’ relation (here is defined by a power-law fit of the form to the spectrum at wavelengths Å; Calzetti et al. 1994). Meurer et al. (1999) find that the IRX-UV relation allows reliable estimates of the attenuation by dust at ultraviolet wavelengths, , from either or . This relation, if universal, represents our best hope to estimate the attenuation by dust and hence the star formation rates of high-redshift galaxies, for which the rest-frame optical and infrared emission cannot be observed at present.
The main uncertainty affecting the IRX-UV relation is that it has been established only for starburst galaxies. Recently, Bell (2002) has compiled a small sample of nearby, more quiescent galaxies drawn from ultraviolet observations with various satellites (here we use the term ‘quiescent’ to describe the broad class of star-forming galaxies between active starburst and dormant early-type galaxies). His results suggest that quiescent galaxies deviate from the IRX-UV relation for starburst galaxies, in the sense that quiescent galaxies tend to have ‘redder’ ultraviolet spectra at fixed . This implies that the simple Meurer et al. (1999) recipe to estimate from either or may not hold for all galaxy types. The results of Bell (2002) raise several questions. Can star formation history alone account for the distribution of galaxies in the IRX-UV diagram? Or do the galaxies have different dust properties? Charlot & Fall (2000) have developed a simple dust model, based on an idealized prescription of the main features of the (clumpy) interstellar medium (ISM), which allows one to interpret the IRX-UV relation and the emission-line properties of starburst galaxies in terms of star formation rate and dust content. This model accounts for the different attenuation affecting young and old stars in a galaxy, because of the dispersal of the (giant molecular) clouds in which stars form. Using this model, Charlot & Fall (2000) show that the tight IRX-UV relation for starburst galaxies can be understood most simply as a sequence in the overall dust content. Clearly, to gain insight into the origin of the IRX-UV relation for different types of galaxies, we require further observations and modelling of not only the ultraviolet and infrared luminosities, but also other observable quantities with distinct dependences on dust content and star formation history.
In this paper, we compile a new sample of 115 nearby, non-Seyfert galaxies spanning a wide range of star formation activities, from starburst to nearly dormant, to explore the physical parameters driving the location of a galaxy in the IRX-UV diagram. Our sample is drawn from ultraviolet observations with various satellites. We combine these observations with infrared observations and, for a subset of the galaxies, with optical spectroscopy from various sources. We examine, in particular, the 4000 Å spectral discontinuity and the H emission equivalent width, which are good indicators of star formation activity, and the H/H ratio, which is a good indicator of attenuation by dust. Based on these data alone, it appears that the broadening of the IRX-UV relation for quiescent star-forming galaxies is most likely driven by star formation history. We combine the simple dust model of Charlot & Fall (2000) with the population synthesis code of Bruzual & Charlot (2003) and show that this model can account for the ultraviolet and far-infrared properties of the galaxies in our sample. The model allows us to understand why the ratio of present to past-averaged star formation rates is the most likely ‘second’ parameter that, in combination with dust content, determines the position of a galaxy in the IRX-UV diagram. In Section 2 below, we compile our galaxy sample and investigate the origin of the IRX-UV relation from an observational viewpoint. In Section 3, we interpret the IRX-UV relation using the model. We explore the implications of our results for estimates of the ultraviolet attenuation in galaxies in Section 4. Our conclusions are summarized in Section 5.
2 The origin of the IRX-UV relation: observational insight
In this section, we re-examine the IRX-UV relation from an observational viewpoint. We combine ultraviolet observations from various satellites with observations from the Infrared Astronomical Satellite (IRAS) to compile a new sample of nearby, non-Seyfert galaxies spanning a wide range of star formation activities in the IRX-UV diagram. We explore how the position of a galaxy in this diagram depends on observable properties with distinct dependences on dust content and star formation history.
2.1 The data
We compile a new sample of nearby, non-Seyfert galaxies spanning a wide range of star formation activities, using available observations with the International Ultraviolet Explorer (IUE), the Orbiting Astronomical Observatory (OAO) and the Astronomical Netherlands Satellite (ANS). We first extract all (non-Seyfert) spiral, elliptical, irregular and emission-line galaxies (classes 80, 81, 82 and 88) from the IUE Newly-Extracted Spectra (INES version 3.0) archive. The spectra in this database extend over two wavelength domains, corresponding to the far- (1150–1980 Å) and near-ultraviolet (1850–3350 Å) spectrographs on-board IUE. We reject galaxies with only near-ultraviolet spectra, for which the ultraviolet spectral slope cannot be measured reliably. When both the far- and near-ultraviolet spectra are available for a galaxy, we merge them to form a single ultraviolet spectrum encompassing the range from 1150 to 3350 Å (the spectra usually agree to within a few percent in the overlapping region around 1900–1950 Å). We remove foreground Galactic extinction using the dust maps of Schlegel, Finkbeiner & Davis (1998) and the Galactic extinction curve of Cardelli, Clayton & Mathis (1989). Furthermore, we co-add the spectra of galaxies observed multiple times to increase the signal-to-noise ratio. For the ultraviolet spectral slope to be measured with reasonable accuracy, a minimum signal-to-noise ratio per pixel of 3 is required (see Appendix). A total of 110 galaxies with both far- and near-ultraviolet spectra and 185 galaxies with only far-ultraviolet spectra satisfy this cut in signal-to-noise ratio.
We require two additional conditions to include galaxies in our final sample: that optical photometry be available to estimate the ultraviolet aperture correction, and that IRAS 25, 60 and 100 m observations be available to estimate the total luminosity reradiated by dust. The above sample of 295 galaxies includes the 57 starburst galaxies with optical angular diameters less than studied by Meurer et al. (1999), for which most of the concentrated ultraviolet emission could be observed within the IUE aperture. IRAS 25, 60 and 100 m observations are available for 50 of the Meurer et al. galaxies, which we include in our final sample. For other galaxies, reasonable ultraviolet aperture corrections may be derived as a function of the effective optical radius and morphological type (Rifatto, Longo & Capaccioli 1995b). Morphological types are known for IUE galaxies, but effective optical radii must be obtained from independent observations. We thus cross-correlate the above sample of 238 IUE galaxies not included in the Meurer et al. (1999) sample with the Data Release One of the Sloan Digital Sky Survey (SDSS DR1; Abazajian et al. 2003). In this way, we obtain effective -band radii for 41 galaxies (with typical, i.e. median ), for which we compute ultraviolet aperture corrections using the prescription of Rifatto et al. (1995b). The corrections vary from galaxy to galaxy, with a mean logarithmic ratio of corrected-to-observed ultraviolet fluxes of . Only 33 of these galaxies have available IRAS 25, 60 and 100 m observations and can be included in our final sample. These typically have morphological types earlier than the starburst galaxies of the Meurer et al. (1999) (Sa-Sc versus Sc-Im, although some starburst galaxies are also present) and similar absolute -band magnitudes, (we adopt a Hubble constant km s-1 Mpc-1).
We supplement this sample with (non-Seyfert) galaxies for which multi-band ultraviolet imaging with ANS and OAO is available from the compilation of Rifatto, Longo & Capaccioli (1995a). In the spectral range of interest to us, the galaxies observed with ANS were imaged at 1550, 1800, 2200 and 2500 Å through a fixed aperture of . Those observed with OAO were imaged at 1550, 1910 and 2460 Å through a fixed circular aperture of diameter. Of the 95 galaxies observed with ANS in the Rifatto et al. (1995a) compilation, 34 have available IRAS 25, 60 and 100 m observations. We reject 5 galaxies with optical diameters larger than , for which the ultraviolet emission does not appear to be clearly concentrated within the ANS aperture, and 2 galaxies with larger-aperture imaging available from OAO (see below). The remaining 27 galaxies have typical morphological types Sb-Sd and absolute -band magnitudes similar to those of the galaxies in the IUE sample, . Of the 36 galaxies with OAO imaging, 11 have available IRAS 25, 60 and 100 m observations. We reject 6 galaxies with optical diameters larger than . We thus retain only 5 galaxies with OAO imaging in our final sample, two Sc galaxies with , two Sd galaxies with and an Im galaxy with . Our final sample contains 115 galaxies with both ultraviolet and infrared data, of which 83 were observed with IUE, 27 with ANS and 5 with OAO. About half are starburst galaxies (most belonging to the Meurer et al. 1999 sample), while the other half are earlier-type, more quiescent galaxies spanning a similar range of absolute -band magnitudes.
We compute ultraviolet spectral slopes for all the galaxies in our sample. Calzetti et al. (1994) define the ultraviolet spectral slope by a power-law fit of the form (where is the flux per unit wavelength) to the spectrum in ten continuum bands in the range Å. We cannot use this definition here, because it does not apply to galaxies for which only multi-band ultraviolet imaging is available. Instead, we adopt the following definition of the ultraviolet spectral slope for all the galaxies in our sample,
| (1) |
where Å and Å are the effective wavelengths of the far- (1350–1800 Å) and near-ultraviolet (1800–3000 Å) filters on board the Galaxy Evolution Explorer (GALEX, Martin et al. 2003), and and are the mean flux densities (per unit wavelength) through these filters. In the Appendix, we use a reference sample of 110 IUE spectra to calibrate the conversions between and the ultraviolet spectral slopes estimated from observations with different satellites. We show that, in particular, ultraviolet spectral slopes estimated from ANS and OAO imaging observations can be converted into with an rms uncertainty of only . This is similar to the uncertainty introduced in by the lack of near-ultraviolet spectra for some IUE galaxies in our sample. For all the galaxies in our sample, we compute the ultraviolet flux as , as described in the Appendix.
To estimate the total far-infrared flux from the observed IRAS flux densities , and , we appeal to the recent prescription of Dale & Helou (2002). This is based on model fits to the spectra of a large sample of nearby, normal (i.e. non-Seyfert) star-forming galaxies across the whole wavelength range from 3 to 850 m. We use equation (5) of Dale & Helou to compute ( in their notation) from , and . For reference, for the IUE starburst galaxies in our sample, the values of computed in this way are typically 50% larger than those estimated by Meurer et al. (1999) from only and using the older prescription of Helou et al. (1988; see also Calzetti et al. 2000). Neglecting possible anisotropies (Section 4), we equate the ratio of total far-infrared to ultraviolet fluxes to the corresponding luminosity ratio .
2.2 The observational IRX-UV diagram
Fig. 1 shows as a function of for the 115 galaxies in our sample. Different symbols distinguish the 50 starburst galaxies studied by Meurer et al. (1999, solid dots) and the (typically more quiescent) galaxies observed with IUE+SDSS (stars), ANS (open triangles) and OAO (filled triangles). To a first, rough approximation, is a function of for the whole sample. As found previously by Meurer et al. (1995, 1999), the two quantities are tightly correlated for starburst galaxies, for which the typical scatter at fixed amounts to a factor of less than 2 in . The main novelty introduced by the inclusion of more quiescent galaxies in our sample is an increase of the scatter to a factor of more than 3 toward lower values at fixed .111It is worth noting that no galaxy in Fig. 1 lies substantially above the IRX-UV relation for starburst galaxies. This is not unexpected, since our sample of galaxies drawn from ultraviolet surveys (with typical infrared luminosities ) does not include ‘luminous and ultraluminous infrared galaxies’, which tend to have larger than starburst galaxies at fixed (presumably because of the heavy obscuration of the sources of ultraviolet radiation; Goldader et al. 2002). The effect is real, as the observational scatter is much larger than the typical (i.e. median) measurement errors (which are shown in the lower right corner of Fig. 1). We note that the shape of the IRX-UV relation does not appear to be affected by the inclusion of quiescent galaxies in our sample.

What are the main physical parameters driving the relation between ultraviolet spectral slope and ratio of far-infrared to ultraviolet luminosities for star-forming galaxies? Charlot & Fall (2000) show that, for starburst galaxies, the tight relation between and can be understood most simply as a sequence in the overall dust content of the galaxies. The inclusion of quiesent star-forming galaxies in Fig. 1 reveals that a ‘second parameter’ tends to broaden the relation. We may begin by identifying this second parameter as the perpendicular distance from the mean IRX-UV relation for starburst galaxies. Following Meurer et al. (1999), we define the mean relation for starburst galaxies by a least-squares fit of the type
| (2) |
to the observations of the 50 starburst galaxies in our sample. The result is shown by the solid line in Fig. 1. We can compute the perpendicular (i.e. shortest) distance from each point in the IRX-UV diagram to this line. We adopt the convention of negative for galaxies with lower than the mean value for starburst galaxies at fixed (see Fig. 1).
We expect the second parameter affecting the IRX-UV relation to be connected to star formation history, since the relation becomes broader when quiescent star-forming galaxies are considered in addition to starburst galaxies. It is thus natural to explore how observed quantities with different dependences on the star formation history correlate with . We first consider the 4000 Å spectral discontinuity index D, defined as the ratio of the average flux densities in the narrow bands 3850–3950 Å and 4000–4100 Å (Balogh et al. 1999). This index depends somewhat on metallicity but correlates more with the ratio of present to past-averaged star formation rates in galaxies, and hence, it is a valuable indicator of the history of star formation (Brinchmann et al. 2003). Also, the narrowness of the bands used to compute D makes it largely insensitive to attenuation by dust. Medium-resolution spectra (3–9 Å FWHM) of 64 galaxies in our sample (35 starburst and 29 quiescent star-forming) are available from Kennicutt (1992), McQuade, Calzetti & Kinney (1995), Storchi-Bergmann, Kinney & Challis (1995), Kong & Cheng (2002) and Abazajian et al. (2003). Fig. 2a shows D measured from these spectra as a function of the perpendicular distance from the mean starburst IRX-UV relation. The Spearman rank correlation coefficient is , indicating that the correlation between D and is significant at the level for this sample size. This result is remarkable, as it is direct observational evidence that star formation history is relevant to the second parameter affecting the IRX-UV relation.

Another observable quantity that is sensitive to the ratio of present to past-averaged star formation rates is the H emission equivalent width EW(H) (Kennicutt 1983; Kennicutt, Tamblyn & Congdon 1994). This is the ratio of the H emission-line luminosity produced by young massive stars to the continuum luminosity per unit wavelength produced by older stars at Å. In Fig. 2b, we show EW(H) as a function of for 59 galaxies (31 starburst and 28 quiescent star-forming) in our sample (we adopt the convention of positive equivalent width for emission). The H emission equivalent widths were measured from the same optical spectra as above following the procedure outlined in section 2 of Brinchmann et al. (2003), which allows accurate correction for stellar absorption. The Spearman rank correlation coefficient in this case is , indicating that the correlation between EW(H) and is significant at the level for the sample size. We note that dust can reduce EW(H) through the absorption of ionizing photons. However, the effect is modest for quiescent star-forming galaxies, typically only 20–30 per cent, and cannot account for the trend seen in Fig. 2b (Charlot et al. 2002). Taken together, Figs 2a and b show that two different tracers of the ratio of present to past-averaged star formation rates, D and EW(H), correlate with . This is strong evidence that the ratio of present to past-averaged star formation rates could be the second parameter affecting the IRX-UV relation.
In an attempt to further understand the relative influence of star formation history and attenuation by dust on the IRX-UV relation, we plot other properties of the galaxies against in Figs 2c and d: the ratio of the IRAS and flux densities and the ratio of the H and H emission line luminosities. The ratio, available for all 115 galaxies in our sample, depends on the relative contributions by young and old stars to dust heating in a galaxy (e.g., Helou 1986). Hence it is an indirect tracer of the star formation history that also depends on the dust content (and potentially the spatial distribution of dust relative to stars). The H/H ratio, available for 48 galaxies (29 starburst and 19 quiescent star-forming) from the same optical spectra as above, is strongly sensitive to attenuation by dust but not to the past history of star formation. The Spearman rank correlation coefficients are for the relation between and and for that between and . For the different numbers of galaxies in each case, this implies that the correlation between and is significant at the level, while there appears to be little or no correlation between and . These findings reinforce our contention that the second parameter affecting the IRX-UV relation is primarily star formation history rather than dust content.
Based on the observational evidence above, we conclude that, while dust content is the primary driver of the IRX-UV relation for starburst galaxies, the broadening of the relation for quiescent star-forming galaxies is most likely driven by star formation history, and in particular the ratio of present to past-averaged star formation rates. In the next section, we show that this observational result can be understood in the framework of a simple model for the production of starlight and its transfer through the interstellar medium (ISM) of galaxies.
3 The origin of the IRX-UV relation: Modelling
In this section, we explore the physical origin of the IRX-UV relation from a more theoretical standpoint. We appeal to a simple model for the production of starlight and its transfer through the interstellar medium in galaxies. The model is based on a combination of the Bruzual & Charlot (2003) population synthesis code and the Charlot & Fall (2000) prescription for the absorption of starlight by dust. The Charlot & Fall model relies on an idealized description of the main features of the ISM. Stars are assumed to form in interstellar ‘birth clouds’ (i.e. giant molecular clouds). After yr, young stars disrupt their birth clouds and migrate into the ‘ambient ISM’. The ‘effective absorption’ curve describing the attenuation of photons emitted in all directions by stars of age in a galaxy is given by the simple formula
| (3) |
where is the total effective -band optical depth seen by young stars. The adjustable parameter defines the fraction of the total effective absorption optical depth contributed by the ambient interstellar medium ( on average, with substantial scatter). In addition, a fraction of the effective absorption optical depth of the birth clouds is assumed to arise from the Hii regions ionized by young stars in the inner parts of these clouds. We note that, in the case of optically thick birth clouds, the ultraviolet radiation escaping from a galaxy is produced by stars older than yr, while the total far-infrared luminosity is produced by stars of all ages.
Charlot & Fall (2000) used their model to interpret the relations between ultraviolet spectral slope, ratio of far-infrared to ultraviolet luminosities and H/H ratio for the starburst galaxies in the Meurer et al. (1999) sample (Section 2). They showed that the finite lifetime of the birth clouds is a key ingredient for resolving the apparent discrepancy between the attenuation of line and continuum radiation in these galaxies. They also showed that the IRX-UV relation can be understood most simply as a sequence in the overall dust content of the galaxies. For simplicity, Charlot & Fall (2000) limited their study to models with constant star formation rates and young ages, as appropriate to interpret observations of starburst galaxies. The results of Section 2 above suggest that star formation history plays an important role in defining the IRX-UV relation for more quiescent galaxies. To investigate the dependence of the IRX-UV relation on star formation history, we assume that the star formation rate varies with time as
| (4) |
from to the present galaxy age . The parameter is the inverse time-scale of star formation. For simplicity, all models are assumed for the moment to have fixed solar metallicity.
Our main goal is to identify the model parameter that most simply accounts for the offset of normal, quiescent star-forming galaxies from the mean IRX-UV relation for starburst galaxies in Fig. 1. To do this, we must explore the influence of each primary model parameter (, , and ) on observable quantities available for galaxies in our sample, i.e. the ultraviolet spectral slope, the ratio of far-infrared to ultraviolet luminosities and the 4000 Å discontinuity. The influence of and on and can be inferred from the results presented in figure 2 of Charlot & Fall (2000): these parameters, in particular the effective dust absorption optical depth in the ambient ISM, , control the position of a galaxy along the IRX-UV relation. The narrow-band spectral index D is only weakly sensitive to variations in and (Section 2). We find that the influence of the star formation history on the IRX-UV relation through the parameters and is best described in terms of the ratio of present to past-averaged star formation rates. This is defined by
| (5) |
For the expression of in equation (4), we have
| (6) |
For reference, a galaxy with constant star formation rate () has at all ages.222Since the age of the oldest stars in a galaxy is difficult to estimate observationally, it is often replaced by some reference age, for example the age of the Universe (e.g. Kennicutt 1983; Kennicutt, Tamblyn & Congdon 1994). Such an approximation leads to larger than obtained when using the definition given in equation (5).
Fig. 3 summarizes the main results of our analysis. In Fig. 3a, we show as a function of for sequences of models with different ages for four different time-scales of star formation, corresponding to , 0.5, 1.0 and 2.0 Gyr-1, and for and . The sequences are plotted as solid lines at ages when the ratio of present to past-averaged star formation rates is larger than and as dashed lines at greater ages, down to . From (age ) to , the distance from the mean starburst relation increases as decreases along the model sequences, models with occupying regions of the diagram populated by more quiescent galaxies. This behavior arises mainly from an increase in as decreases. Models with are dominated by stellar populations with intrinsically redder spectra and hence larger ultraviolet spectral slopes than starburst galaxies. We note that, for , all models in Fig. 3a follow a similar path in the IRX-UV diagram. For , the evolution in the IRX-UV diagram depends more strongly on the adopted time-scale of star formation. At fixed , is larger in models with short time-scales of star formation (large ), which contain a smaller proportion of ultraviolet-bright stars than models with extended star formation. In this range, increases at late ages because of the contribution to dust heating by the optical radiation from old stars (Section 4). We note that models with small ‘returning’ at late ages to the mean IRX-UV relation for starburst galaxies are considerably fainter than starburst galaxies and have intrinsically red optical spectra.
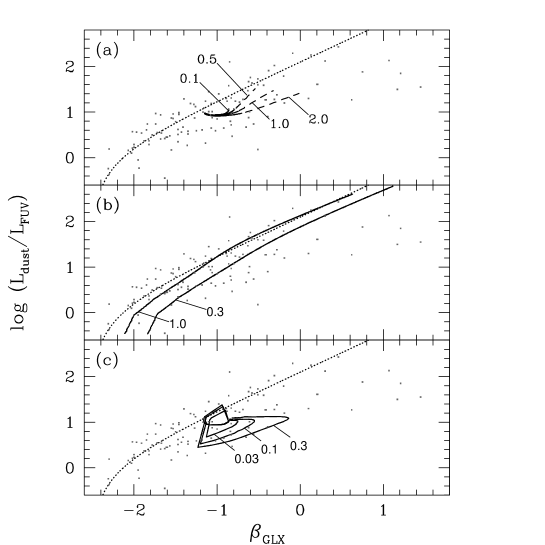
The similarity for between models with different in the IRX-UV diagram prompts us to plot, in Fig. 3b, as a function of for sequences of models with different dust content (i.e. different ), for two ratios of present to past-averaged star formation rates, and 0.3. For simplicity, we assume that the fraction of the total effective absorption optical depth contributed by the ambient ISM is fixed at the standard value in all models. The striking result of Fig. 3b is that the model sequences with constant are remarkably parallel to the mean IRX-UV relation for starburst galaxies, the sequence being offset toward the region of the diagram populated by quiescent star-forming galaxies. This is consistent with the observational evidence from Figs 2a and b that, while dust content is the primary driver of the IRX-UV relation, the broadening of the relation for quiescent star-forming galaxies is most likely driven by star formation history. This result does not depend on the specific combination of and used to compute models with in Fig. 3b. We find that, for , sequences of models with different dust content are also parallel to the mean IRX-UV relation for starburst galaxies. However, as expected from Fig. 3a, the location of the sequences in this range depends sensitively on the choices of and (see also Section 4).
Figs 3a and b suggest that models with simple continuous star formation histories cannot easily reproduce the observations of galaxies lying at the largest perpendicular distances from the mean starburst IRX-UV relation in our sample, unless very short time-scales of star formation () and very small ratios of present to past-averaged star formation rates () are invoked. Such parameters are not typical of quiescent star-forming galaxies. In Fig. 3c, we show as a function of for models with a star formation time-scale parameter , more typical of a spiral galaxy, which undergo an extra burst of star formation of duration yr at the age of 6 Gyr, for and . We show the time evolution of these models for bursts representing 3, 10 and 30 per cent of the total mass of stars formed by the continuous model over 13.5 Gyr. When the burst starts, each model first joins the mean IRX-UV relation for starburst galaxies. Shortly after the burst ends, and hence drop rapidly because of the dispersal of the (optically thick) birth clouds of the last stars formed during the burst. Then, and increase again as the ultraviolet light from these stars fades and reddens. A maximum in is reached about 0.5–1 Gyr after the burst ended. The subsequent evolution toward smaller , as the underlying continuous star formation again starts to dominate the production of the ultraviolet light, is remarkable for two reasons. First, it is very slow, implying that the models spend several gigayears in the region of the diagram populated by galaxies far away from the mean starburst IRX-UV relation. Second, the parameter is only slightly lower than that of the undisturbed continuous model and hence typical of quiescent star-forming galaxies (note that this conserves the trend of decreasing with increasing distance from the mean starburst relation). Thus, models including minor bursts of star formation on top of continuous star formation histories can account in a natural way for the observations of galaxies at large distances from the mean starburst relation in the IRX-UV diagram.
The simple model described above provides a natural framework for understanding the physical origin of the IRX-UV diagram. As shown in Fig. 3, this model can account for the observational evidence from Section 2 that, while dust content is the primary driver of the IRX-UV relation for starburst galaxies, the broadening of the relation for quiescent star-forming galaxies is most likely driven by star formation history, and in particular the parameter. These results do not depend sensitively on the population synthesis code used for computing the production of starlight in the model. We have checked that adopting the PÉGASE population synthesis code (Fioc & Rocca-Volmerange 1997; version 2.0) instead of the Bruzual & Charlot (2003) code has a negligible influence on the results of Fig. 3.
It is worth noting that other effects, such as anisotropic emission from galaxies and spatial distribution of the dust, can potentially affect the positions of galaxies in the IRX-UV diagram. The inclination angles available for 59 quiescent star-forming galaxies observed with IUE+SDSS, ANS and OAO in our sample span the full range from 0 to 90 degrees and do not exhibit any specific trend with perpendicular distance from the mean IRX-UV starburst relation. Therefore, we do not expect orientation effects to play a major role in the broadening of the IRX-UV relation for these galaxies. Charlot & Fall (2000) show that, for some combinations of optical properties and spatial distributions of the dust in their model, it is possible to produce ratios lower than observed for starburst galaxies at large ultraviolet spectral slopes. However, the results in their figures 6 and 13 indicate that such models could not account for the low ratios of quiescent star-forming galaxies with small in our sample.333Witt & Gordon (2000) also explore the influence of the optical properties and spatial distribution of the dust on the IRX-UV relation using a code of radiative transfer with spherical symmetry. None of the models they investigate produces ratios lower than observed for starburst galaxies at fixed ultraviolet spectral slope (see their figure 12, mislabeled figure 13 in the print version). Changes in the spatial distribution of the dust also do not provide a natural explanation for the strong drop in H equivalent width with increasing distance from the mean starburst IRX-UV relation in Fig. 2b (see figure 6c of Charlot & Fall 2000). We conclude that, although orientation and dust geometry may have minor effects on the positions of galaxies in the IRX-UV diagram, they do not seem responsible for the overall broadening of the IRX-UV relation for quiescent star-forming galaxies in our sample. This broadening can be most simply understood as a sequence in the star formation histories of the galaxies.
4 Constraints on the ultraviolet attenuation
The results presented in the previous sections have important implications for estimates of the ultraviolet attenuation and hence of star formation rates in galaxies. Meurer et al. (1999) derive simple formulae for estimating from either the ultraviolet spectral slope or the ratio of far-infrared to ultraviolet luminosities on the basis of the tight IRX-UV relation for starburst galaxies. The results of Sections 2 and 3 above suggest that these formulae cannot be straightforwardly applied to more quiescent galaxies. We can use the model described in Section 3 to estimate the accuracy to which can be constrained in galaxies of different types. A way to assess this is to investigate the relations between , and for a library of models encompassing a wide range of physically plausible star formation histories and dust contents. We thus generate a library of Monte Carlo realizations of different star formation histories similar to that used by Kauffmann et al. (2003) to interpret the D and H index strengths of a complete sample of over SDSS galaxies.
The main requirement for the model library is to include broad enough ranges of star formation histories and dust contents to ensure a wide coverage of the IRX-UV diagram. We have checked that the results presented below do not depend sensitively on the detailed parametrization of the models. For simplicity, we follow Kauffmann et al. (2003) and parametrize each star formation history in terms of two components: an underlying continuous model with a star formation law given by equation (4), and random bursts superimposed on this continuous model.444Specifically, we take the galaxy age to be distributed uniformly over the interval from 1.5 to 13.5 Gyr and the star formation time-scale parameter over the interval from 0 to 1 Gyr-1. Random bursts occur with equal probability at all times until . They are parametrized in terms of the ratio between the mass of stars formed in the burst and the total mass of stars formed by the continuous model over the time . The ratio is taken to be distributed logarithmically from 0.03 to 4.0. During a burst, stars form at a constant rate for a time distributed uniformly in the range – years. The burst probability is set so that 50 per cent of the galaxies in the library have experienced a burst in the past 2 Gyr (see Kauffmann et al. 2003). For the purpose of the present analysis, we retain only models with ratios of present to past-averaged star formation rates larger than 0.03. For the attenuation by dust, we adopt a broad distribution of with a peak around 1.5 and a broad distribution in with a peak around 0.3. This is consistent with the dust properties derived from the H/H ratios and broad-band optical magnitudes of the above sample of SDSS galaxies (Brinchmann et al. 2003; Kauffmann et al. 2003). We distribute our models logarithmically in metallicity from 0.1 to 2 times solar. Our final library consists of 95,000 different models.
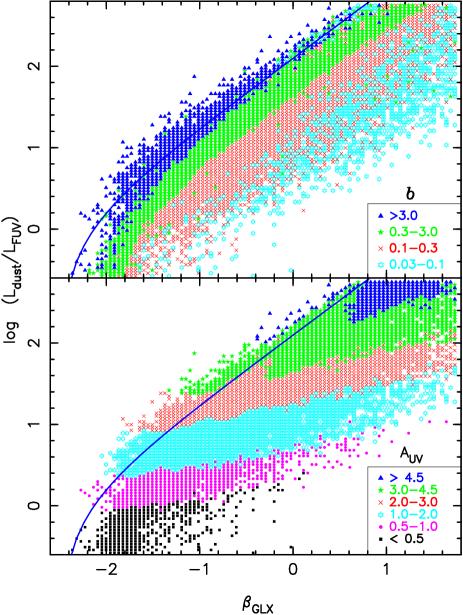
Fig. 4 shows as a function of for these models. In the upper panel, we have divided the IRX-UV plane into bins and coded each bin with a different colour to reflect the average ratio of present to past-averaged star formation rates of the simulated galaxies that fall into it. As found in Section 3 above, sequences of galaxies with different dust contents corresponding to different lie parallel to the mean IRX-UV relation for starburst galaxies. In the lower panel of Fig. 4, we have coded each bin in the IRX-UV plane with a different colour to reflect the average ultraviolet attenuation for the galaxies that fall into it. It is remarkable that sequences of models with different star formation histories corresponding to different are nearly perpendicular to the -axis in this diagram. This implies that is a much better estimator of than in galaxies with different star formation histories.
To quantify the accuracy to which can be estimated from either or , we have explored functional fits of in terms of these parameters using the models in our library. We find that the dependence of on is well approximated by two linear relations with a change in slope at some characteristic turn-around point (corresponding to ). This can be represented by an expression of the form
| (7) | |||||
| (8) |
where and (the slope of the relation at small ), (the slope of the relation at large ), (the normalization constant), (the turn-around point) and (the smoothness of turn-around) are fitted parameters. The accuracy of the estimates obtained from this formula depends on whether or not independent information is available on the ratio of present to past-averaged star formation rates. If no information is available on , equation (8) with , , , and provides estimates of with a typical (i.e. rms) relative uncertainty of 20 per cent for all the models in the library.
| Range in | Range in | ||||||
|---|---|---|---|---|---|---|---|
| 0.27 | 2.02 | 1.01 | 0.69 | 0.91 | 0.15 | ||
| 0.34 | 2.07 | 0.90 | 0.44 | 0.62 | 0.10 | ||
| 0.35 | 2.24 | 0.92 | 0.36 | 0.60 | 0.06 | ||
| 0.39 | 2.37 | 0.96 | 0.34 | 0.59 | 0.09 | ||
| Full range | Full range | 0.39 | 1.86 | 0.75 | 0.26 | 0.42 | 0.19 |
More accurate estimates of can be obtained when even rough information is available on . This is illustrated in Table 1, in which we list the parameters of the fits and the accuracy of the estimates obtained from equation (8) for different ranges in . For reference, we also indicate the corresponding ranges in ‘specific star formation rate’ (i.e. the current star formation rate per unit stellar mass), a quantity more loosely connected to the star formation history but easier to constrain observationally. The typical relative uncertainty in the estimates decreases from 15 per cent for the most quiescent galaxies () to only 7 per cent for starburst galaxies (). The reason for this is that, in starburst galaxies, the heating of the dust and the production of the ultraviolet radiation are dominated by the same stars. Thus is intimately related to . In quiescent galaxies, is affected by dust heating by the optical radiation from old stars with little ultraviolet emission, which depends on the history of star formation at fixed . For reference, the contribution to dust heating by stars older than 0.3 Gyr ranges from typically less than 10 per cent for to about 80 per cent for in the models of Fig. 4. This is the reason why, when using the fitting formulae derived from Table 1, the same is obtained for larger when is lower. A similar result was noted by Buat et al. (1999) in their analysis of a far-infrared selected sample of nearby star-forming galaxies. We conclude that, if rough constraints are available on the ratio of present to past-averaged star formation rates, reliable estimates of can be derived from . We note that, for the models in our library, can be roughly estimated from D as
| (9) |
with a dispersion of about 0.3 at fixed D. The corresponding dependence of the specific star formation rate on D is in excellent agreement with that found by Brinchmann et al. (2003) for the sample of SDSS galaxies mentioned above.
In some cases, the far-infrared luminosity may not be available to estimate (for example, for high-redshift galaxies for which only the rest-frame ultraviolet emission can be observed). In such cases, it is important to know the accuracy to which can be estimated based solely on the ultraviolet spectral slope. The wide range in spanned by models with fixed in Fig. 4 indicates that is not a precise estimator of in galaxies with different star formation histories. This is consistent with the results of Bell (2002). In fact, we did not succeed in finding a function of that provided reasonably accurate estimates of for the models in our library. Significant improvement is obtained when including the ratio of present to past-averaged star formation rates as a variable of the fit. In particular, we find that the dependence of on and is reasonably well approximated by
| (10) |
This formula provides estimates of for which the accuracy is an increasing function of . For (corresponding roughly to types later than Sb), the typical (i.e. rms) absolute uncertainty in the estimates is only 0.32. For lower , the uncertainty is about one magnitude. The reason for the large uncertainty in at low is that, in galaxies with little current star formation, the ultraviolet spectral slope depends strongly on both dust and the history of star formation. We note that, for , the expression of given in equation (10) is similar to the non--dependent expression for as a function of ultraviolet spectral slope derived by Meurer et al. (1999, their equation 11) from the analysis of an ultraviolet-selected sample of nearby starburst galaxies. In the absence of far-infrared observations, therefore, can still be reasonably well estimated from the ultraviolet spectral slope alone, provided that some constraints are available on the ratio of present to past-averaged star formation rates.
5 Summary and conclusion
We have compiled a sample of 115 nearby, non-Seyfert galaxies drawn from ultraviolet surveys spanning a wide range of star formation activities, from starburst to nearly dormant. Based on this sample, we showed that, at fixed ultraviolet spectral slope (), normal star-forming galaxies have systematically lower ratio of total far-infrared to ultraviolet luminosities () than starburst galaxies. The tightness of the correlation between and , shown by Meurer et al. (1999) to provide valuable constraints on the ultraviolet attenuation in starburst galaxies, does not extend therefore to normal, more quiescent star-forming galaxies. We showed that, for the galaxies in our sample, the strengths of the age-sensitive 4000 Å spectral discontinuity and H emission equivalent width correlate well with distance from the mean relation for starburst galaxies in the IRX-UV diagram, while there is little or no correlation between the dust-sensitive H/H ratio and this distance. This is strong observational evidence that, while dust content is the primary driver of the IRX-UV relation for starburst galaxies, the broadening of the relation for quiescent star-forming galaxies is most likely driven by star formation history.
We have used the simple but physically realistic attenuation model of Charlot & Fall (2000), in combination with the new Bruzual & Charlot (2003) population synthesis code, to investigate the physical origin of the IRX-UV relation for galaxies with different star formation histories. We confirm that, for starburst galaxies, the tight IRX-UV relation can be understood most simply as a sequence in overall dust content. In addition, within the framework of this model, the second dimension of the IRX-UV relation can be understood most simply as a sequence in the ratio of present to past-averaged star formation rates.
The dependence of the IRX-UV relation on both star formation history and dust content implies that the ultraviolet attenuation cannot be derived from and as straightforwardly as expected from the analysis of starburst galaxies alone. We have used a library of Monte Carlo realizations of galaxies with different star formation histories and dust contents to quantify the accuracy to which can be estimated from either or . We find that is a better estimator of than in galaxies with different star formation histories. We provide simple formulae for estimating as a function of either or and show that the accuracy of these estimates can be significantly improved if some constraints are available on the ratio of present to past-averaged star formation rates (for example, based on the observed 4000 Å discontinuity). The IRX-UV diagram, therefore, is a valuable diagnostic of the attenuation by dust and hence the star formation rates of galaxies in a wide range of star formation activities. This is especially important for applications to studies of high-redshift galaxies, for which the rest-frame optical and infrared emission cannot be observed at present.
Acknowledgments
X.K., S.C. and J.B. thank the Alexander von Humboldt Foundation, the Federal Ministry of Education and Research, and the Programme for Investment in the Future (ZIP) of the German Government for financial support. We are grateful to the referee, Eric Bell, for helpful comments. This work made use of the HyperLeda astronomy information system (http://leda.univ-lyon1.fr/).
References
- Abazajian et al. (2003) Abazajian, K., et al., 2003, AJ, 126, 2081
- Balogh et al. (1999) Balogh, M.L., Morris, S.L., Yee, H.K.C., Carlberg, R.G., Ellingson, E., 1999, ApJ, 527, 54
- Bell (2002) Bell, E.F., 2002, ApJ, 577, 150
- Brinchmann et al. (2003) Brinchmann, J., Charlot, S., White, S.D.M., Tremonti, C., Kauffmann, G., Heckman, T., Brinkmann, J., 2003, MNRAS, submitted (astro-ph/0311060)
- Bruzual & Charlot (2003) Bruzual A., G., Charlot, S., 2000, MNRAS, 344, 1000
- Buat et al. (1999) Buat, V., Donas, J., Milliard, B., Xu, C., 1999, A&A, 352, 371
- Calzetti et al. (1994) Calzetti, D., Kinney, A.L., Storchi-Bergmann, T., 1994, ApJ, 429, 582
- Calzetti et al. (2000) Calzetti, D., Armus, L., Bohlin, R.C., Kinney, A.L., Koornneef, J., Storchi-Bergmann, T., 2000, ApJ, 533, 682
- Cardelli et al. (1989) Cardelli, J.A., Clayton, G.C., Mathis, J.S., 1989, ApJ, 345, 245
- Charlot & Fall (2000) Charlot, S., Fall, S. M., 2000, ApJ, 539, 718
- Charlot et al. (2002) Charlot, S., Kauffmann, G., Longhetti, M., Tresse, L., White, S. D. M., Maddox, S. J., Fall, S. M., 2002, MNRAS, 330, 876
- Dale & Helou (2002) Dale, D.A., Helou, G., 2002, ApJ, 576, 159
- Goldader et al. (2002) Goldader, J.D., Meurer, G., Heckman, T.M., Seibert, M., Sanders, D.B.; Calzetti, D., Steidel, C.C., 2002, ApJ, 568, 651
- Fioc & Rocca-Volmerange (1997) Fioc, M., Rocca-Volmerange, B., 1997, A&A, 326, 950
- Helou (1986) Helou, G., 1986, ApJ, 311, L33
- Helou et al. (1988) Helou, G., Khan, I.R., Malek, L., Boehmer, L., 1988, ApJS, 68, 151
- Kauffmann et al. (2003) Kauffmann, G. et al., 2003, MNRAS, 341, 33
- Kennicutt (1983) Kennicutt, R.C., 1983, ApJ, 272, 54
- Kennicutt (1992) Kennicutt, R.C., 1992, ApJS, 79, 255
- Kennicutt et al. (1994) Kennicutt, R.C., Tamblyn, P., Congdon, C.E., 1994, ApJ, 435, 22
- Kinney et al. (1991) Kinney, A.L., Bohlin, R.C., Blades, J.C., York, D.G., 1991, ApJS, 75, 645
- Kong & Cheng (2002) Kong, X., Cheng, F.Z., 2002, A&A, 389, 845
- Martin et al. (2003) Martin, C. et al., 2003, SPIE, 4854, 336
- McQuade et al. (1995) McQuade, K., Calzetti, D., Kinney, A.L., 1995, ApJS, 97, 331
- Meurer et al. (1995) Meurer, G.R., Heckman, T.M., Leitherer, C., Kinney, A., Robert, C., Garnett, D.R., 1995, AJ, 110, 2665
- Meurer et al. (1999) Meurer, G.R., Heckman, T.M., Calzetti, D., 1999, ApJ, 521, 64
- Rifatto et al. (1995a) Rifatto, A., Longo, G., Capaccioli, M., 1995a, A&AS, 109, 341
- Rifatto et al. (1995b) Rifatto, A., Longo, G., Capaccioli, M., 1995b, A&AS, 114, 527
- Schlegel et al. (1998) Schlegel, D., Finkbeiner, D., Davis, M., 1998, ApJ, 500, 525
- Storchi-Bergmann et al. (1995) Storchi-Bergmann, T., Kinney, A.L., Challis, P. 1995, ApJS, 98, 103
- Witt & Gordon (2000) Witt, A.N., Gordon, K.D. 2000, ApJ, 528, 799
Appendix A Calibration of ultraviolet spectral slopes and fluxes
Here, we use the sample of 110 high-signal-to-noise IUE galaxies with both far- and near-ultraviolet spectra compiled in Section 2.1 to calibrate the conversions between (equation 1) and the ultraviolet spectral slopes estimated from observations with different satellites. The minimum signal-to-noise ratio per pixel555This is the average signal-to-noise ratio per pixel in 100 Å-wide continuum windows free of emission features centred at rest wavelengths 1450, 1700, 2300 and 2700 Å (Kinney et al. 1991). of 3 required for this sample ensures that can be measured to an accuracy of better than 0.3. For reference, the median error in for the 110 galaxies in our sample is around 0.08.
We compute the ultraviolet spectral slopes using various definitions and compare the results to . We first consider the ultraviolet spectral slope from the definition of Calzetti, Kinney & Storchi-Bergmann (1994), which we denote by . This is obtained from a power-law fit of the form (where is the flux per unit wavelength) to the spectrum in ten continuum bands that avoid strong stellar and interstellar absorption features (in particular, the 2175 Å dust feature) in the range Å. We also consider the ultraviolet slopes derived from photometric observations with ANS, OAO and UIT. We compute the corresponding , and from continuum fits of the form to the broadband spectra obtained by convolving the IUE spectra with the filter response functions of these satellites (Table 2).
| Satellite | (Å) | FWHM (Å) |
|---|---|---|
| GALEX (FUV) | 1520 | 264 |
| GALEX (NUV) | 2310 | 795 |
| ANS (1) | 1550 | 149 |
| ANS (2) | 1950 | 149 |
| ANS (3) | 2200 | 200 |
| ANS (4) | 2500 | 150 |
| OAO (1) | 1550 | 240 |
| OAO (2) | 1910 | 260 |
| OAO (3) | 2460 | 380 |
| UIT (B1) | 1521 | 354 |
| UIT (A1) | 2488 | 1147 |

Fig. 5 shows , , and and as a function of for this sample. It can be seen that , and correlate extremely well with . The correlation is worse for , mainly because of the wider wavelength range of the near-ultraviolet filter of UIT, which extends redward to about 3060 Å (Table 2). The mean linear relations between the ultraviolet slopes obtained from observations with different satellites and the reference ultraviolet slope are drawn as solid lines in Fig. 5 and are indicated at the bottom of each panel along with the 1 standard deviation. The tight correlations in Figs. 1(a)–1(c) allow us to estimate reliably from and . Since the relation is significantly worse for , we do not use UIT data in the analysis described in the main text of the paper.
The ultraviolet spectral slope can also be estimated reliably for galaxies with only far-ultraviolet IUE spectra. The reason for this is that the wavelength range of the far-ultraviolet spectrograph on-board IUE encompasses 9 out of the 10 spectral windows originally used by Calzetti et al. (1994) to define . In fact, for the 110 galaxies in the sample considered here, we find that the ultraviolet slope obtained by fitting a power law to the far-ultraviolet spectra in these 9 continuum bands correlates with as tightly as do and . The mean linear relation is
| (11) |
with a standard deviation .
We also adopt a common definition of the ultraviolet flux for galaxies observed with different satellites, . For those galaxies with IUE spectra, we compute the mean ultraviolet flux density using the response function of the GALEX far-ultraviolet filter (Å). For those galaxies observed with OAO and ANS, we compute by extrapolating the broadband spectrum from 1550 Å (corresponding to the effective wavelength of the far-ultraviolet filters on-board both satellites) to 1520 Å, using the ultraviolet slope ( or ) measured for each galaxy. Given the narrow wavelength range over which the extrapolation is performed, this procedure does not introduce any significant uncertainties in and hence .