Three Lyman- Emitters at : Early GMOS/Gemini Data from the GLARE Project
Abstract
We report spectroscopic detection of three Lyman- emitting galaxies, in the vicinity of the Hubble Ultra Deep Field, from the early data of the Gemini Lyman- at Reionisation Era (GLARE) project. Two objects, GLARE#3001 () and GLARE#3011 (), are new detections and are fainter in ( and ) than any Lyman break galaxy previously detected in Lyman-. A third object, GLARE#1042 () has previously been detected in line emission from the ground; we report here a new spectroscopic continuum detection. Gemini/GMOS-S spectra of these objects, obtained using nod & shuffle, are presented together with a discussion of their photometric properties. All three objects were selected for spectroscopy via the -drop Lyman Break technique, the two new detections from the GOODS v1.0 imaging data. The red colors and high equivalent widths of these objects suggest a high-confidence Lyman- identification of the emission lines. This brings the total number of known galaxies within 9′ of the Hubble Ultra Deep Field to four, of which three are at the same redshift ( within 2000 km s-1), suggesting the existence of a large-scale structure at this redshift.
Subject headings:
galaxies: evolution – galaxies: formation – galaxies: staburst – galaxies: individual: SBM03#1, SiD002 – galaxies: high redshift – ultraviolet: galaxies1. Introduction
The detection and analysis of objects at very high redshift is a challenging but rapidly advancing field. In recent months increasing numbers of galaxies have been found at redshifts of , as a result both of narrow-band selection (e.g. Rhoads et al. 2003, Taniguchi et al. 2003, Hu et al. 2003) and the use of Lyman break methods (e.g. Dickinson et al. 2003, Stanway, Bunker & McMahon 2003 hereafter SBM03). However, until now, spectroscopic confirmation of very high redshift candidates has only been possible for objects at the bright end of the galaxy luminosity function.
Spectroscopic surveys for fainter objects are essential to shape our understanding of the universe at these redshifts and, with modern instrumentation and new techniques for faint-object spectroscopy, such surveys are now possible. The Gemini Lyman- at Reionisation Era (GLARE) survey, described in this paper, aims to obtain extremely deep spectra of very faint high redshift starforming galaxies, selected via color from the HST/ACS Ultra Deep Field (UDF, Beckwith et al. 2003) and Great Observatories Origins Deep Survey (GOODS, Giavalisco et al. 2003) data, using the GMOS spectrograph on Gemini South.
In this Letter we present spectra and fluxes111We adopt the following cosmology: a flat Universe with , and . All magnitudes are quoted in the AB system (Oke & Gunn 1983). of three Lyman- emitters, two of which are new, identified in the early observation data of the GLARE project.
2. Gemini GMOS Observations
The spectra described in this paper were obtained as part of the Gemini South program GS–2003B-Q-7 using the Gemini Multi-Object Spectrograph (GMOS, Hook et al. 2003) targeting sources in the region of the Hubble UDF (Beckwith et al., 2003).
The goal of program GS–2003B-Q-7 was to obtain a total of 100 hours exposure on this UDF mask. This letter concerns the first 7.5 hours of data. Observations were made with the R150 grating at 9000Å central wavelength and a custom made 7800Å longpass filter (‘RG780’) giving a spectral range from 7800Å up to the CCD cutoff (about 10,000Å) and a spectroscopic resolution of 15Å (4 pixels FWHM at 3.5 Å/pix) with 07 wide slits, a resolving power of . As the seeing disk (5 FWHM) was smaller than the slit width (07), the true resolution is somewhat better for a source which does not fill the slit.
The data was taken using the ‘nod & shuffle’ (N&S) observing mode (Cuillandre et al. 1994, Glazebrook & Bland-Hawthorne 2001, Abraham et al. 2004 - hereafter GDDS1). Our N&S setup and observational scheme follows that in GDDS1 except that the slits were 25 long with a 15 nod. Data reduction also follows GDDS1 (Appendix B and C). Fifteen 1800 s frames were obtained in queue observing during November 2003 (19th, 24th, 28th and 30th) during conditions of 0.4–0.5 arcsec seeing and high transparency. Relative flux calibration was performed using observations of a standard star, the absolute flux calibration was done by normalizing the spectra of the mask alignment stars to their -band photometric fluxes. Sky lines were used for wavelength calibration.
1D and 2D sky-subtracted spectra were inspected for the presence of emission lines. An advantage of the N&S data reduction technique is that lines appear in a positive-negative dipole pattern in the 2D images making them easy to distinguish from residual CCD defects and other non-astrophysical effects.
3. HST/ACS Photometry and Candidate Selection
Spectroscopic candidates for this program were selected using the -drop Lyman break technique (see SBM03 or Dickinson et al. 2003). This photometric selection method has been used by a number of authors to identify galaxies (e.g. Bremer et al. 2004, Lehnert & Bremer 2003 at , Dickinson et al. 2003, SBM03 at ). In each of these surveys the Lyman break spectral feature is detected by means of a colour-cut criterion. At the lyman break passes through the filter and hence a cut is usually placed in the range with the exact value affecting the survey redshift range and low redshift contamination.
Within the UDF itself, 19 candidates were drawn from the catalogue of the reddest () objects, pre-released by the UDF team222http://www.stsci.edu/hst/udf/ in order to facilitate ground-based spectroscopic follow up and satisfy . The 5.5′ GMOS field is bigger than the UDF, so in the outlying region we selected objects from the GOODS-S field. The GOODS v1.0 data release333available from ftp://archive.stsci.edu/pub/hlsp/goods/v1/ comprises coadded imaging from 5 ‘epochs’ of observations, reaching magnitude limits , and . We selected candidates using and mag and identified 18 objects in the slitmask area of which 10 were placed on the mask. The faint end of this selection reaches the magnitude limit in the -band. The rest of the mask area was used for a blank sky survey. Of the objects presented in this paper #1042 was identified as a candidate in both catalogs, while #3001 and #3011 lie outside the UDF field and were selected from the GOODS v1.0 data.
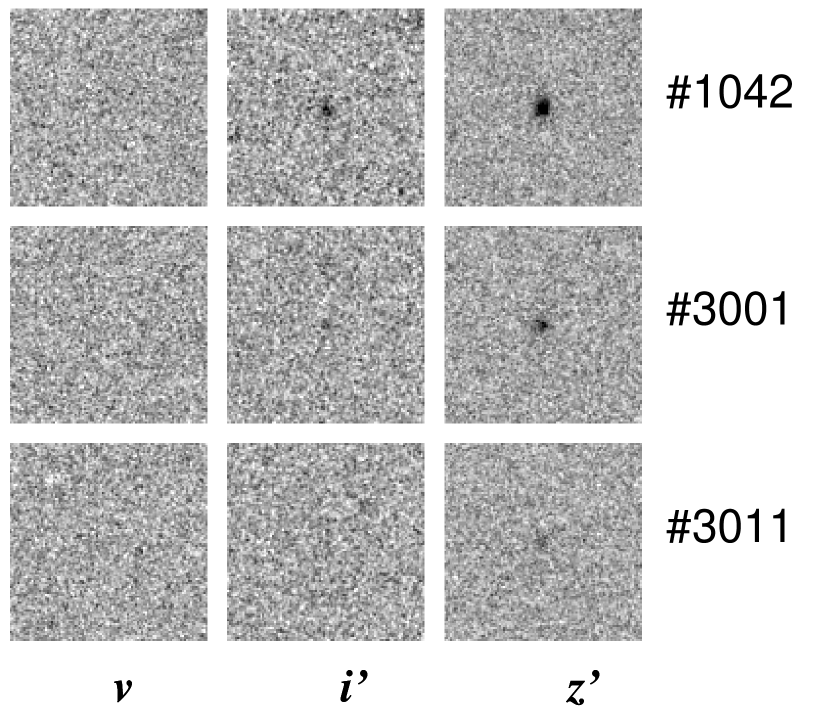
Table 1 presents the broadband photometric properties of these objects. Magnitudes are measured in a 03 diameter aperture and an aperture correction of -0.32mag (measured from point sources on the images) is applied to obtain a total magnitude for these compact sources. Postage stamp images in the , and bands are shown in figure 1. Since #1042 lies within the UDF more accurate photometry and morphological information should soon be available for this object. All three objects are spatially resolved with half-light radii in the range 009-014 (cf. stellar value of 005), well detected in the band, faintly detected (or in the case of #3011 undetected at ) in and undetected at 3 in the band.
4. Results
Single isolated emission lines have been identified for each of three objects. GLARE#1042 (J2000 3h32m400 27°48′150), is an -drop initially selected by SBM03 and already confirmed as a z=5.83 Lyman- emitter (Stanway et al. 2003, Dickinson et al. 2003). GLARE#3001 (3h32m460 27°49′297) and #3011 (3h32m432 27°45′176) are new. Their properties are given in table 1. All three lines are almost unresolved given our dispersion, although #1042 is known to be highly asymmetric from published spectra (Stanway et al. 2003, Dickinson et al. 2003).
We also detect the continuum break in the spectrum of GLARE#1042 although at low signal-to-noise (Flux density ergs cm-2 s-1 Å-1). This is consistent with the level of continuum reported in the low-resolution ACS slitless spectrum of Dickinson et al. and also with the broadband colours of this object. A good continuum spectrum of this object should be obtained if GLARE does achieve a 100 hour total exposure. The spectra of the candidates are shown in figure 2.
| ID # | Peak | Flux(1) | Flux(2) | FWHM | Rh | SFRUV | |||
|---|---|---|---|---|---|---|---|---|---|
| Å | ergs cm-2 s-1 | ergs cm-2 s-1 | Å | () | |||||
| 1042 | 5.83 | 8309.1 | 16.3 | 25.48 0.03 | 1.48 0.09 | 009 | 15 | ||
| 3001 | 5.79 | 8252.7 | 20.5 | 26.37 0.06 | 1.66 0.20 | 014 | 6.0 | ||
| 3011 | 5.94 | 8434.0 | 24.5 | 27.15 0.12 | 013 | 1.7 |
Note. — The spectroscopic and photometric properties of the three emission line candidates. Wavelengths are measured in air. Error on the fluxes due to slit losses and photon noise is . Flux(1) is taken between zero power points, Flux(2) by fitting a gaussian line profile to the data. The FWHM of this fit is shown in the sixth column (spectral resolution Å). All objects are undetected at 3 in () and also resolved in the band (stellar half-light radius Rh=005). Star Formation Rates are calculated using the UV Flux-SFR relation of Madau, Pozzetti & Dickinson (1998) having removed line contamination (and assuming ).


5. Interpretation
5.1. The Redshifts of GLARE#1042, #3001 and #3011
The most plausible line identifications given the red selection are Lyman- at , and for #1042, #3001 and #3011 respectively. H 4861.3 Å or [O III] 5006.8,4958.9 Å at or H 6562.8 Å at are ruled out be the absence of nearby lines and because galaxies at these redshifts do not have strong continuum breaks.
An unresolved [O II] 3726.1,3728.9 Å doublet at redshifts is a possibility for #3001 and #3011 (#1042 is already known to be strongly asymmetric ruling this out, Stanway et al. 2003). The best evidence against this is the red color. The reddest possible color from an early-type SED at is (SBM03) and our two new objects are redder than this at 95% confidence. An [O II] identification would also imply rest-frame equivalent widths of 50–250Å (see Section 5.2) higher than is normally seen in [O II] emitters (Hammer et al. 1997).
5.2. Equivalent Widths
The emission line equivalent widths can be calculated from their band photometry and line fluxes. However, a subtlety arises as the emission lines for these objects contribute significantly to their continuum flux in both the and filters; the calculated equivalent widths are sensitive to the detailed shape of the filter transmission curve. Accounting for these effects, we calculate equivalent widths Å for [#1042, #3001, #3011] respectively, assuming that there is negligible flux short-ward of the Lyman- line due to absorption by the Lyman- forest. From stellar synthesis models of star-forming regions (e.g., Charlot & Fall 1993), the theoretical Lyman- equivalent width for a young region of active star formation is Å. However, observed Lyman- emission from star-forming galaxies is generally weaker in continuum-selected samples at lower redshifts, which typically have Å (e.g., Steidel et al. 1996), or even in absorption. Our sample has a comparable selection but the equivalent widths of #3011 is notably larger. We note that narrow-band selected samples also produce higher equivalent widths with a median of 200Å (Malhotra & Rhoads 2002, Hu et al. 2003).
5.3. AGN or Starburst?
Careful inspection of the spectra reveal no other lines. The only other significant line in our range is the high-ionization rest-UV N V Å, which is usually prominent in active galactic nuclei (AGN). Our flux limits at Å are (), for a 15Å FWHM (unresolved) line. This gives lower limits of (). Typical line ratios from composite QSO spectra are (Osterbrock 1989). Although our constraints are admittedly weak, the non-detection of N V 1240 Å favours the interpretation that the Lyman- arises from the Lyman continuum flux produced by OB stars, rather than the harder UV spectrum of a QSO.
None of the objects in this paper correspond to X-ray sources in the Chandra Deep Field South 1Ms catalog which covers this region (Giacconi et al. 2003). This allows us to place a limit on their X-ray fluxes in the keV (soft) and keV (hard) bands at and ergs cm-2 s-1 respectively. The hard X-ray flux limits rule out a type II QSO like CDF-S 202 (Norman et al 2002) but not CXO-52 (Stern et al. 2002). The soft X-ray limits would permit low-luminosity Seyferts and QSOs (Malhotra et al. 2003), but the line emission we see is not broad.
Given that an AGN interpretation for the observed emission lines is unlikely, the rest frame-UV spectra of these objects is likely to be dominated by star formation. The relation between the flux density in the rest-UV around 1500 Å and the star formation rate ( in ) is given by (Madau, Pozzetti & Dickinson 1998) for a Salpeter (1955) stellar initial mass function (IMF) with . The rest frame-UV at is redshifted into the photometric band. The inferred SFR for the objects in this paper, given their magnitudes, line contamination and identified redshifts, are shown in table 1.
5.4. Overdensity at z=5.8?
The redshift of new Lyman-alpha emitter GLARE#3001 is very similar to that of Lyman-alpha emitter SBM03#3 reported by Bunker et al. (2003), and is also close to that of the re-confirmed object (variously GLARE#1042, SBM03#1, SiD002, reported in this paper, Stanway et al. 2003, Dickinson et al. 2003). The -drop selection procedure used to identify candidate objects for spectroscopy is in principle sensitive to objects in the redshift range although the sharp fall off in transmission of the filter effectively restricts detection of objects to a smaller redshift range which varies with absolute magnitude ( for an Lyman Break galaxy, see SBM03). The line centers of three of the four Lyman- emitters detected in the GOODS-S field are separated by 2000 km s-1 (only % of the survey redshift range). The maximum angular separation of the the three objects (GLARE#1042, #3001, SBM03#3) is less than 11.5 arcmin, corresponding to a projected separation of only Mpc. This suggests the interesting possibility of an overdensity of Lyman- emitters at in this field, perhaps similar to that observed at in SSA22 by Steidel et al. (2001).
To quantify the statistical likelihood of this happening by chance we undertook a Monte-Carlo simulation. A population uniformly distributed in redshift between was considered and the effects of GMOS throughput (including the RG780 filter) and increased noise due to skylines on spectroscopic detection, and IGM absorption leading to incomplete filter coverage on Lyman break photometric selection, were modelled. The effects of an apparent magnitude limit on the photometric selection were also calculated, using the measured luminosity function for Lyman break galaxies at (Steidel et al. 1999) as an approximation for the currently unknown luminosity function. Although each of these effects bias detection probability towards the lower end of the accessible redshift range, the probability of selecting 3 or more out of 4 galaxies within 2000 km s-1 of was still small (). This suggests that we have statistical evidence for a redshift spike at in this field, which augurs well for the future UDF observations.
5.5. Comparison with Previous Work
The spectroscopic properties of the three galaxies presented in this work are similar to those of other confirmed high redshift Lyman break galaxies. Lehnert & Bremer (2003) report Ly- luminosities of ergs s-1 for 6 line emitters in a sample of 12 Lyman break candidates. The fluxes for our Ly- emitters fall comfortably into this range of luminosities and probe to a comparable depth. The emission lines equivalent widths of the GLARE candidates are also comparable to those of other spectroscopically confirmed Lyman break galaxies, e.g. at Å (Bunker et al. 2003) and Å (Cuby et al. 2003).
6. Conclusions
In this paper we have presented photometry and spectra for three objects with extreme colors and line emission which may be Lyman- at , observed as part of the GLARE project. Our main conclusions can be summarized as follows:
1) The GLARE project has detected three very high redshift objects () in the first 7.5 hours of integration time on Gemini/GMOS-S. To the best of our knowledge the two new Lyman- emitters are fainter in than any previous Lyman break selected objects with a spectroscopic redshift.
2) color selection can successfully identify objects lying at these redshifts and magnitudes and the faint end of the galaxy luminosity function at is now within the reach of 8m telescopes.
3) We have evidence for an overdensity of objects in a narrow redshift spike in the GOODS-S field; further observations, for example narrow-band imaging, would be invaluable in confirming the existence of such a structure.
References
- Abraham et al. (2004) Abraham, R. G., et al., 2004, preprint (astro-ph/0402436)[GDDS1]
- Beckwith et al. (2003) Beckwith S. V. W., Somerville R., Stiavelli M., Space Telescope Science Institute Newsletter, vol 20, issue 4, p.1
- Bunker et al. (2003) Bunker, A. J., Stanway, E. R., Ellis, R. S., McMahon, R. G., McCarthy, P. J., 2003, MNRAS, 342, L47
- Bremer et al. (2004) Bremer, M. N., Lehnert, M. D., Waddington, I., Hardcastle, M. J., Boyce, P. J., Phillipps, S., , MNRAS, 347, L7
- Charlot & Fall (1993) Charlot, S., Fall, S. M. 1993, ApJ, 415, 580
- Cuillandre et al. (1994) Cuillandre, J. C. et al., A&A, 281, 603
- Cuby et al. (2003) Cuby, J-G., Le Fèvre, O., McCracken, H., Cuillandre, J.-C., Magnier, E., Meneux, B., A&A, 405, L19
- Dickinson et al. (2003) Dickinson, M. et al, 2003, preprint (astro-ph/0309070)
- Giavalisco et al. (2003) Giavalisco, M. et al., 2003, preprint (astro-ph/0309105)
- Giaconni et al. (2002) Giacconi, R. et al., 2002, ApJS, 139, 369
- Glazebrook et al. (2001) Glazebrook, K. & Bland-Hawthorn, J. 2001. PASP, 113, 197
- Hammer et al. (1997) Hammer, F. et al. 1997, ApJ, 481, 49
- Hook et al. (2003) Hook, I. et al. 2003, Proc. SPIE, 4841, 1645
- Hu et al. (2003) Hu, E. M., Cowie, L. L., Capak, P., McMahon, R. G., Hayashino, T., Komiyawa, Y., 2003, preprint (astro-ph/0311528)
- Lehnert & Bremer (2003) Lehnert, M. D., Bremer, M. N., 2003, ApJ, 593, 630
- Madau, Pozzetti & Dickinson (1998) Madau, P., Pozzetti, L., Dickinson, M., 1998, ApJ, 498, 106
- Malhotra & Rhoads (2002) Malhotra, S. & Rhoads, J. E. 2002, ApJ, 565, L71
- Malhotra et al. (2003) Malhotra, S., Wang, J. X., Rhoads, J. E., Heckman, T. M., & Norman, C. A. 2003, ApJ, 585, L25
- Norman et al. (2002) Norman, C. et al. 2002, ApJ, 571, 218
- Oke & Gunn (1983) Oke, J. B., Gunn, J. E., 1983, ApJ, 266, 713
- Osterbrock (1989) Osterbrock, D. E. 1989, “Astrophysics of Gaseous Nebulæ and Active Galactic Nuclei”, University Science Books
- Rhoads et al. (2003) Rhoads, J. E. et al., AJ, 125, 1006
- Salpeter (1955) Salpeter, E. E., 1955, ApJ, 121, 161
- Stanway, Bunker & McMahon (2003) Stanway, E. R., Bunker, A. J., McMahon, R. G., 2003, MNRAS, 342, 439 [SBM03]
- Stanway et al. (2003) Stanway, E. R., Bunker, A. J., McMahon, R. G., Ellis, R. S., Treu, T., McCarthy, P. J., 2003, preprint (astro-ph/0308124)
- Steidel et al. (1996) Steidel, C. C., Giavalisco, M., Pettini, M., Dickinson, M. E., Adelberger, K. L., 1996, ApJ, 462, L17
- Steidel et al. (1999) Steidel, C. C., Adelberger, K. L., Giavalisco, M., Dickinson, M. E., Pettini, M., 1999, ApJ, 519, 1
- Steidel et al. (2001) Steidel, C. C., Adelberger, K. L., Shapley, A. E., Pettini, M., Dickinson, M., Giavalisco, M., 2001, ApJ, 532, 170
- Stern et al. (2002) Stern, D. et al. 2002, ApJ, 568, 71
- Taniguchi et al. (2003) Taniguchi ,Y., Shioya, Y., Ajiki, M., Fujita, S. S., Nagao, T., Murayama, T., 2003, JKAS, 36, 123