The Off-Axis Galaxy Cluster Merger Abell 115
Abstract
We have used a 50.4 ksec Chandra observation to examine the galaxy cluster Abell 115 (=0.1971). The X-ray surface brightness distribution shows a merger of 2 sub-clusters with substantial off-axis motion. The northern sub-cluster moves toward the southwest and exhibits a strong X-ray surface brightness gradient toward this direction as well as a “fan” of X-ray bright Intra-Cluster Medium (ICM) toward the northeast. The southern sub-cluster shows a pronounced northeast-southwest elongation, probably as a consequence of the ongoing merger. The temperature of the ICM is highly non-uniform across the cluster. Although the merger is well underway and has had a substantial influence on the morphology of the 2 sub-clusters, it has apparently not disturbed the cool sub-cluster cores: the cores show projected temperatures of 3 keV and are substantially cooler than the surrounding plasma of 5 keV. The ICM in between the sub-clusters has a significantly elevated temperature of 8 keV. However, owing to the low surface brightness, we do not find direct evidence for shocks in this region. The X-ray surface brightness distribution of the northern sub-cluster is highly non-uniform. The data show a bright central core region of about 10” (30 kpc) diameter. A highly significant surface brightness discontinuity separates the core from the ambient ICM. We discuss several possibilities to explain the compact core, and its relation to the central radio galaxy 3C 28.0 and the sub-cluster’s cooling flow. Further outwards, at about 24.6” (80 kpc) to the southwest of the sub-cluster core, the surface brightness distribution shows a jump associated with a contact discontinuity. The Chandra imaging spectroscopy data do not show evidence for a shock associated with the surface brightness jump. We conclude that it is associated with denser plasma moving sub-sonically through the ambient plasma.
1 Introduction
Observations of cluster mergers allow us to witness the formation of large, gravitationally bound systems, and thus to study a key aspect of the process of structure formation in our universe. The mergers result in the formation of large virialized systems, and play an important role in the “eco-systems” consisting of dark matter halos, Intra-Cluster Medium (ICM), galaxies, stars, and super massive black holes. Although the relative contributions of cluster mergers, galactic wind shocks, cluster accretion shocks, and outflows from Active Galactic Nuclei (AGN) are still somewhat uncertain, cluster mergers are believed to dominate the heating of the ICM. A detailed study of mergers is therefore essential to explain the galaxy and star formation efficiency in galaxy clusters, and to account for 80% of the baryonic cluster mass residing between galaxies rather than inside galaxies. A comprehensive summary of the astrophysics of cluster merger has recently been given by Sarazin (2002).
There are three main observational channels to study cluster mergers: (1) Optical spectroscopy gives the location and line of sight velocities of member galaxies; (2) X-ray observations can be used to determine the temperature, density, and chemical composition of the hot ICM that fills the space between galaxies; (3) gravitational lensing observations yield constraints about the dark matter distribution, complementary to those inferred from X-ray observations. The Chandra and XMM-Newton X-ray telescopes can measure the spatial variation of the ICM temperature, density and chemical composition. With its unprecedented angular resolution of 0.5”, Chandra images have revealed clear evidence for shocks and Mach cones Markevitch et al. (2002); Kempner et al. (2004), as well as for plasma discontinuities not associated with shocks, so-called cold-fronts Markevitch et al. (2000). The ICM shock heating has thus become directly observationally accessible.
Besides cluster merger, another topic which we will discuss is the interaction of AGN with the ICM. In more relaxed clusters, rapid radiative cooling of the ICM near the cluster cores should result in “cooling flows” of the ICM toward the centers of the clusters Fabian (1994). At the cluster centers cooled ICM should either form cold clouds or undergo gravitational collapse and form stars. While the non-detection of such cold clouds or avid star formation had been a long-standing inconsistency of the cooling flow picture, the Chandra and XMM-Newton non-detections of cold ICM ( 1.5 keV) at the centers of cooling flow clusters (e.g. Peterson et al. 2003) has recently stirred considerable debate (see Donahue & Voit 2003 and references therein). Various authors proposed that bubbles of radio plasma ejected by AGN at the cluster centers might counteract the ICM cooling Böhringer et al. (2002); Churazov et al. (2002). The first bubbles were detected with ROSAT in the Perseus cluster Böhringer et al. (1993) and in Cygnus A Carilli et al. (1994). Chandra observations have revealed radio bubbles in a large number of clusters (Blanton, 2003, Birzan, 2004 and references therein). Detailed images of bubbles in the Perseus Fabian et al. (2003) and Virgo Forman et al. (2004) clusters show very complex surface brightness distributions with evidence for contact discontinuities, shocks, and even sound waves. During the early phase of bubble formation, supersonic inflation of the bubble may produce a bow shock which heats the ICM (see e.g. Ruzkowski et al 2004). If the ICM is sufficiently viscous, bubbles may be inflated subsonically, and heat the ICM by viscous dissipation Reynolds et al. (2004); Ruzkowski et al. (2004). Other proposed heating mechanisms invoke the pdV work done by the inflating bubble on the ICM, or mixing of inner cool and outer hot ICM induced by rising bubbles.
In this paper, we report on Chandra observations of the cluster Abell 115 (A 115), a richness class 3 galaxy cluster at = 0.1971 Abell et al. (1989). Einstein observations with the Imaging Proportional Counter (IPC, 2.6 ksec) and the High Resolution Imager (HRI, 8.2 ksec) revealed a double peaked X-ray surface brightness Forman et al. (1981). The cluster has a large X-ray luminosity of 4.7. A surface brightness deprojection analysis indicated cooling flows of 313 and 112 in the northern and southern sub-clusters, respectively White et al. (1997). ASCA X-ray observations of A 115 (32.0 ksec + 33.1 ksec) indicated significant variation of the F(2 keV-10 keV)/F(0.5 keV-2 keV) hardness ratio, consistent with an ICM temperature of the northern component, the interface region, and the southern component of 4.9 keV, 11 keV, and 5.2 keV, respectively Shibata et al. (1999). The cluster has extensively been studied in the optical Noonan (1981); Beers et al. (1983); Rakos et al. (2000); Pinkney et al (2000). The northern and southern X-ray components are associated with dense regions of cluster galaxies; a third galaxy concentration is found in a region of rather low X-ray surface brightness in the east of the cluster Beers et al. (1983). The northern sub-cluster harbors the very strong radio galaxy 3C 28.0 Riley et al. (1975); Macklin (1983); Feretti et al. (1984); Giovannini et al. (1987); Owen et al. (1997); Govoni et al. (2001). Its host galaxy is the Brightest Cluster Galaxy (BCG) of the northern cluster component. The radio morphology is intermediate between the classical Fanaroff-Riley I and II classes. Its 178 MHz luminosity of 2.3 is 10 times higher than usual for FR I sources.
We proposed A 115 observations with the Chandra X-ray telescope to scrutinize the cluster merger for temperature inhomogeneities and to search for merger shocks. As an additional motivation, an archival ROSAT HRI (29 ksec) image showed indications for a morphological correlation between the radio brightness of 3C 28.0 and the ICM surface brightness. In this paper, we describe the results of the 50.4 ksec Chandra observation. We describe the data cleaning and analysis in Sect. 2. We present the surface brightness and temperature distributions in Sects. 3.1 and 3.2, respectively. We discuss surface brightness discontinuities of the northern sub-cluster (A 115 N) and their interpretation in Sect. 3.3. We scrutinize the morphological correlation of the radio galaxy 3C 28.0 and the X-ray surface distribution in Sect. 3.4. In Sect. 4 we summarize the results.
In the following we use H km s-1 Mpc-1, , 0.27, and 0.73, putting the cluster at a luminosity distance of 955 Mpc and a angular distance of 666 Mpc; 1” corresponds to 3.23 kpc. Statistical errors are given on 90% confidence level.
2 Data Preparation and Analysis
The Chandra ACIS I observation was taken on October 7-8, 2002 (Chandra ObsId 3233). The observation used the chips ACIS I0-I3 as well as ACIS S2. The data were taken in “Very Faint” (VF) mode to minimize background counts and the ACIS S3 chip was turned off to keep the telemetry rate low during background flares.
The data were analyzed with CIAO 3.0.1 analysis software111Information about CIAO and all the analysis steps described in this paper can be found at: http://cxc.harvard.edu/ciao/ using the CALDB 2.26 calibration data base222http://cxc.harvard.edu/caldb/. After removing bad pixel events, the data were screened for background flares, but none were found. We corrected the data for the Charge Transfer Inefficiency (CTI) with the script acis_process_events and the option apply_cti=yes. We used apply_gain to correct for the secular change in the ACIS I gain333http://cxc.harvard.edu/ciao/threads/acistimegain/. The VF-specific filter algorithm reduced the background by 30% while retaining 98% of the signal. We used the standard method to create a background data set from ACIS I Blank Sky data using the script make_acisbg. We applied the same VF filter to the background data set as to the cluster data. We produced flat-fielded images by correcting the 0.5-1 keV, 1-2 keV, and 2-5 keV images with the appropriate exposure maps, and subsequently combining the 3 images with a spectral weight. We constructed a hardness ratio map by using the flatfielded and background subtracted (2-5 keV) and (1-2 keV) surface brightness maps. After smoothing both maps in the same way, we divided them to give the hardness ratio map.
The spectral analysis was performed with sherpa and used the script acisspec. The script can handle extended sources and accounts for the different exposure times of the data file and the background file. The spectral analysis uses only events from 0.5 keV to 6 keV. Above 6 keV the signal to noise ratio is poor; below 0.5 keV the response of the instrument is plagued by systematic uncertainties. For the spectral analysis, we scaled the counts below 1.8 keV by the empirical factor of 0.93 to correct for the quantum efficiency degradation in front illuminated chips (M. Markevitch, private communication). The energy spectra were binned with the requirement to have at least 5 counts per bin. The regions we used to extract energy spectra avoided detected point sources.
The study of the morphological correlation between the ICM surface brightness distribution and the radio emission of 3C 28.0 used the 1.4 GHz radio map by Feretti et al. (1984).
3 Results
3.1 Overall Morphology of the Binary Merger
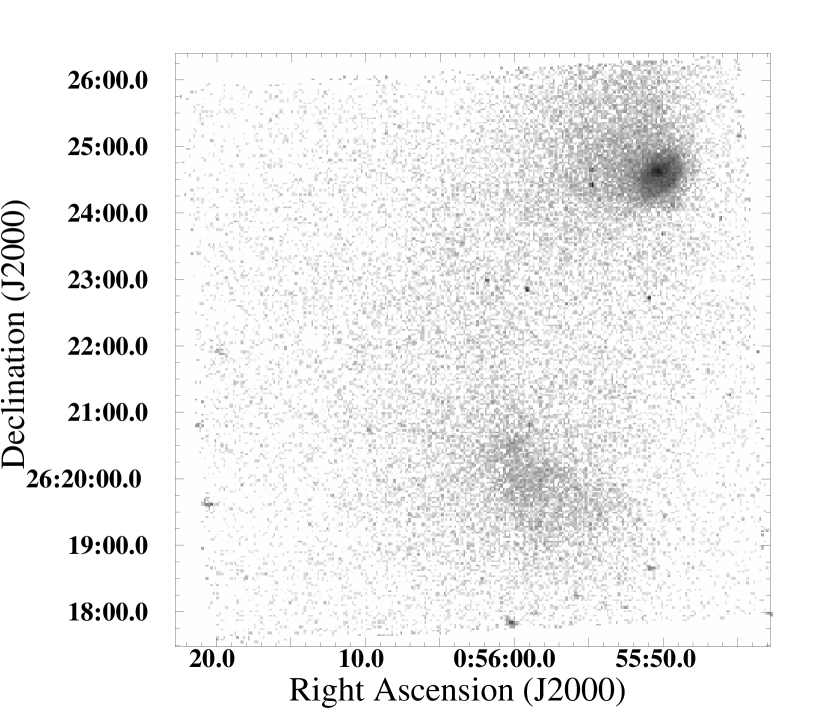
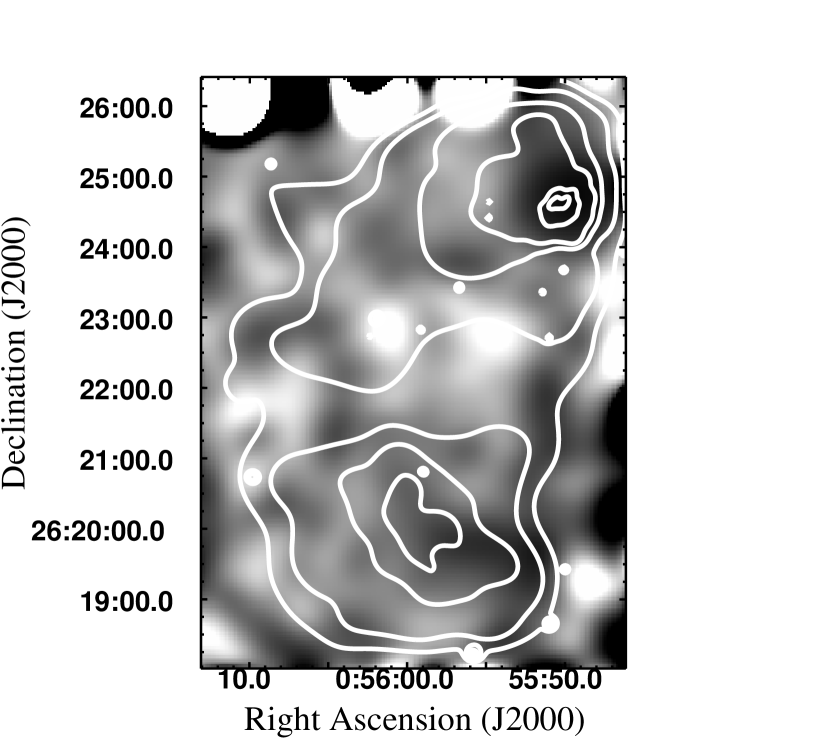
Fig. 1 shows the X-ray surface brightness distribution of A 115. The overall morphology shows a merger with very substantial off-axis motion and roughly resembles the well known morphology seen in optical images of off-axis galaxy mergers, e.g. optical images of the Antenna galaxy merger. The northern sub-cluster exhibits a wedge like shape and appears to be moving toward the southwest direction. The sub-cluster’s surface brightness distribution shows a strong gradient at its southwestern side and an X-ray bright “fan” toward the northeast. The core of the radio galaxy 3C 28.0 is roughly centered on the brightest X-ray region of A 115 N.
The merger skewed the southern sub-cluster (A 115 S), resulting in a pronounced elongation in the northeast to southwest direction. We detected point-like X-ray emission from a spectroscopically verified cluster galaxy that lies at the northeastern edge of the bright core of the southern sub-cluster. The location suggests that this galaxy is the central galaxy of the southern sub-cluster. In between the 2 sub-clusters, offset toward the east direction, the Chandra image shows faint X-ray emission from a region that connects the 2 sub-clusters. The absence of strong surface brightness gradients do not allow us to determine unambiguously if A 115 S moves into the northeast or southwest direction. A possibility is that the sub-cluster moves toward the northeast, with the dark matter core and the central galaxy leading and the ICM trailing behind.
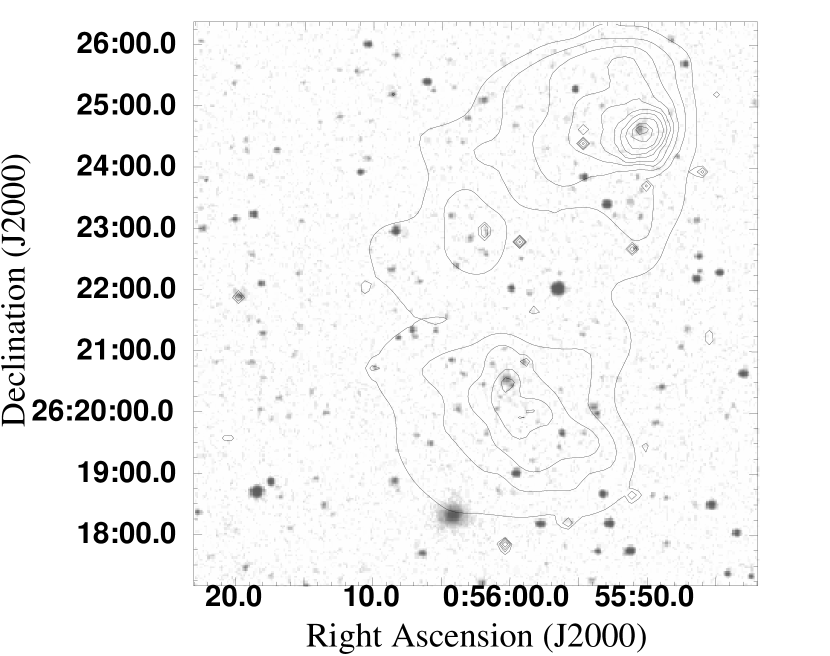
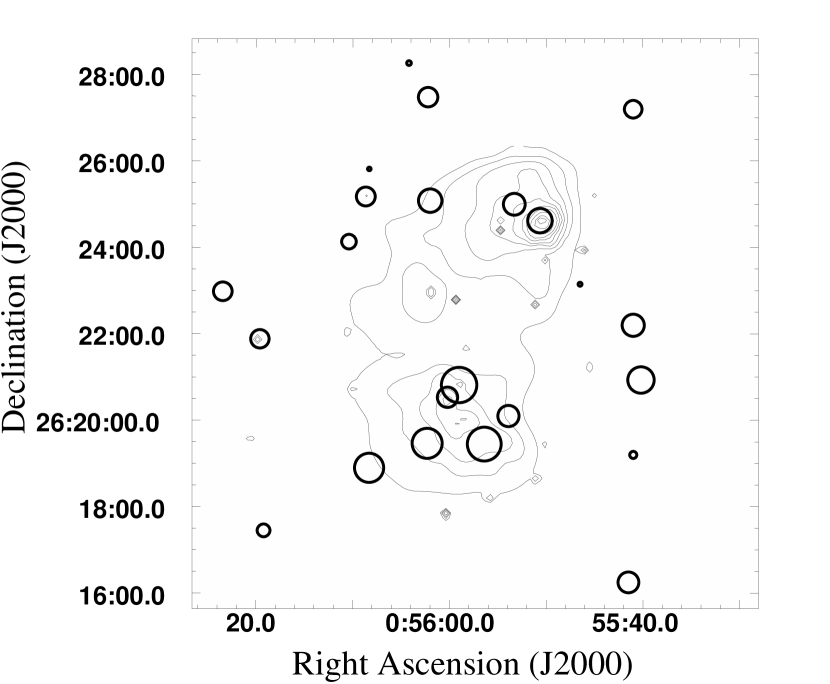
Fig. 2 shows the Chandra contours overlaid on the optical Digital Sky Survey444http://archive.stsci.edu/cgi-bin/dss_form (DSS) image. Several galaxies can be recognized that emit in the optical and in the X-ray band. For both sub-clusters, the peak of the X-ray surface brightness coincides with a galaxy detected in the optical. Fig. 3 shows the location and redshifts of all spectroscopically verified cluster galaxies that are listed in the Simbad astronomical data base555http://simbad.u-strasbg.fr/Simbad. The radii of the circles are encoded with the redshifts of the sources – small circles representing low redshifts, and large circles representing high redshifts. The redshifts are from Beers et al. (1983), Pinkney et al. (2000), and Zabludoff et al. (1990). The majority of galaxies in A 115 S seem to recede faster from us than the average A 115 N galaxies. A notable exception is the galaxy at or near the peak of the A 115 S X-ray surface distribution. The average velocity difference between the 3 galaxies close to the northern sub-cluster core and the 6 galaxies close to the southern sub-cluster core is 900 km s-1, which is below the clusters escape velocity of . The different average redshifts of the galaxies in the 2 sub-clusters indicate that the orbital motion is not fully contained in the plane of the sky.
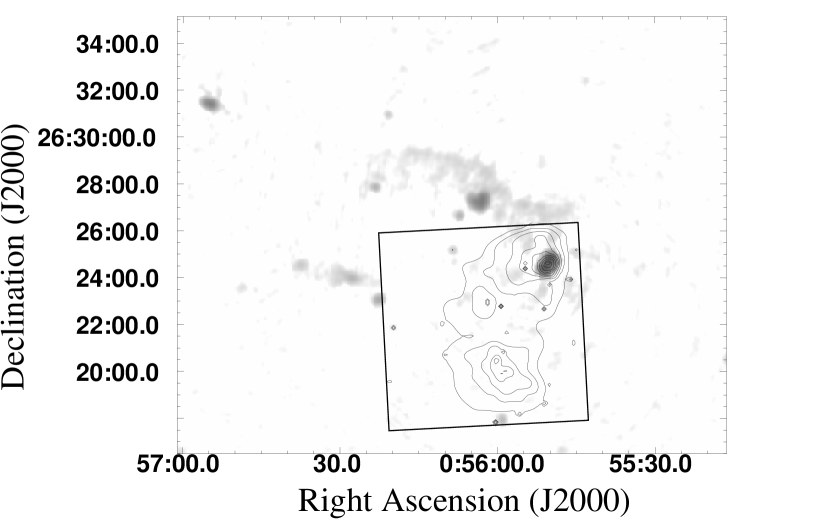
Fig. 4 shows the Chandra contours overlaid on the 1.4 GHz radio brightness map of Govoni et al. (2001). The deep radio map shows 3C 28.0, as well as an additional source toward the northeast of the cluster. A 10’ (2 Mpc) long radio arc connects the two radio sources and extends further towards the northeast of the cluster. Govoni et al. discussed the origin of the radio emission and emphasized that the orientation and location of the arc argued against a cluster relic. In view of the rapid movement of A 115 N towards the southwest, as evident from the Chandra data, the radio emission may be interpreted as tails of radio plasma trailing the radio galaxies.
A search for X-ray point sources near A 115 resulted in five interesting detections. Four sources are associated with cluster galaxies, and one source with the infrared source IRAS F00536+2611. Further to the west (9’ from A 115 N) we find a very strong X-ray source with 948 Chandra counts and without any counterparts in the Simbad data base. This source lies at (J2000) 0:55:09.2 (J2000) +26:27:14 and is designated here CXOU J005509.2+262714. The source exhibits a very hard energy spectrum and is not well fitted by a one-component Raymond-Smith model. A simple power-law fit gives a photon index of , and a 1 keV flux amplitude of photons keV-1 cm-2 s-1 with 42.6(43). We do not find evidence for flux variability during the 50 ksec Chandra observation. Optical STScI DSS show an optical counterpart, however no radio counterpart is seen in the 1.4 GHz radio map of Govoni et al. The source is close to a chip boundary and appears to be extended, however using the ChaRT666http://cxc.harvard.edu/chart/ simulator we obtained an almost shaped image from a point source. We therefore conclude that this source is most likely a point source. All the point sources are listed in Table 1.
3.2 Temperature and metallicity of the ICM
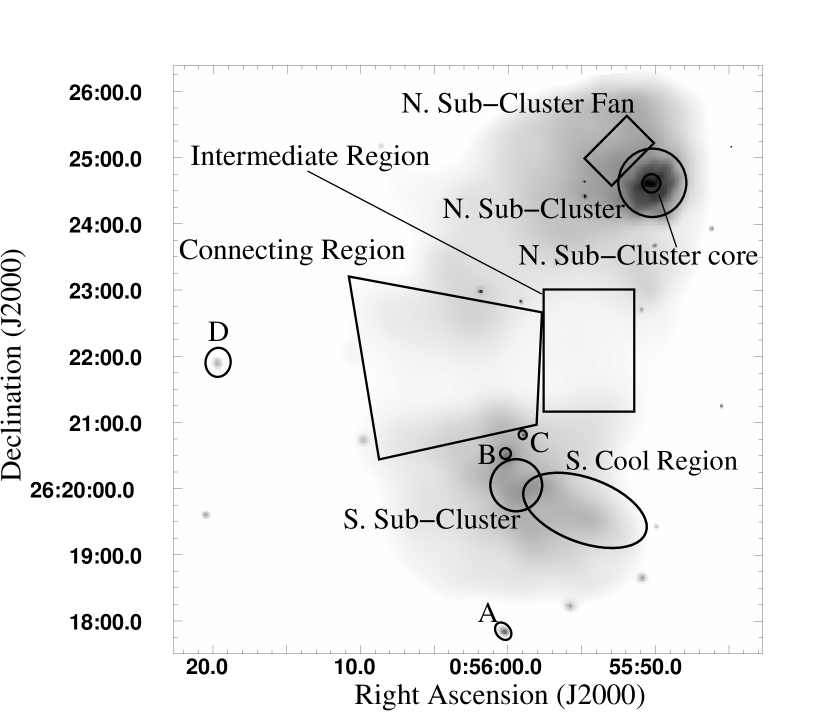
The (2-5 keV)/(1-2 keV) hardness ratio map of the X-ray emission is shown in Fig. 5. The two maxima in the surface brightness distribution show up as regions of rather cold ICM. Between the two sub-clusters is a region of very hot ICM. We ran a full spectral analysis for the most interesting regions, shown in Fig. 6. The results from one component Raymond-Smith model fits are listed in Table 2. The temperature of the two sub-clusters is lowest near their cores. For the northern and the southern sub-clusters we get projected temperatures of 2.2 keV and 3.7 keV, respectively. The metallicity is highest (0.4 solar) near the core of A 115 N. The rest of the cluster exhibits a metallicity close to 1/5th solar. For the thin region connecting the two sub-clusters and for the region directly between the 2 sub-clusters we get temperatures of 7.2 keV and 8.7 keV, respectively. Thus, the Chandra observation confirms the earlier result by Shibata et al. (1999) of hot regions between the 2 sub-clusters based on ASCA observations. Based on the luminosity-temperature correlation, the emission weighted mean temperatures of A 115 N and A 115 S are 5.2 keV and 4.8 keV, respectively White et al. (1997). Thus, the sub-cluster cores are indeed relatively cold and the regions between the sub-clusters are relatively hot. The Chandra image does not show direct evidence for a shock or a shock system between the two sub-clusters that might have caused the elevated ICM temperature.
3.3 The structure of the northern sub-cluster
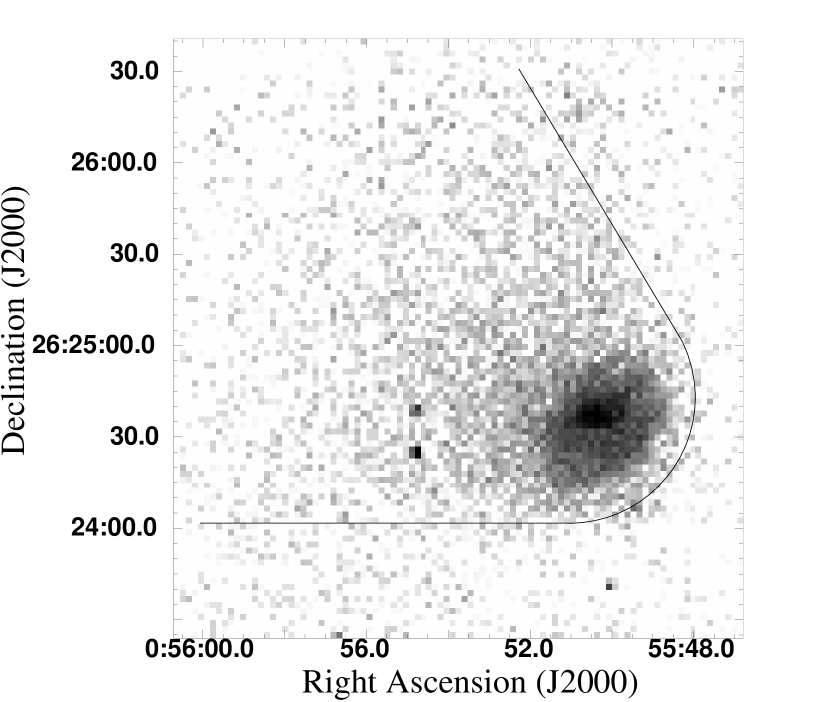
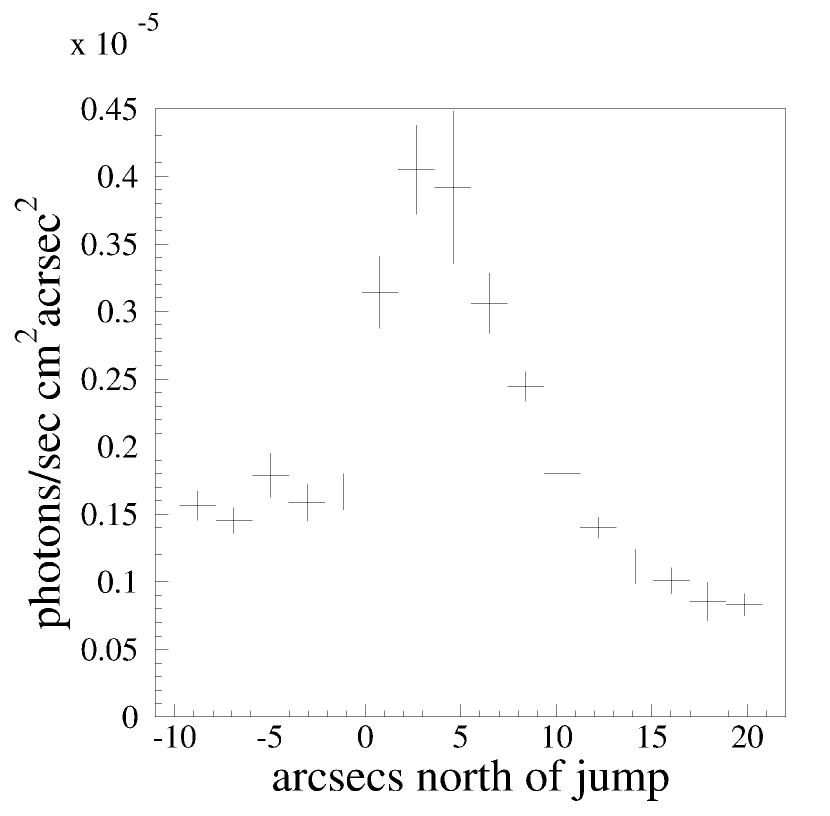
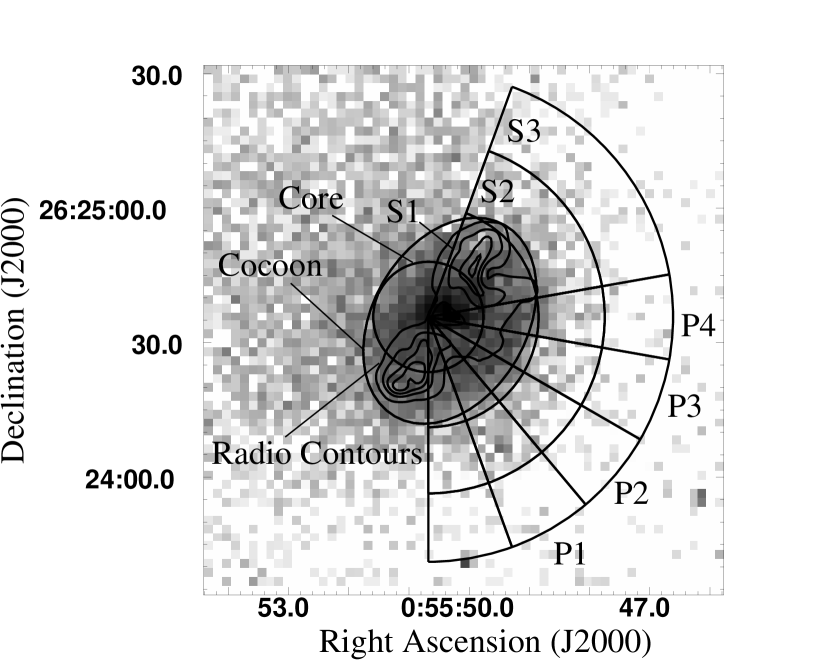
In this section we scrutinize A 115 N. We start with the sub-cluster core, and subsequently work our way further outwards. In Fig. 7 one can recognize an X-ray bright region right at the core of the sub-cluster. As shown in the north-south surface profile in Fig. 8, the boundary of the region is associated with a highly significant surface brightness jump. The region is approximately 10” (30 kpc) wide and 10” (30 kpc) high. The projected size suggests that the emission might be associated with the Inter-Stellar Medium (ISM) of the central cD galaxy. The photon statistics are not sufficient to measure a difference in temperature and chemical composition between the bright compact region and the ambient ICM. We will discuss the hypothesis further in Sect. 4. The surface brightness distribution of the A 115 N shows a steep gradient to the southwest of the sub-cluster core. We studied this region with radial surface brightness profiles and a spectroscopic deprojection analysis. The sky regions used for the following analysis are shown in Fig. 9.
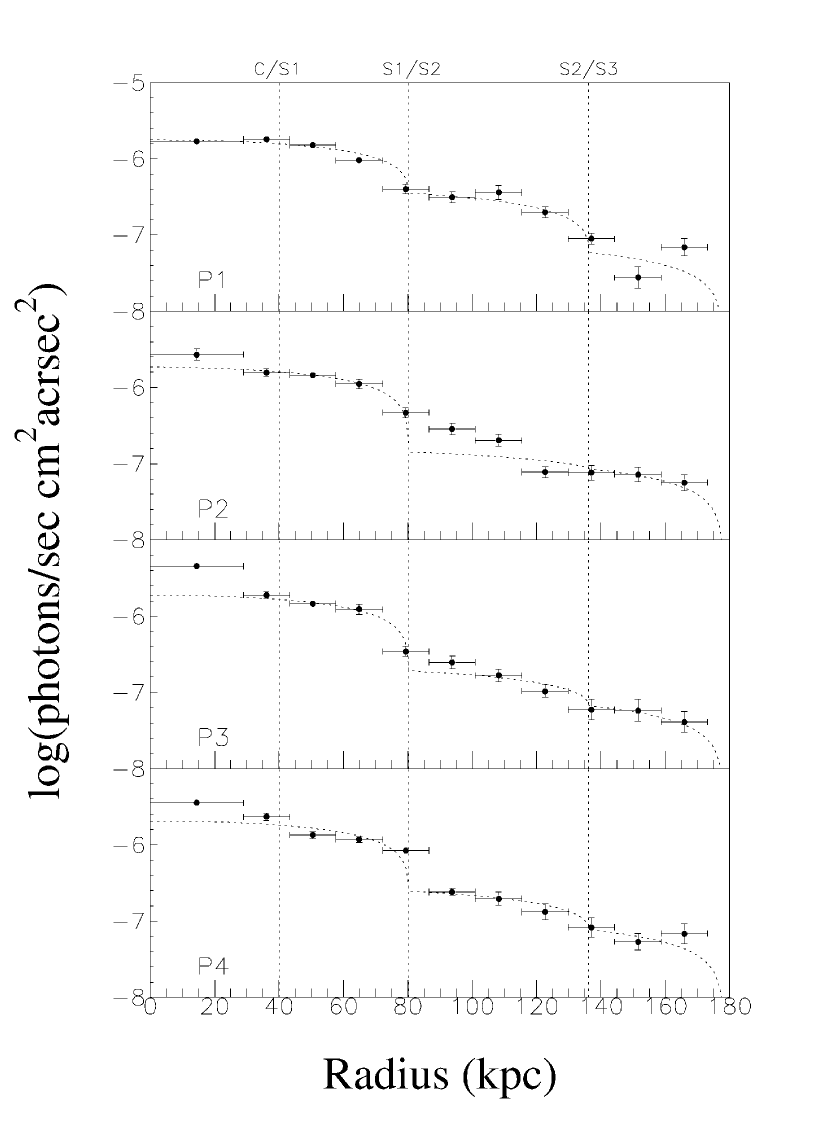
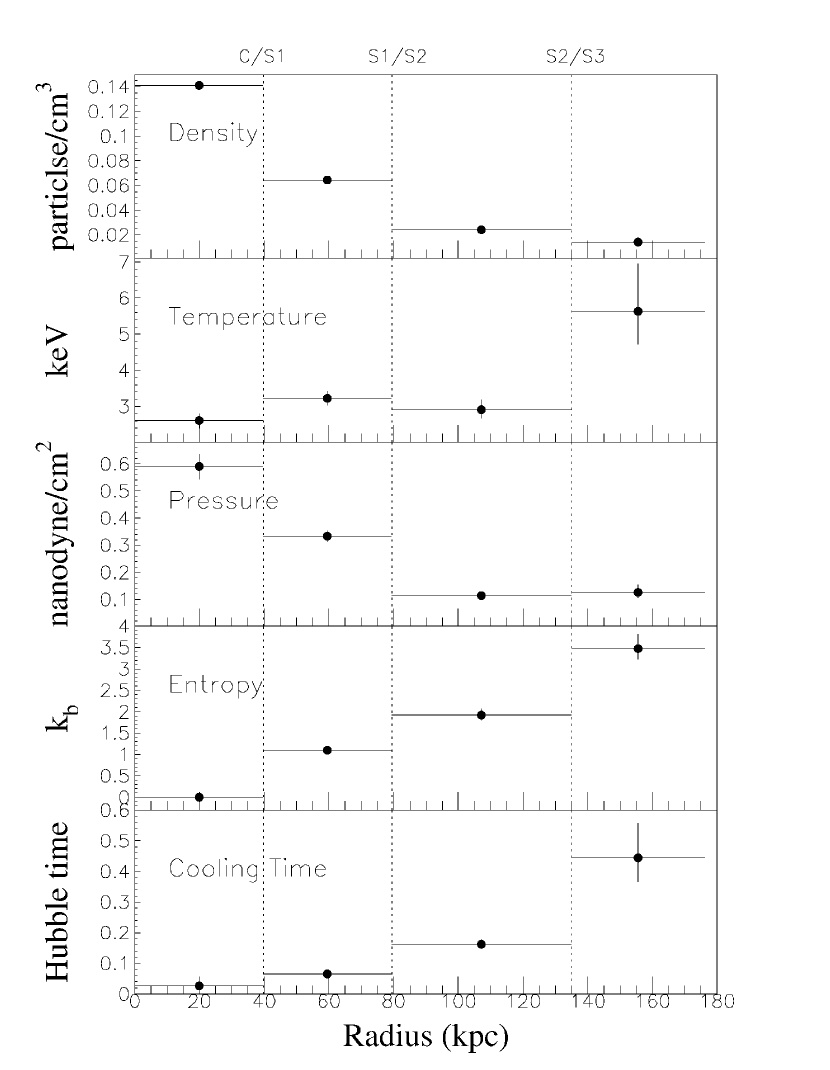
Fig. 10 shows surface brightness profiles for 4 pie sections to the southwest of the core of A 115 N. The geometry of the 4 pie sections (P1 - P4) are shown in Fig. 9. Close inspection of the profiles shows a jump at about 24.6” (80 kpc) from the cluster core, or more correctly, from the core of the radio galaxy 3C 28.0, which we chose as center for this study. The location of the jump depends slightly on the pie-section. For sections P1-P3 it can be found at 75 kpc from the core, and for section P4 at 85 kpc. For pie sections P1 and P2 the surface brightness jumps by a factor of 2.5. For sections P3 and P4 it jumps by a factor of 4. The jump associated with the compact bright region (ISM) of the central galaxy can not be seen here clearly, owing to the irregular shape of that region. In rough approximation, the surface brightness profiles can be described by a simple model using a sphere surrounded by three spherical shells, and assuming constant volume emissivity in the four volumes (see Fig. 10, dashed line). To further elucidate the origin of the surface brightness jumps, we assumed spherical symmetry in the southwestern part of the cluster and performed a spectroscopic deprojection analysis Krawczynski (2002). The model uses a spherical core (C) surrounded by 3 ICM shells (S1, S2, S3), as shown in Fig. 9. Working from the outermost ICM shell inwards, we determine the 1 component Raymont Smith plasma parameters. Hereby we take into account, if applicable, the contribution of outer shells. Fig. 11 shows from top to bottom the derived ICM particle density, temperature, pressure, entropy, and cooling time profiles. The ICM density falls from 0.14 particles cm-3 at the cluster core to 0.014 particles cm-3 at the third shell. We obtain a temperature of 3 keV at the core and the innermost 2 shells. Shell 3 is substantially hotter at keV. The pressure drops from dyne cm-2 at the cluster core to dyne cm-2 at shell 3. The entropy increases monotonically from the cluster core to shell 3, with a total change of . The radiative cooling time is shortest at the cluster core being 360 million years. The deprojected plasma parameters argue strongly against a shock being responsible for the surface brightness jump at the S1/S2 boundary. The temperature stays rather constant across the boundary and the entropy increases from shell S1 to S2, contrary to the expectations for a shock. In a more quantitative analysis, we use the Rankine-Hugoniot relations that relate the upstream to the downstream plasma parameters:
| (1) |
| (2) |
where , , and , are the pressure and particle densities in shells 1 and 2, respectively; is the shock’s Mach number, and 5/3 is the adiabatic index. Throughout the entire sub-cluster the radiative cooling times are long compared to the dynamical time scales of the relative motion of the sub-clusters. The assumption of an adiabatic shock is thus well justified. Using that the ICM emissivity is roughly proportional to together with the ideal gas law, we derive that a surface brightness jump by a factor of 3 would be accompanied by a temperature increase by a factor of 1.4 and an entropy increase by 0.04 across the shock. Contrary to these expectations, the deprojected temperature increases only by a factor of 1.11 and the entropy drops rather than increases from shell 2 to shell 1. We conclude that the surface brightness jump is not caused by a shock but by dense ICM coasting through thinner ICM.
The surface brightness distribution of A 115 N exhibits an X-ray bright fan to the northeast of the cluster core. To test if this feature corresponds to a Mach cone, we have chosen the shells of the deprojection analysis such that the S2/S3 boundary approximately connects to the fan boundaries (see Fig. 7). If the feature was associated with the bow shock of the cluster core, we would expect that the temperature and entropy increase from shell S3 to shell S2. The data, however, show that both decrease. More quantitatively, we use the angle of 70∘ between the boundaries of the fan to compute a corresponding Mach number:
| (3) |
Using the Rankine-Hugoniot conditions from Eqs. 1-2, we infer minimum density, pressure, and temperature jumps from shell 3 to shell 2 by factors of 2, 3.5, and 1.7, respectively. Similarly the entropy would be also be expected to increase by 0.1 . Such jumps are clearly not observed. We conclude that the X-ray bright fan to the northeast of the cluster core is not associated with a shock, but is produced by ICM trailing behind the sub-cluster core.
3.4 Correlation of X-ray surface brightness and the radio morphology of 3C 28.0
Note that the morphology of 3C 28.0 is very similar at the two wavelengths where we have high resolution radio maps, 1.4 GHz Feretti et al. (1984), and 5 GHz Riley et al. (1975). The radio data show double-sided jets that have drilled 2 channels through the compact X-ray bright region at the sub-cluster core. The jets transition into radio lobes right when they leave the compact region. The radio lobes clearly avoid the compact region. The Chandra data show no evidence for a cavity or bubble associated with the radio lobes.
4 Summary and discussion
4.1 Off-axis cluster merger
The Chandra observation shows a binary cluster merger with a very clear signature for fast orbital motion of the two sub-clusters. This motion results in a pronounced X-ray surface brightness gradient in the southwestern part of the northern sub-cluster, and a highly elongated ICM surface brightness distribution of the southern sub-cluster. Although the merger has deformed the sub-clusters, their cores have not yet disintegrated. As discussed extensively in recent literature, a substantial magnetic field may contribute to the stability of cold and dense regions Vikhlinin et al. (2001); Heinz et al. (2003); Okabe & Hattori (2003); Asai et al. (2004).
Although the X-ray morphology suggests the existence of shocks towards the southwest of A 115 N and a Mach cone towards the northeast, the X-ray spectroscopy data are not consistent with the shock interpretation. We conclude that the northern sub-cluster moves sub-sonically through the ambient medium. The surface brightness jump in the southwest is caused by a contact discontinuity of dense material moving through thinner material. The bright X-ray emission in the northwest is caused by a fan of ICM left behind by the advancing sub-cluster core. We find hot ICM in between the two sub-clusters, but no direct evidence for shock heating of the ICM. A possible interpretation is that the ICM is heated by viscous dissipation, rather than by shocks.
Estimates show that mergers with large impact parameters are usually associated with three or more mass concentrations Sarazin (2002). Given that A 115 N is more massive and the presence of the large distorted radio relic in the northeast of the sub-cluster, we speculate that it picked up angular momentum during an earlier merger event. It is instructive to compute the sub-cluster velocities, assuming that they are in a circular Keplerian orbit. We use the sub-cluster masses of the northern and southern sub-clusters of 179 M⊙ and 63.9 M⊙ from a surface brightness deprojection analysis White et al. (1997). Assuming that the orbital plane is perpendicular to the line of sight, Kepler’s third law gives an orbital period
| (4) |
With a semi-major axis of 484 kpc (2.5’) and the gravitational constant 6.673 10-11 m3 kg-1 s-2, we get 2 billion years. The period corresponds to orbital velocities for A 115 N and A 115 S of 776 km s-1 and 2147 km s-1, respectively. While the velocity of A 115 N lies below the sound speed of the ambient medium 1160 km s-1, that of A 115 S exceeds the sound speed. The velocities would be higher if the sub-clusters are in an elliptical or open orbit, and lower if the orbital plane is not seen edge-on. If projection effects are negligible, the absence of a bow-shock surrounding the southern sub-cluster could be explained in two ways: (i) the ICM surrounding the sub-cluster moves with a similar velocity as the sub-cluster; (ii) the velocity of the sub-cluster is substantially below the one computed for a Keplerian orbit as much of the kinetic energy has been dissipated into random energy of the ICM and the dark matter.
4.2 The core of the northern sub-cluster
We found a compact cold core at the center of the northern sub-cluster with a projected width and height of 10” (30 kpc) each. A significant surface brightness discontinuity separates the core from the ambient ICM. The 1.4 GHz picture shows that the jets from the radio source 3C 28.0 have drilled 2 channels through the X-ray bright core region and transition into radio lobes upon leaving the core region. We find 3 viable interpretations:
-
1.
The compact core might be the ISM of the central cD galaxy. See Kazuo et al. (2001) for a related discussion. This interpretation might explain the surface brightness jump associated with this region by cold and dense ISM accumulating near the core of the cluster.
-
2.
We may see the core of the cooling flow. The surface brightness discontinuities might be produced by “sloshing” of the core, as recently reported for a large number of galaxy clusters observed with Chandra Markevitch et al. (2002).
-
3.
Wilson et al. (2002) discovered filaments of cold material inside the X-ray cocoon of the radio galaxy Cygnus-A. They interpreted this material as low entropy ICM sinking toward the core of the radio galaxy, and ultimately fueling the activity of the AGN. Naively one would not expect that this process produces ICM contact discontinuities, and thus drastic surface brightness jumps. However, the Chandra image of Cygnus-A clearly shows strong surface brightness and temperature gradients throughout the central region of the cocoon-like structure associated with the radio source.
The structure of the cores of galaxy clusters and the implications for fueling of the central AGN are clearly extremely important open questions.
As described in the introduction, heating of the ICM by the jets from the AGN of the central cD galaxy is being discussed as a mechanism to explain the absence of cold gas ( 1.5 keV) in cooling flow clusters. In the case of the radio galaxy Cygnus-A, Wilson et al. (2002) found some evidence that the central radio galaxy heats the ICM, either through a bow-shock or through pdV work done by the inflating radio plasma on the ambient ICM. The radio galaxy 3C 28.0 fits neatly into an elliptical region of bright ICM, delimited to the southwest by the S1/S2 surface brightness jump. The cocoon-like morphology suggests that the radio galaxy may drive a bow-shock into the ICM heating it. However, we do not find spectroscopic evidence that bolsters this hypothesis. In the case of Cygnus-A, the Chandra data shows that the surface brightness and temperature varies on small spatial scales. The poorer signal to noise ratio of the A 115 observations does not allow us to search for similar small scale features.
References
- Abell et al. (1989) Abell, G. O., Corwin, H. G., & Olowin, R. P. 1989, ApJS, 70, 1
- Asai et al. (2004) Asai, N., Fukuda, N., Matsumoto, R. 2004, ApJ, 606, L105
- Beers et al. (1983) Beers, T. C., Huchra, J. P., & Geller, M. J. 1983, ApJ, 264, 356
- Birzan et al. (2004) Birzan, L., Rafferty, D. A., McNamara, B. R., Wise, M. W., Nulsen, P. E. J. 2004, ApJ, 607, 800
- Blanton (2003) Blanton, E. L. 2003, The Riddle of Cooling Flows in Galaxies and Clusters of Galaxies, Charlottesville, VA, USA, Eds. T. H. Reiprich, J. C. Kempner, N. Soker, http://www.astro.virginia.edu/coolflow/proc.php
- Böhringer et al. (2002) Böhringer, H., Matsushita, K., Churazov, E., Ikebe, Y., Chen, Y. 2002, A&A, 382, 804
- Böhringer et al. (1993) Böhringer, H., Voges, W., Fabian, A. C., Edge, A. C., & Neumann, D. M. 1993, MNRAS, 264, L25
- Carilli et al. (1994) Carilli, C. L., Perley, R. A., & Harris, D. E. 1994, MNRAS, 270, 173
- Churazov et al. (2002) Churazov, E., Sunyaev, R., Forman, W., Böhringer, H. 2002, MNRAS, 332, 729
- Donahue & Voit (2003) Donahue, M. , Voit, G. M. 2003, Carnegie Observatory Astrophysics Series, Vol. 3: Clusters of Galaxies: Probes of Cosmological Structure and Galaxy Evolution, Eds. J. S. Mulchaey, A. Dressler, A. Oemler, Cambridge University Press
- Fabian (1994) Fabian, A. C. ARAA, 1994, 32, 277
- Fabian et al. (2003) Fabian, A. C., Sanders, J. S., Allen, S. W., et al. 2003, MNRAS, 344, L43
- Feretti et al. (1984) Feretti, L., Gioia, I. M., Giovannini, G., Gregorini, L., & Parma, P. 1984, Astrophys., 139, 50
- Forman et al. (1981) Forman, W., et al. 1981, ApJ, 243, L133
- Forman et al. (2004) Forman, W., Nulsen, P., Heinz, S., et al. 2004, submitted to the ApJ
- Giovannini et al. (1987) Giovannini, G., Geretti, L., & Gregorini, L. 1987, A&AS, 69, 171
- Govoni et al. (2001) Govoni, F., Feretti, L., Giovannini, G., Böhringer, J., Reiprich, T. H., Murgia, M. 2001, A&A, 376, 803
- Heinz et al. (2003) Heinz, S., Churazov, E., Forman, W., Jones, C., Briel, U. G. 2003, MNRAS, 346, 13
- Kazuo et al. (2001) Kazuo, M., Hajime, E., Fakuzawa, Y., et al. 2001, Publication of the Astronomical Society of Japan, vol. 53, no. 3, 401
- Kempner et al. (2004) Kempner, J. C., David, L. P. 2004, MNRAS, 349, 385
- Krawczynski (2002) Krawczynski, H. 2002, ApJ, 569, L27
- Macklin (1983) Macklin, J. T. 1983, MNRAS 203, 147
- Markevitch et al. (2002) Markevitch, M., Gonzales, A. H., David, L., et al. 2002, ApJ, 567, L27
- Markevitch et al. (2000) Markevitch, M., Ponman, T. J., Nulsen, P. E. J., et al. 2000, ApJ, 541, 542
- Noonan (1981) Noonan, T.W. 1981, ApJS, 45, 613
- Okabe & Hattori (2003) Okabe, N., Hattori, M. 2003, ApJ, 599, 964
- Owen et al. (1997) Owen, F. N., Ledlow, M. J. 1997, ApJS, 108, 41
- Peterson et al. (2003) Peterson, J. R., Kahn, S. M., Paerels, F. B. S. 2003, The Riddle of Cooling Flows in Galaxies and Clusters of Galaxies, Charlottesville, VA, USA, Eds. T. H. Reiprich, J. C. Kempner, N. Soker, http://www.astro.virginia.edu/coolflow/proc.php
- Pinkney et al (2000) Pinkney, J., Burns, J. O., Ledlow, M. J., Gomez, P. L., Hill, J. M. 2000, AJ, 120, 2269
- Rakos et al. (2000) Rakos, K.D., et al. 2000, ApJ, 540, 715
- Reynolds et al. (2004) Reynolds, S. R., McKernan, B., Fabian, A. C., Stone, J. M., Vernaleo, J. C. 2004, submitted to MNRAS
- Riley et al. (1975) Riley, J.M., Pooley, G.G. 1975, MNRAS, 80, 105
- Ruzkowski et al. (2004) Ruzkowski, M., Bruggen, M., Begelman, M. C. 2004, AAS, 204, 0901
- Sarazin (2002) Sarazin, C. L. 2002, in Merging Processes in Galaxy Clusters, Ed. L. Feretti, I. M. Gioa, G. Giovanni (Dordrecht Kluwer), 1
- Shibata et al. (1999) Shibata, R., Honda, H., Ishida, M., Ohashi, T., & Yamashita, K. 1999, ApJ, 524, 603
- Vikhlinin et al. (2001) Vikhlinin, A., Markevitch, M., Murray, S. S. 2001, ApJ, 549, L47
- White et al. (1997) White, D. A., Jones, C., Forman, W. 1997, MNRAS, 292, 419
- Wilson et al. (2002) Wilson, A. S., Arnaud, K. A., Smith, D. A., Terashima, Y., Young, AJ 2002, New Visions of the Universe in the XMM-Newton and Chandra Era, Ed. F. Jansen, ESA SP-488.
- Zabludoff et al. (1990) Zabludoff A. I., Huchra J. P., Geller M. J. 1990, ApJS, 74, 1Z
| Lable | Counterpart | Object type | RA/DEC | redshift | net counts |
|---|---|---|---|---|---|
| A | ZHG90/ACO 115 4 | cluster galaxy/radio source | 00:56:00.3 / +26:17:50.3 | – | 107 |
| B | BHG83(G 29) | cluster galaxy | 00:55:00.2 / +26:20:32 | 0.192043 | 112 |
| C | BHG83(G 28) | cluster galaxy | 00:55:59.0 / +26:20:49.4 | 0.20282 | 68 |
| D | BHG83(G 16) | cluster galaxy | 00:56:19.7 / +26:21:52.1 | 0.190675 | 85 |
| E | IRAS F00536+2611 | Weak Infrared source | 00:56:20.1 / +26:28:13.9 | – | 82 |
| F | CXOU J005509.2+262714 | No Named Counterpart | 00:55:09.2 / +26:27:14 | – | 948 |
| Region | Temperature (keV) | nH | Metallicity | (dof) |
|---|---|---|---|---|
| N. Sub-Cluster | ||||
| N. Sub-Cluster Core | ||||
| N. Sub-Cluster Fan | ||||
| S. Sub-Cluster | ||||
| S. Cool Region | ||||
| Intermediate Region | ||||
| Connecting Region |