What is the Origin of the Baldwin Effect in the BLR and the NLR?
Abstract
The origin of the luminosity dependence of the strength of broad and narrow emission lines in AGN (i.e. the Baldwin effect) is not firmly established yet. We explore this question using the Boroson & Green sample of the 87 PG quasars. UV spectra of the C IV region with a sufficient S/N are available for 81 of the objects. We use these spectra to explore the dependence of the C IV EW on and , as deduced from optical spectra of the H region. We find a strong correlation of the C IV EW with . This may be the primary correlation which drives the Baldwin effect for C IV. A similar correlation analysis using the C IV FWHM instead of the H FWHM, yields an insignificant correlation. This suggests that the C IV FWHM provides a significantly less accurate estimate of compared to the H FWHM. We also measured the [O III] /[O III] line ratio for 72 objects in this sample, and use it to determine whether density or covering factor control the large range in [O III] strength in AGN.
Physics Department, Technion, Haifa 32000, Israel; alexei@physics.technion.ac.il; laor@physics.technion.ac.il
1. Introduction
The inverse correlation of emission line equivalent width (EW) with luminosity, discovered by Baldwin (1977) for C IV, was intensively explored over the past 20 years (see a comprehensive review by Osmer & Shields 1999; and more recent studies by Green et al. 2001; Croom et al. 2002; Dietrich et al. 2002; Richards et al. 2002; and Shang et al. 2003). The physical origin for this effect is not clearly established, but plausible explanations include changes with luminosity of the ionizing continuum shape, of the broad line region (BLR) covering factor, of the mean BLR ionization level, or possibly inclination effects. Recent studies established that reasonably accurate estimates of the black hole mass () can be obtained in AGN based on the continuum luminosity and H FWHM (e.g. Laor 1998). This opens up the possibility to explore whether the Baldwin effect is related to , and . We address this question in this paper, together with a related side question on whether the C IV FWHM can be used instead of the H FWHM as a comparably accurate measure of .
The narrow forbidden lines in AGN show a larger range in EW compared to the broad lines, and they also show a Baldwin effect. For example, the [O III] EW ranges from Å to undetectable ( Å) in the Boroson & Green (1992) sample, while the C IV EW ranges from Å, to Å in the same sample (see below). What physical parameter controls the [O III] EW? Is it mostly density or is it the covering factor of the illuminated narrow line region (NLR) gas? If it is controlled by covering factor variations, then the [O III] /[O III] ratio should be independent of the [O III] EW. However, if it is controlled by density variations in the NLR, then the [O III] /[O III] ratio should increase with decreasing [O III] EW. We explore these two possibilities below.
2. The C IV EW
To explore the relation of the Baldwin effect with and one needs high quality spectra of both the H and the C IV regions. We use the Boroson & Green (1992) optical spectra of a complete and well defined sample of 87 AGN from the BQS sample. This data set provides us with uniform and systematic estimates of , and . Archival UV spectra are available for 85 of the objects (47 HST, 38 IUE), of which 81 have sufficient S/N to measure the C IV EW, which we measured by fitting each spectrum with 3 gaussian components in the range of Å to Å. The H FWHM and were used for estimating and for each object (e.g. Laor 1998).
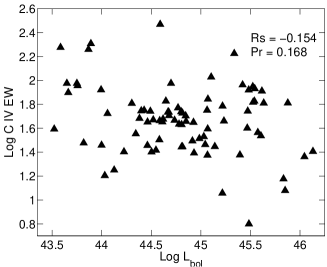
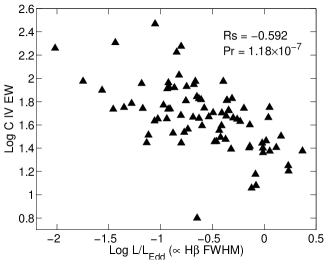
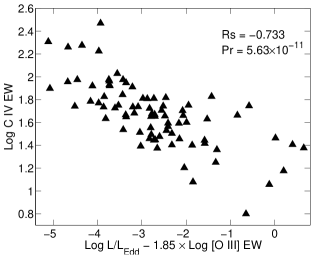
The relations of the C IV EW with and , together with the corresponding Spearman rank-order correlation coefficients, are plotted in Fig. 1. The C IV EW has a significantly tighter relation with than with (Rs increases from to ). The correlation with is low (Rs=0.222, Pr=0.047). We try to further reduce the scatter by including a third parameter describing the optical emission from Boroson & Green. The parameter which most significantly improves the correlation with is the [OIII] EW (Fig. 2, left panel), which yields Rs=-0.733. Other parameters which produce a comparably significant improvement are and the FeII/H flux ratio.
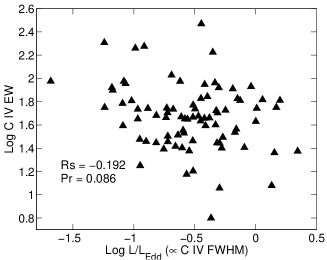
Recent studies have used the C IV FWHM, instead of the H FWHM, to estimate and (Vestergaard 2002; Warner et al. 2003). Since the H FWHM and C IV FWHM are rather poorly correlated, it is not clear whether the C IV FWHM is a useful substitute to the H FWHM (when using to estimate the size of the C IV emitting region). We repeated the correlation analysis above using the C IV FWHM for a revised estimate (Fig. 2, right panel). The revised yields a low correlation (Rs=-0.192), i.e. no significant improvement over the correlation of the C IV EW with . This suggests that the C IV FWHM does not provide an estimate of comparable accuracy to the estimate based on the H FWHM.
3. The [O III] EW
To determine whether the near absence of narrow line emission, in particular of the [O III] line, is due to NLR densities above critical, or to a low NLR covering factor, we measure the amount of [O III] emission from the same gas which emits the O III] line. The critical density of [O III] is cm-3 while the critical density of [O III] is cm-3. Thus, the [O III] /[O III] flux ratio should increase with increasing density in the above range. If the NLR is suppressed by a low covering factor then both [O III] lines should vary together.
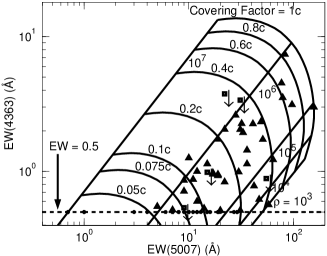
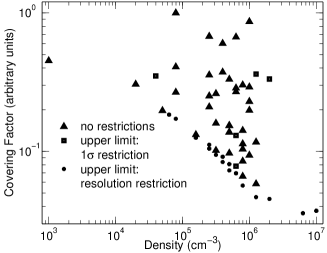
We measure the [O III] flux using the [O III] profile as a template for the 72 objects where the 4363 Å region was observed and where [O III] is measureable. Thus, we measure the [O III] line from gas which has the same velocity distribution as that of the [O III] emitting gas. The measurements are plotted in Figure 3 (left panel) together with the theoretical curves of the [O III] EW vs. the [O III] EW as a function of density as calculated using CLOUDY (assuming and cm-2 which optimizes the [O III] emissivity). These calculations allow us to infer the density and relative covering factor of each object (Fig.3, right panel). Both the density and covering factor appear to have a significant effect on the large range in [O III] EW.
Note that the absence of objects at low density and low covering factor is due to the [O III] detection limit, while the lack of object at cm-3 most likely results from the range of NLR densities coupled with the [O III] line emissivity drop above the critical density.
4. Conclusions
We find the following: 1. The C IV EW correlation with luminosity (the Baldwin relation) appears to be driven mostly by the significantly stronger correlation of the C IV EW with . The C IV EW is also related to the [O III] EW, , and the Fe II/H flux ratio. 2. Using the C IV FWHM instead of the H FWHM to estimate yields only a weak correlation of with the C IV EW. This suggests that the C IV FWHM provides a significantly less accurate measure of , compared to the H FWHM. 3. Both the density and the covering factor appear to contribute significantly to the large range in the [O III] EW in AGN.
References
Baldwin, J. A. 1977, ApJ, 214, 679
Boroson, A. T., & Green, R. F. 1992, ApJS, 80, 109
Croom, S. M. et al. 2002, MNRAS, 337, 275
Dietrich, M. et al. 2002, ApJ, 581, 912
Green, P. J., Forster, K., & Kuraszkiewicz, J. 2001, ApJ, 556, 727
Laor, A. 1998, ApJ, 505, L83
Osmer, P. S. & Shields, J. C. 1999, ASP Conf. Ser. 162: Quasars and Cosmology, 235
Richards, G. T. et al. 2002, AJ, 124, 1
Shang, Z., Wills, B. J., Robinson, E. L., Wills, D., Laor, A., Xie, B., & Yuan, J. 2003, ApJ, 586, 52
Vestergaard, M. 2002, ApJ, 571, 733
Warner, C., Hamann, F., & Dietrich, M. 2003, ApJ, in press