No evidence for a different accretion mode for all 3CR FR I radio galaxies
Abstract
We have analyzed the optical and radio properties of a sample of 3CR FR I radio galaxies which have Hubble Space Telescope imaging capable of detecting optical cores. The jet powers of the FR I radio galaxies are estimated from their low-frequency radio luminosities, and the optical core luminosity is taken as an upper limit on the emission from any unobscured accretion disc. We argue that if the accretion discs in these sources are assumed to be advection dominated accretion flows (ADAFs), or adiabatic inflow-outflow solution (ADIOS) flows, then the Blandford-Znajek mechanism (Blandford & Znajek, 1977) provides insufficient power to explain the high radio luminosities of at least a third, and perhaps all, of the sample. We suggest instead that a significant fraction (the ’high-jet-power’ third), and perhaps most, of the 3CR FR I radio galaxies have normal accretion discs, but that their optical cores can be hidden, with any HST-detected optical synchrotron emission coming from jets on scales larger than the obscuring material. A normal accretion disc hypothesis, at least for the high-jet-power third of the 3CR FR Is, explains why narrow-line luminosity correlates with radio luminosity. It also explains why one object in the sample (3C 386) has an observed broad-line nucleus. We conclude that there is no evidence to suggest that there is a difference in accretion mode between FR I and FR II radio galaxies.
keywords:
accretion, accretion discs–galaxies: jets–galaxies: nuclei1 Introduction
FR I radio galaxies (defined by edge-darkened radio structure) have lower radio power than FR II galaxies (defined by edge-brightened radio structure due to compact jet-terminating hot spots) (Fanaroff & Riley, 1974). What causes the difference between FR I and FR II radio galaxies is still unclear. The different explanations of the division of FR I and FR II radio galaxies invoke either the interaction of the jet with the ambient medium or the intrinsic nuclei properties of accretion and jet formation processes (e.g., Bicknell 1995; Gopal-Krishna & Wiita 1988; Reynolds et al. 1996; Baum, Zirbel & O’Dea 1995; Blundell & Rawlings 2001). In the frame of unification schemes of active galactic nuclei (AGNs), FR I radio galaxies are believed to be the misaligned BL Lac objects, and FR II radio galaxies correspond to misaligned flat-spectrum radio quasars (see Urry & Padovani 1995 for a review). The central structure and activity of radio galaxies are important for understanding the physics at work in their nuclei.
Recently, the optical nuclei of low-redshift radio galaxies have been observed by the Hubble Space Telescope (HST), and central compact optical cores detected in many cases (Capetti & Celotti, 1999; Chiaberge, Capetti, & Celotti, 1999; Chiaberge, Capetti & Celotti, 2002; Verdoes Kleijn et al., 2002). The fact that the optical fluxes of the central compact cores in 3CR FR I radio galaxies correlate linearly with their radio core fluxes, and the lack of scatter in this correlation, argues for a synchrotron origin for the optical emission of the cores in FR I radio galaxies (Chiaberge, Capetti, & Celotti, 1999). FR II galaxies, typically, show brighter optical cores than FR I galaxies and a more complex correlation between radio and optical core luminosities suggests that the disc emission may contribute a significant fraction of their optical core fluxes (Chiaberge, Capetti & Celotti, 2002). Chiaberge, Capetti, & Celotti (1999) estimated the upper limits on the disc emission of FR I galaxies from the observed optical core fluxes and found that the optical core luminosities of FR I radio galaxies are far lower than the Eddington case (), if the black holes in FR I radio galaxies have masses around 109 ; typically , in the case of the archetypal nearby FR I galaxy M87.
In the frame of unification schemes, the viewing angle of FR I galaxies is, on average, large, and it is therefore to be expected that any geometrically and optically thick torus present could hide the nucleus and broad-line emission in most cases (Urry & Padovani, 1995). In the receding torus model (Lawrence, 1991), in particular, the optical emission from a comparatively weak disc is likely to be hidden at all but very small angles to the line of sight, as the torus is predicted to lie extremely close to the nucleus (Hill, Goodrich & DePoy, 1996). However, Chiaberge, Capetti, & Celotti (1999) argued that high detection rate of optical central compact cores of FR I radio galaxies (85%) in the 3CR catalogue suggests such a torus is not present in FR I galaxies. For example, the linear resolution achieved by their HST observations at the distance of M87 corresponds to 6 pc, implying that, in this source at least, the synchrotron radio and optical core emission is not being hidden by a torus, so if one is present it must be less than 6 pc in size. Constraints on the size of any obscuring torus clearly worsen, however, for the more distant, powerful FR I radio galaxies in the 3CR sample.
The division between FR I and FR II radio galaxies is clearly shown by a line in the plane of the optical luminosity of the host galaxy and the total radio luminosity by Ledlow & Owen (1996). The FR I/II division line is a function of the optical luminosity of the host galaxy (roughly proportional to the optical luminosity). The total radio luminosity of almost all FR II radio galaxies lies above the division line, while FR I radio galaxies are in the region below the line. They suggested that the accretion rate may play an important role in the division between FR I and FR II galaxies. Recently, Ghisellini & Celotti (2001) used the optical luminosity of the host galaxy to estimate the mass of its central black hole, and used the radio luminosity to derive the jet power. They proposed that the FR I-FR II separation can be interpreted as occurring at a constant ratio between the jet power and the black hole mass. This suggests that the FRI/FRII division is linked to physics on very small scales, and potentially suggests a difference in accretion mode.
For radio galaxies and quasars, their optical/UV continuum is a mixture of the emission from the jet and from the disc, which prevents estimating the emission from the disc directly from optical/UV continuum. Moreover, obscuration of the accretion disc is known to happen in some radio galaxies (Simpson, Ward & Wall, 2000) so an orientation-independent estimator of the nuclear luminosity is needed.
A widely adopted approach to estimate the accretion disc emission in radio galaxies and quasars is to use their narrow emission lines (e.g., Rawlings & Saunders 1991; Xu, Livio & Baum 1999), or broad lines (e.g., Celotti, Padovani & Ghisellini 1997; Cao & Jiang 1999; 2001), which are ionized by the photons emitted from the disc (although photo-ionization by radiative shocks driven by the radio source can also play an important role: e.g., Inskip et al. 2002). The applicability of this approach to FR I radio galaxies has been questioned (Zirbel & Baum, 1995) but it is at least roughly in accord with the correlations between line and optical luminosities seen in high-spatial-resolution observations of nearby FR I radio galaxies (Verdoes Kleijn et al. 2002).
The cosmological parameters and have been adopted in this paper. This is not now the conventional choice, but as we are studying only low-redshift objects, this has no significant bearing on the results of this paper.
2 Sample
Chiaberge, Capetti, & Celotti (1999) processed the data of HST observations in the public archive for 32 of all 33 FR I radio galaxies belonging to the 3CR catalogue (3C76.1 has not been observed). In this work, we use these 33 FR I radio galaxies belonging to the 3CR catalogue as our sample. Key data on these sources are listed in Table 1. Chiaberge, Capetti & Celotti (2002) detected central compact cores unresolved at the HST resolution in 22 radio FR I galaxies. Five sources show larger optical cores (), which are different from those sources with detected central compact cores (). For these five sources, only upper limits on the central compact core emission are given. The remaining five sources have complex nuclear optical structures. In four of these five sources, bright compact knots are resolved and offset from the center of the galaxy. The optical image of 3C315 has an elongated structure and no central source is seen. No reliable optical core flux is available for these five sources.
3 Central black hole mass
In order to estimate the central black hole masses of FR I galaxies, we use the relation between host galaxy absolute magnitude at -band and black hole mass proposed by McLure & Dunlop (2002)
| (1) |
The derived black hole masses of all sources in the sample are listed in Table 1. For M87(3C274), its central black hole mass has been estimated to be (Ford et al., 1994; Harms et al., 1994; Macchetto et al., 1997).
4 Jet power and its origin
The relation between jet power and radio luminosity proposed by Willott et al. (1999) is
| (2) |
where is the total radio luminosity at 151 MHz in units of 1028 W Hz-1 sr-1. Willott et al. (1999) have argued that the normalization is very uncertain and introduced the factor to account for these uncertainties. They use a wide variety of arguments to suggest that . Blundell & Rawlings (2000) argued that is a likely consequence of the evolution of magnetic field strengths as radio sources evolve. This would mean that the bulk kinetic (jet) and radiative (quasar) outputs of radio-loud AGN are of similar magnitude (Fig. 7 of Willott et al. 1999). This relation was proposed for radio FR II galaxies and quasars. We adopt this relation to estimate the power of jets in FR I radio galaxies which is an approximation (because the efficiency factor for FR Is may well be systematically different), but one that is probably good to an order of magnitude. For example, we use this relation to estimate the power of the jet in M87, we find W in the case of , which, for reasonable is consistent with previous estimates (e.g., Bicknell & Begelman (1999) found W; Young, Wilson & Mundell (2002) derived the temperature and pressure of the gas in its inner radio lobes ( kpc) from the Chandra X-ray observation. The cavity of the X-ray gas is assumed to be created by the jet and its age is estimated from the free-fall timescale. The minimum power of the jet in M87 is therefore estimated as W).
It is evident that the accretion rates of FR I galaxies are very low. It has been suggested, therefore, that their accretion discs are probably in an advection dominated accretion flow (ADAF) state (Ghisellini & Celotti, 2001). An ADAF radiates inefficiently and is very hot. Most gravitational energy of the accreting matter released is carried into the black hole. Unlike the optically thick accretion disc case, there is a theoretical upper limit on the accretion rate for an ADAF (Narayan & Yi, 1995). The optically thin ADAF will not exist and it will transit to an optically thick disc, if its accretion rate is greater than the critical one (see Narayan 2002 for a review). The exact value of the critical accretion rate is still unclear, depending on the value of the disc viscosity parameter , i.e., (Mahadevan, 1997). Ghisellini & Celotti (2001) estimated the power of the jets in radio galaxies from their radio luminosity. They proposed that the division between FR I and FR II radio galaxies can be expressed as a constant accretion rate between - of the Eddington one on the assumption of a constant conversion of the jet power to bolometric luminosity. This is consistent with the critical accretion rate expected by ADAF models in the sense that FR I radio galaxies could be radio sources whose central engines are in the ADAF state, and FR IIs could be radio sources whose central engines are standard, optically-thick accretion discs. It is already known that there would have to be exceptions to any such rule: 3C386, an FR I in our sample (Table 1), has a relatively bright compact optical core and a broad-line nucleus (Simpson et al. 1996); there is at least one example of an optically bright quasar with FRI-like radio structure (Blundell & Rawlings 2001).
If the black holes in FR I galaxies are spinning rapidly, the rotational energy of the black holes is expected to be transferred to the jets by the magnetic fields threading the holes, namely, the Blandford-Znajek mechanism (Blandford & Znajek, 1977). The power extracted from a maximal spinning black hole was calculated by Armitage & Natarajan (1999). Here, we calculate the jet power in a similar way. The power extracted from a spinning black hole is given by (e.g. Ghosh & Abramowicz 1997; Macdonald & Thorne 1982)
| (3) |
for a black hole of mass and dimensionless angular momentum , with a magnetic field normal to the horizon at . is proportional to the black hole mass and is a function of . Here the factor depends on the angular velocity of field lines relative to that of the hole, . In order to estimate the maximal power extracted from a spinning black hole, we adopt .
The magnetic field threading the black hole is maintained by the currents in the accretion disc surrounding the hole (Ghosh & Abramowicz, 1997; Livio, Ogilvie & Pringle, 1999). The pressure of an ADAF is given by (Narayan & Yi, 1995)
| (4) |
where the dimensionless quantities are defined as follows:
and
| (5) |
Here the standard value of the accretion efficiency factor is adopted. The parameters and are (Narayan & Yi, 1995)
| (6) |
and
| (7) |
where
| (8) |
and
| (9) |
The parameter , which lies in the range 01, is the fraction of viscously dissipated energy which is advected; is the ratio of specific heats. So, the value of the parameter is in the range of . As done by Armitage & Natarajan (1999), we assume , , and two parameters and are adopted to maximize the pressure (see Eq. 4). It is obvious that the magnetic pressure is proportional to the dimensionless accretion rate (see Eq. 4). As the accretion rate of an ADAF should be less than the critical one , we can calculate the maximal jet power extracted from a spinning black hole of mass and dimensionless angular momentum from Eq. (3), if is substituted into Eq. (4). The results of the extreme case for have already been given in Armitage & Natarajan (1999).
The ADAF solutions may be modified to adiabatic inflow-outflow solutions (ADIOSs), if a powerful wind is present to carry away mass, angular momentum and energy from the accreting gas (Blandford & Begelman, 1999). In this case, the accretion rate of the disc is a function of radius instead of a constant accretion rate along for a pure ADAF. For ADIOSs, the gas swallowed by the black hole is only a small fraction of the rate at which it is supplied, as most of the gas is carried away in the wind before it reaches the black hole. The accretion rates at the inner edge of the disc for ADIOSs would be at least as low as that required by pure ADAF solutions, and they have similar structure at the inner edge of the disc (Chang, Choi & Yi, 2002). The jet power extracted from a spinning black hole by the Blandford-Znajek mechanism for ADIOS cases is therefore similar to that for pure ADAF cases, if they have similar accretion rates at the inner edge of the disc.
| Source | z | Refs. | Refs. | ||||||
|---|---|---|---|---|---|---|---|---|---|
| (1) | (2) | (3) | (4) | (5) | (6) | (7) | (8) | (9) | (10) |
| 3C 28a | 0.1953 | 30.76 | 22.48 | 18.34 | d96 | 35.07 | ZB95 | 37.1 | 8.1 |
| 3C 29 | 0.045 | 30.71 | 23.90 | 13.02 | G00 | 33.69 | ZB95 | 36.0 | 9.1 |
| 3C 31 | 0.0169 | 30.27 | 23.05 | 11.92 | S73 | 33.18 | V02 | 35.3 | 8.6 |
| 3C 66B | 0.0213 | 30.99 | 23.55 | 12.55 | M99 | 33.64 | V99 | 35.8 | 8.5 |
| 3C 75 | 0.0232 | … | 22.95 | 11.88 | S73 | 32.64 | ZB95 | 35.7 | 9.0 |
| 3C 76.1 | 0.0325 | not observed | 22.55 | 14.06 | S73 | … | 35.6 | 8.2 | |
| 3C 78 | 0.0287 | 31.93 | 24.53 | 12.50 | M99 | 34.02 | ZB95 | 35.7 | 8.9 |
| 3C 83.1 | 0.0251 | 29.59 | 22.75 | 12.39 | S73 | … | 35.8 | 8.8 | |
| 3C 84 | 0.0176 | 32.31 | 25.75 | 11.03 | G77 | 35.21 | ZB95 | 35.9 | 9.1 |
| 3C 89a | 0.1386 | 30.25 | 24.58 | 16.55 | d96 | 34.68 | ZB95 | 37.0 | 8.6 |
| 3C 264 | 0.0217 | 31.37 | 23.60 | 13.03 | M99 | 33.39 | ZB95 | 35.6 | 8.3 |
| 3C 270 | 0.0075 | 29.09 | 22.87 | 10.16 | S73 | 32.46 | ZB95 | 35.1 | 8.6 |
| 3C 272.1 | 0.00334 | 29.45 | 21.94 | 9.26 | S73 | 32.67 | ZB95 | 34.1 | 8.2 |
| 3C 274 | 0.0044 | 30.51 | 23.51 | 9.03 | S73 | 33.77 | ZB95 | 35.8 | 9.5 |
| 3C 277.3a | 0.0853 | 30.69 | 23.58 | 15.71 | E85 | 34.58 | JR97 | 36.3 | 8.5 |
| 3C 288a | 0.246 | 31.31 | 24.84 | 17.32 | d96 | … | 37.4 | 8.9 | |
| 3C 293 | 0.045 | … | 23.93 | 13.68 | S73 | 34.84 | ZB95 | 36.0 | 8.9 |
| 3C 296 | 0.0237 | 29.92 | 23.27 | 12.18 | M99 | … | 35.5 | 8.8 | |
| 3C 305 | 0.0411 | … | 23.32 | 13.68 | M99 | 33.41 | ZB95 | 36.0 | 8.7 |
| 3C 310a | 0.054 | 30.65 | 23.99 | 15.66 | M99 | … | 36.6 | 8.0 | |
| 3C 314.1a | 0.1197 | 30.79 | 22.77 | 17.91 | d96 | … | 36.6 | 7.8 | |
| 3C 315a | 0.1083 | … | 24.86 | 15.84c | LL84 | … | 36.8 | 8.7 | |
| 3C 317 | 0.0345 | 30.70 | 24.29 | 11.71 | G00 | 34.94 | ZB95 | 36.2 | 9.5 |
| 3C 338 | 0.0304 | 30.61 | 23.62 | 12.20 | S73 | 34.08 | ZB95 | 36.2 | 9.1 |
| 3C 346a | 0.162 | 32.45 | 25.36 | 16.98 | d96 | 35.35 | ZB95 | 36.9 | 8.8 |
| 3C 348a | 0.154 | 30.94 | 23.98 | 16.13 | E85 | 33.73 | T93 | 38.1 | 8.9 |
| 3C 386 | 0.017 | 32.24 | 22.24 | 12.21 | M99 | 33.45 | S96 | 35.4 | 8.5 |
| 3C 424a | 0.127 | 31.04 | 24.07 | 17.05b | ZB95 | … | 36.7 | 8.3 | |
| 3C 433a | 0.1016 | … | 23.33 | 14.82c | L85 | 35.34 | ZB95 | 37.1 | 9.1 |
| 3C 438a | 0.29 | 31.21 | 24.73 | 18.24 | d96 | 35.17 | ZB95 | 37.8 | 8.6 |
| 3C 442a | 0.0263 | 29.44 | 21.77 | 14.07 | M99 | 33.85 | ZB95 | 35.7 | 8.0 |
| 3C 449 | 0.0171 | 30.36 | 22.66 | 13.05 | M99 | 32.87 | K02 | 35.2 | 8.0 |
| 3C 465 | 0.0302 | 30.88 | 24.02 | 13.14 | S73 | 33.23 | M96 | 36.1 | 8.6 |
Notes for the table 1. : the sources for which the jet power is greater than the maximal jet power extracted from a rapidly spinning black hole with and ; : the -band magnitude is converted from the -band magnitude assuming (Fukugita, Shimasaku & Ichikawa, 1995); : the -band magnitude is converted from the -band magnitude assuming (Dunlop et al., 2003); Column (1): source name, Column (2): redshift, Column (3): optical core luminosity (W Å-1), Column (4): radio core luminosity at 5 GHz (W Hz-1), Column (5): rest frame -band magnitude, Column (6): references for R-band magnitude, Column (7): luminosity of narrow-lines H+[N ii] (W), Column (8): references for the line emission, Column (9): jet power estimated from total low-frequency radio luminosity (W), Column (8): the derived black hole masses
References: d96: de Koff et al. (1996), E85: Eales Eales (1985), G77: Godwin et al. (1977), G00: Govoni et al. (2000), JR97: Jackson & Rawlings (1997), LL84: citetll84, L85: Lilly, Longair & Miller (1985), M96: Mulchaey, Wilson, & Tsvetanovet (1996), M99: Martel, Baum & Sparks Martel, Baum & Sparks (1999), S73: Sandage (1973), S96: Simpson et al. (1996), T93: Tadhunter et al. (1993), V99: Verdoes Kleijn et al. (1999), V02: Verdoes Kleijn et al. (2002), ZB95: Zirbel & Baum (1995).
5 Results and discussion
The derived jet powers and black hole masses for 33 FR I galaxies are listed in Table 1. We searched the literature for flux data on the narrow emission lines H+[N ii]. For those where the flux of H+[N ii] is unavailable, we use [O iii] flux multiplying a factor 0.83 to convert to H+[N ii] flux as done by Zirbel & Baum (1995). We found 25 sources with narrow-line emission data.
5.1 Jet power versus black hole mass
As discussed in Sect. 4, the uncertainties in the jet power estimate are included in the factor in Eq. (2). We plot the relation between the jet power and black hole in Fig. 1 for . As discussed in Sect. 4, the maximal jet power extracted from a spinning black hole with and can be calculated for an ADAF surrounding the hole. The three-dimensional MHD simulations suggest the viscosity in the discs to be (Armitage, 1998), or (Hawley & Balbus, 2002). We adopt in our calculations, corresponding to , which is a conservative choice. The calculated maximal jet power is plotted in Fig. 1. We find that the jet power for more than one-third of the sources in the sample is greater than the maximal jet power calculated for (13 of 33 sources, hereafter referred to as high-jet-power sources, and the remainder as low-jet-power sources). For some FR I sources, their jet powers can be as high as . It indicates that if the Blandford-Znajek mechanism is the only one in operation then it would be unable to power the jets in these sources. In the case of , the relation between the jet power and black hole is plotted in Fig. 2. The jet power is about 30 times that for , which would greatly strengthen the conclusion that the Blandford-Znajek mechanism is unable to produce the jets in the high-jet-power sources. Furthermore, it would suggest that the mechanism may have difficulty powering any of the 3CR FR I sources. Anyway, hereafter we use, conservatively, in the estimates of jet power (values for the case can be evaluated by multiplying by ). The uncertainty in is therefore much greater than any uncertainty in unless which seems inconsistent with the MHD simulations (Armitage, 1998; Hawley & Balbus, 2002).
One possible explanation may be that the jets in these radio galaxies are not primarily accelerated by the magnetic field lines threading the spinning black holes, for example, they may be accelerated by the field lines of the accretion disc (Blandford & Payne, 1982), or by the combination of the two mechanisms. It has in fact been proposed that the jet is accelerated more efficiently by the field lines threading the accretion disc (Livio, Ogilvie & Pringle 1999; but see also more detailed calculations in Cao (2002)). Even if this were the case, it implies that almost all released gravitational energy of the accretion matter is carried away by the jets in those sources with for . For a high value of , for example, , the jet power can be as high as for some sources. It is hard to see how the accretion discs in these sources would remain in an ADAF state. However, we cannot easily rule out the possibility that ADIOS flows are present in these sources, if the accretion rates of the flows are close to the Eddington value and the flows extend to large radii (Blandford & Begelman, 1999). In this case, most of the mass and energy of the accreting gas may be carried away in the jet, and any optical emission from the accretion flow could be very faint.
Another possibility is that the accretion discs in these high-jet-power sources are not in ADAF state. Their accretion rates are in fact higher than the critical accretion rate . In this case, the accretion discs are expected to be the standard optically thick ones, and their jet power can be higher than the maximal jet power expected to be extracted by the Blandford-Znajek mechanism for ADAF cases. We note from Figs. 2 & 3 that the one object in our sample with a broad-line nucleus (3C386) is not one of the extreme high-jet-power sources, implying that standard accretion discs in high-jet-power FR I sources may be common in our sample, although we would need a mechanism to explain why they cannot easily be seen in the HST optical images.


5.2 Optical core properties as a function of redshift
The high-jet-power sources will also have significantly higher redshifts than the other sources because jet power is estimated from radio luminosity and radio luminosity correlates strongly with redshift in flux-limited samples like 3CR (see Fig. 3). The median redshift of the high-jet-power sources is 0.127, compared to 0.0235 for the low-jet-power sources, so the HST linear size limits on any optical core emission are times larger for the high-jet-power sources (see Fig. 4). Typically, therefore in low-jet-power sources, any compact optical cores have sizes kpc, whereas the corresponding limit for high-jet-power sources is kpc.
Note, also, that the objects with resolved optical cores (and hence only limits on their optical core emission in Table 1; See Sec. 2) are concentrated amongst the high-jet-power sources, as is 3C315 (see Sec. 2), the object with an elongated optical structure and no optical core. It seems like a large fraction of the high-jet-power, high-redshift sources have weak or absent cores, and evidence for optical emission extended on 0.15 kpc scales. It is not clear whether the extended optical cores of these objects is associated with an extended synchrotron component, or with host galaxy light. However, regardless, we can conclude that the true optical cores of a large-fraction of the high-jet-power sources may well be being obscured.
5.3 Correlation between radio core luminosity and total radio luminosity
In Fig. 5, we plot the relation between VLA radio core luminosity at 5 GHz and the total radio luminosity at 151 MHz. We find that a significant correlation between and , except two sources 3C28 and 3C314.1 have relatively lower core luminosity. The generalized Kendall’s test (ASURV, Feigelson & Nelson 1985) shows that the correlation is significant at the 99.98% level for the whole sample (the significant level becomes 99.99% for the sample subtracting two sources 3C28 and 3C314.1). The jet power estimated from the low-frequency radio luminosity represents the power of the jet averaged over a long period of time ( years), while the VLA core emission (typically corresponding to sub-arcsecond angular size) reflects the emission from the jet near the central engine which can obviously vary at a much shorter timescale ( years). The correlation between and indicates the jet power estimated from low-frequency radio luminosity is a reliable measure of the current jet power in most if not all the cases (e.g. 3C28 and 314.1). The key point here is that with these possible exceptions (which could, for example, be temporarily turned-off jets) the high-jet-power sources probably have high jet powers throughout their life times, and the physical model for how they are powered must account for this.

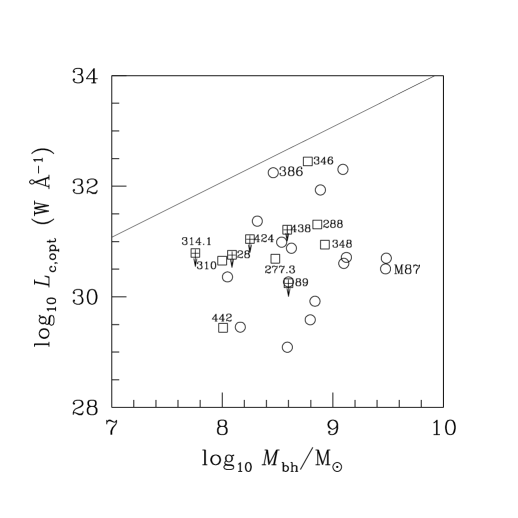
5.4 Optical core luminosity versus black hole mass
We plot the optical core luminosity versus black hole mass in Fig. 6. The observed optical core emission may be a combination of the synchrotron emission from the jet and the emission from the disc, if the emission from the disc has not been obscured. The optical core luminosity therefore sets an upper limit on the emission from the disc for unobscured cases. We convert the optical core luminosity to a bolometric luminosity by using (Kaspi et al., 2000)
| (10) |
which is valid for normal bright AGNs. We plot the line corresponding to (Ghisellini & Celotti (2001) proposed a diagonal line for the division of FR I and FR II galaxies). It is found that all sources are, as expected, well below this line, which indicates that most of these sources are accreting at very low accretion rates, assuming of course that the disc emission has not been obscured.
We note from the location of 3C386 in this plot, that some optically unobscured objects with standard accretion discs, and moderately high accretion rates, exist in the FR I population. We have argued in Sect. 5.2 that, if we could account properly for obscuration, a significant fraction, perhaps all, of the high-jet-power sources might well lie in a similar region of this plot. However, the strong correlation between the radio and optical core luminosities for the low-jet-power objects, and the restrictive limits the unresolved optical core places on any obscuring material (e.g. pc for M87), together imply that at least some of the 3CR FR Is have genuinely low accretion rates, and are unobscured.
5.5 Jet power versus optical core luminosity
The relation between the jet power and optical core luminosity is plotted in Fig. 7. Usually, the power in the jets of even radio-loud AGNs is only a fraction of their bolometric luminosity (e.g., Rawlings & Saunders 1991; Willott et al. 1999). We adopt a parameter to relate the jet power to its bolometric luminosity
| (11) |
Using Eqs. (10) and (11), we can calculate the relation between the optical core luminosity and the jet power for a given efficiency factor . The lines for different values of are plotted in Fig. 7.
Note, first, the location of 3C386, the one object in our sample where we definitely have an unobscured view of the nucleus. This lies in a similar region of the plot to FR II radio sources (e.g. Willott et al. 1999). The location of the high-jet-power sources at high values of is explicable if, as we have postulated in Sec. 5.2, they have obscured nuclei. The low-jet-power sources, which arguably are not obscured (Chiaberge, Capetti, & Celotti, 1999) seem to lie reasonably close to , which may be indicative of some difference between these objects and the population of radio sources with more powerful jets.

5.6 Jet power versus line luminosity
In Fig. 8 we plot the relation between jet power and the narrow-line luminosity. The generalized Kendall’s test (ASURV, Feigelson & Nelson 1985) shows that the correlation is significant at the 99.99% level for the whole sample. The linear regression by parametric EM Algorithm (ASURV) gives
| (12) |
for the whole sample but 3C348 is excluded (the dotted line in Fig. 8), and
| (13) |
for the low-jet-power sources (the solid line in Fig. 8), respectively. It is found that the high-jet-power FR I sources, except 3C348, lie along the same correlation defined by the low-jet-power FR I sources, which may imply that the narrow emission-line formation mechanisms are similar for both these two classes of the sources.

5.7 Black hole mass versus line luminosity
In Fig. 9 we compare the different behaviours of the high-jet-power FRIs and the low-jet-power FRIs in the narrow-line luminosity versus black hole mass plane. The mean value of the ratio of the narrow-line luminosity to black hole mass is for the high-jet-power sources, while it is for the low-jet-power sources. The separation of the two classes is clear, and is the direct result of the strong correlation between radio and narrow-line luminosities (Sec 5.6). There is no significant separation in terms of black hole masses: the mean values of the black hole masses are and for the high-jet-power and low-jet power sources respectively. A natural explanation is that the high emission line luminosity of these high-jet-power sources is mainly contributed by power re-processed from obscured optical nuclei. We therefore reach the same conclusion as Section 5.2 by independent means: high-jet-power FRI sources have relatively bright (i.e. as bright as 3C386), but obscured nuclei.
5.8 Size of the torus
The source 3C386 with an unobscured bright nucleus deviates significantly from the correlation between radio and optical core luminosities (see Fig. 5 in Chiaberge, Capetti, & Celotti (1999)). Most high-jet-power FRI sources in our sample have higher line luminosities than 3C386 (see Fig. 9), and one can infer that these high-jet-power FRI sources have similar or brighter intrinsic optical nuclei than 3C386. The radio core luminosities of these high-jet-power FRI sources are in the range of W Hz-1. If the intrinsic bright nuclei were unobscured in these sources, as is the case for 3C386, their locations in plane (Fig. 5 of Chiaberge, Capetti, & Celotti (1999)) would have definitely broken down the linear correlation derived by Chiaberge, Capetti, & Celotti (1999). This suggests that only the synchrotron radio and optical emission from the jets are detected in these high-jet-power FRI sources.
In the receding torus model, the inner radius of the torus is roughly at the dust evaporation radius pc (Netzer & Laor, 1993; Hill, Goodrich & DePoy, 1996). For NGC4151, it predicts an evaporation radius pc ( W, Kaspi et al., 2000), which is roughly consistent with the inner radius of the dust torus pc measured from a delay of the near-infrared light curve to the optical light curve (Minezaki et al., 2004). The evaporation radius of the dust torus in 3C386 is estimated to be pc ( W). The relative thickness of the torus is derived from the fraction of quasars in the 3CR sample (Hill, Goodrich & DePoy, 1996). We can estimate the total thickness of the dust tori in these high-jet-power FRI sources with obscured bright nuclei to be pc, because the intrinsic nuclei in these sources are believed to be as bright or brighter than 3C386. If the jet is inclined at a large angle, for example, , with respect to the line of sight, the emission from the accretion disc should be obscured by the torus while the synchrotron radio and optical emission from the jet outside the torus can still be detected by VLBI at pc scales or by HST at kpc scales. The emission at high energy bands (e.g., hard X-ray bands) from the nucleus may penetrate the obscuring material in the torus, and then the intrinsic properties of the nucleus can be explored directly from its emission at high energy bands. However, this is applicable only if the resolution is so high (e.g., pc) that the emission from the jet outside the torus can be subtracted from the emission of the nucleus.

6 Summary
If all 3CR FRI radio sources were powered by central engines operating in an ADAF mode, then the Blandford-Znajek mechanism would have insufficient power to generate the high radio luminosities of the most powerful FRI sources. Although it is possible to postulate models in which an ADIOS mode is maintained in such sources, this would still imply that, in some cases, a significant fraction of the Eddington luminosity of a black hole can be channelled into jets, with negligible emission at other wavebands.
A less contrived solution to the existence of ‘high-jet-power’ FRI sources is to postulate that, in these FRI sources at least, there are standard accretion discs. With the notable exception of 3C386, these accretion discs seem typically to be hidden (see e.g. Grimes et al. 2003 for discussion of why this might be the case). The large fraction of the high-jet-power FRI sources that lack any unresolved HST optical core is consistent with this idea, as in these cases the true nucleus is presumably hidden, and any optical synchrotron is coming from scales larger than the obscuring material. Also consistent with this idea is the strong correlation between narrow-line and radio luminosities which means that, at fixed black hole mass, high-jet-power FRI sources have intrinsically brighter optical cores than low-jet-power FRI sources, but these cores must be hidden
If the efficiency factor (see Equation 2) is nearer to than (as suggested by Blundell & Rawlings 2000) then these same arguments can probably be extended to include the majority of 3CR FRI radio galaxies. Perhaps then, essentially all of the 3CR FRIs have standard accretion discs. The case of M87 provides the best example of an object with a very low accretion rate, and no torus bigger than pc. However, these two factors alone are not sufficient to prove that M87 is accreting in a regime described by an ADAF or ADIOS model. Indeed the location of M87 in Fig. 3, suggests that, if , then its jets may also be too powerful for it to be plausibly associated with an ADAF mode of accretion unless there are powering mechanisms which dominate over the Blandford-Znajeck process.
We conclude that the idea that the physical cause of the division between FRI and FR II sources is that they have different modes of accretion (e.g. Ghisellini & Celotti 2001) is not supported by the radio and optical properties of 3CR FRI radio galaxies. This is in line with arguments made on the basis of individual objects such as the 3CR FRI 3C386 (Simpson et al. 1996) and the ‘radio-quiet’ FRI quasar E1821+643 (Blundell & Rawlings, 2001).
Acknowledgments
We are grateful for useful discussions with Jenny Grimes and Chris Simpson, and helpful comments by the referee, Neal Jackson. We thank Marco Chiaberge and Danilo Marchesini for drawing our attention to the superimposed star on the nucleus of 3C386. SR thanks PPARC for a Senior Research Fellowship. XC thanks the support from the Chinese Academy of Sciences and the Department of Astrophysics, Oxford for its hospitality during his stay there. The work is supported in part by the NSFC (No. 10173016; 10325314; 1033020) and NKBRSF (No. G1999075403). This research has made use of the NASA/IPAC Extragalactic Database (NED), which is operated by the Jet Propulsion Laboratory, California Institute of Technology, under contract with the National Aeronautic and Space Administration.
Note added in proof
After the final version of this paper was submitted, we heard that the nucleus of 3C386 is superimposed by a foreground star (D. Marchesini, private communication). However, a broad H line is obviously seen in the spectrum of this source (Simpson et al., 1996), The equivalent width of this broad line corresponding to the central compact core emission measured by Chiaberge et al. (1999) is , which implies that the optical continuum emission from the nuclei of 3C386 is not obscured and still quite bright, though it may not be so bright as observed due to the contamination by the superimposed star. The broad line and continuum emission could be variable as is common in low radio luminosity broad-line radio galaxies (BLRGs) like 3C390.3. This may be verified by further optical spectroscopic observations on 3C386.
References
- Armitage (1998) Armitage P.J., 1999, ApJ, 501, L189
- Armitage & Natarajan (1999) Armitage P.J., Natarajan P., 1999, ApJ, 523, L7
- Baum, Zirbel & O’Dea (1995) Baum S.A., Zirbel E.L., O’Dea C.P., 1995, ApJ, 451, 88
- Bicknell (1995) Bicknell G.V., 1995, ApJS, 101, 29
- Bicknell & Begelman (1999) Bicknell G.V., Begelman M.C., 1999, in The radio galaxy Messier 87, eds. H.-J. Röser & K. Meisenheimer, Berlin: Springer, p.235
- Blandford & Begelman (1999) Blandford R.D., Begelman M.C., 1999, MNRAS, 303, L1
- Blandford & Payne (1982) Blandford R.D., Payne D.G., 1982, MNRAS, 199, 883
- Blandford & Znajek (1977) Blandford R.D., Znajek R.L., 1977, MNRAS. 179, 433
- Blundell & Rawlings (2000) Blundell K.M., Rawlings S., 2000, AJ, 119, 1111
- Blundell & Rawlings (2001) Blundell K.M., Rawlings S., 2001, ApJ, 562, L5
- Cao (2002) Cao X., 2002, MNRAS, 332, 999
- Cao & Jiang (1999) Cao X., Jiang D.R., 1999, MNRAS, 307, 802
- Cao & Jiang (2001) Cao X., Jiang D.R., 2001, MNRAS, 320, 347
- Capetti & Celotti (1999) Capetti A., Celotti A., 1999, MNRAS, 304, 434
- Celotti, Padovani & Ghisellini (1997) Celotti, A., Padovani, P., Ghisellini, G. 1997, MNRAS, 286, 415
- Chang, Choi & Yi (2002) Chang H.Y., Choi C.S., Yi I., 2002, AJ, 124, 1948
- Chiaberge, Capetti, & Celotti (1999) Chiaberge M., Capetti A., Celotti A., 1999, A&A, 349, 77
- Chiaberge, Capetti & Celotti (2002) Chiaberge M., Capetti A., Celotti A., 2002, A&A, 394, 791
- de Koff et al. (1996) de Koff S., Baum S.A., Sparks W.B., Biretta J., Golombek D., Macchetto F., McCarthy P., Miley G.K., 1996, ApJS, 107, 621
- Dunlop et al. (2003) Dunlop J.S., McLure R.J., Kukula M.J., Baum S.A., O’Dea C.P., Hughes D.H., 2003, MNRAS, 340, 1095
- Eales (1985) Eales S.A., 1985, MNRAS 213, 899
- Fanaroff & Riley (1974) Fanaroff B.L., Riley J. M., 1974, MNRAS, 167, 31
- Feigelson & Nelson (1985) Feigelson E.D., Nelson P.I., 1985, ApJ, 293, 192
- Ford et al. (1994) Ford H.C., Harms R.J., Tsvetanov Z.I., Hartig G.F., Dressel, L.L., Kriss G.A., Bohlin R.C., Davidsen A.F., Margon B., Kochhar A.K., 1994, ApJ, 435, L27
- Fukugita, Shimasaku & Ichikawa (1995) Fukugita M., Shimasaku K., Ichikawa T., 1995, PASP 107, 945
- Ghisellini & Celotti (2001) Ghisellini G., Celotti A., 2001, A&A, 379, L1
- Ghosh & Abramowicz (1997) Ghosh P., Abramowicz M.A., 1997, MNRAS, 292, 887
- Godwin et al. (1977) Godwin J.G., Bucknell M.J., Dixon K.L., Green M.R., Peach J.V., Wallis R.E., 1977, Obs 97, 238
- Gopal-Krishna & Wiita (1988) Gopal-Krishna, Wiita P.J., 1988, Nature, 333, 49
- Govoni et al. (2000) Govoni F., Falomo R., Fasano G., Scarpa R., 2000, A&A 353, 507
- Grimes et al. (2003) Grimes J.A., Rawlings S., Willott C.J., MNRAS in press, astro-ph/0311366
- Harms et al. (1994) Harms R.J., Ford H.C., Tsvetanov Z.I., Hartig G.F., Dressel L.L., Kriss G.A., Bohlin R., Davidsen A.F., Margon B., Kochhar A.K., 1994, ApJ, 435, L35
- Hawley & Balbus (2002) Hawley, J.F., Balbus, S.A., 2002, ApJ, 573, 738
- Hill, Goodrich & DePoy (1996) Hill G.J., Goodrich R.W., & DePoy D.L., 1996, ApJ, 462, 163
- Inskip et al. (2002) Inskip K.J., Best P.N., Rawlings S., Longair M.S., Cotter G., Röttgering H.J.A., Eales S., 2003, MNRAS, 337, 1381
- Jackson & Rawlings (1997) Jackson N., Rawlings S., 1997, MNRAS, 286, 241
- Kaspi et al. (2000) Kaspi S., Smith P.S., Netzer H., Maoz D., Jannuzi B.T., Giveon U., 2000, ApJ, 533, 631
- Ledlow & Owen (1996) Ledlow M.J., Owen F.N., 1996, AJ, 112, 9
- Lawrence (1991) Lawrence A., 1991, MNRAS, 252, 586
- Lilly & Longair (1984) Lilly S.J., Longair M.S., 1984, MNRAS, 211, 833
- Lilly, Longair & Miller (1985) Lilly S.J., Longair M.S., Miller L., 1985, MNRAS, 214, 109
- Livio, Ogilvie & Pringle (1999) Livio M., Ogilvie G.I., Pringle J.E., 1999, ApJ, 512, 100
- Macchetto et al. (1997) Macchetto F., Marconi A., Axon D.J., Capetti A., Sparks W., Crane P., 1997, ApJ, 489, 579
- MacDonald & Thorne (1982) MacDonald D., Thorne K.S., 1982, MNRAS, 198, 345
- Mahadevan (1997) Mahadevan, R., 1997, ApJ, 477, 585
- Martel, Baum & Sparks (1999) Martel A.R., Baum S.A., Sparks W.B., 1999, ApJS 122, 81
- McLure & Dunlop (2002) McLure R.J., Dunlop J.S., 2002, MNRAS. 331, 795
- Minezaki et al. (2004) Minezaki, T., Yoshii, Y., Kobayashi, Y., Enya, K., Suganuma, M., Tomita, H., Aoki, T., Peterson, B., 2004, ApJ, 600, L35
- Mulchaey, Wilson, & Tsvetanovet (1996) Mulchaey J.S., Wilson A.S., Tsvetanov Z., 1996, ApJS, 102, 309
- Narayan (2002) Narayan R., 2002, in Lighthouses of the Universe: The Most Luminous Celestial Objects and Their Use for Cosmology, Proceedings of the MPA/ESO/, p. 405
- Netzer & Laor (1993) Netzer, H., Laor, A., 1993, ApJ, 404, L51
- Narayan & Yi (1995) Narayan R., Yi I., 1995, ApJ, 452, 710
- Rawlings & Saunders (1991) Rawlings S., Saunders R., 1991, Nature, 349, 138
- Reynolds et al. (1996) Reynolds C.S., Fabian A.C., Celotti A., Rees M.J., 1996, MNRAS. 283, 873
- Sandage (1973) Sandage A., 1973, ApJ 183, 711
- Simpson et al. (1996) Simpson C., Ward M., Clements D.L., Rawlings S., 1996, MNRAS, 281, 509
- Simpson, Ward & Wall (2000) Simpson C., Ward M., Wall J.V., 2000, MNRAS, 319, 963
- Tadhunter et al. (1993) Tadhunter C.N., Morganti R., di Serego-Alighieri S., Fosbury R.A.E., Danziger I.J., 1993, MNRAS, 263, 999
- Urry & Padovani (1995) Urry C.M., Padovani P., 1995, PASP, 107, 803
- Verdoes Kleijn et al. (1999) Verdoes Kleijn G.A., Baum S.A., de Zeeuw P.T., O’Dea C.P., 1999, AJ, 118, 2592
- Verdoes Kleijn et al. (2002) Verdoes Kleijn G.A., Baum S.A., de Zeeuw P.T., O’Dea C.P., 2002, AJ, 123, 1334
- Willott et al. (1999) Willott C.J., Rawlings S., Blundell K.M., Lacy M., 1999, MNRAS. 309. 1017
- Xu, Livio & Baum (1999) Xu C.,Livio M., Baum, S.A., 1999, AJ, 118, 1169
- Young, Wilson & Mundell (2002) Young A.J., Wilson A.S., Mundell C.G., 2002, ApJ, 579, 560
- Zirbel & Baum (1995) Zirbel E.L., Baum S.A., 1995, ApJ, 448, 521