CII, CI, and CO in the massive star forming region W3 Main
1 Introduction
We used the KOSMA 3m telescope to map the core of the Galactic massive star forming region W3 Main in the two fine structure lines of atomic carbon and four mid- transitions of CO and 13CO. In combination with a map of singly ionized carbon (Howe et al. 1991), and ISO/LWS data at the center position, these data sets allow to study in detail the physical structure of the photon dominated cloud interface regions (PDRs) where the occurance of carbon changes from Cii to Ci to CO. The physical and chemical processes in these layers are governed by FUV radiation. Depending on the induced chemistry, the critical densities, and energy levels of their transitions, the lines of [Cii], [Ci], and CO serve as probes to trace the different temperature and density regimes.
W3 Main is a well known site of high-mass star formation (e.g. Tieftrunk et al. 1998). It is associated with the W3 giant molecular cloud complex within the Perseus arm at a distance of 2.3 kpc (Georgelin & Georgelin 1976, cf. Imai et al. 2000). W3 Main comprises several Hii regions of different sizes and evolutionary stages, some of them hypercompact, possibly identifying the earliest stages of high-mass star formation (Tieftrunk et al. 1997).
2 Modelling the spatial structure of the FUV field
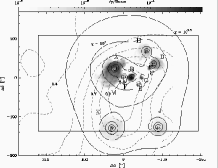
Figure 1 shows the positions of the 12 OB stars found in W3 Main (Tieftrunk et al. 1998). The most luminous source is IRS 2, identified as O5 star. The luminosity of IRS 5 at the map center position corresponds to a cluster of B0-type stars (Claussen et al. 1994). We have used the spectral types of the exciting OB stars to calculate the spatial large-scale variation of the far-UV field heating the molecular cloud. Figure 1 shows the resulting FUV distribution relative to that of [Cii] emission (Howe et al. 1991).
3 IRS 5 in W3 Main
3.1 KOSMA and ISO/LWS data
Figure 2 shows representative spectra at the center position IRS 5.
12CO
3–2 peak temperatures indicate an excitation temperature of
at least 50 K. A lower limit of the [Ci] excitation temperature of
122 K has been derived from the [Ci] 2-1/1-0 line ratio assuming a
calibration error of 20%. Column densities per beam
(0.84 pc) and the relative abundances of the three major gas phase
species CO, CI, and CII, are derived assuming LTE. At IRS 5, the
Cii:Ci:CO column density ratio is 18:8:74, i.e. most of the
gas-phase carbon is in CO, % is in Cii, and only less than
10% is in atomic carbon. The total H2 column density derived from
13CO 3–2 observations is cm-2
(Amag) within the beam which agrees well with the
result of Tieftrunk et al. (1998) derived from C18O observations.
![[Uncaptioned image]](/html/astro-ph/0312367/assets/x2.png)
Figure 2: Spectra at one representative position: IRS 5 in W3 Main. All spectra are on a common spatial resolution of (0.84 pc) and are plotted on the scale. 13CO and CI lines peak at the velocity of a dip in the 12CO spectra, indicating that the dip is due to a colder foreground component at about 38 (denoted by a vertical line). To estimate the line integrated 12CO intensity of the background source, we fitted a Gaussian to the high and low velocity parts of the 12CO spectra. The fit results are shown.
We combined the KOSMA data at IRS 5 with ISO/LWS data from the ISO data archive taken at the same position. Several fine structure lines of [Oiii], [Niii], and [Nii] were detected tracing the ionized medium, as well as lines of [Cii], [Oi], and four high- rotational transitions of CO tracing the neutral medium at the PDR cloud surfaces. Figure 3 shows the observed CO and 13CO fluxes together with the results of a homogeneous, non-LTE radiation transfer model. The detected line strengths indicate kinetic temperatures of more than 140 K and densities of more than cm-3.
![[Uncaptioned image]](/html/astro-ph/0312367/assets/x3.png)
Figure 3: Integrated CO intensities as a function of upper rotational quantum number for IRS 5 in W3 Main and CO cooling curves produced by a non-LTE radiative transfer model. Rotational transitions upto were observed with KOSMA, the high- transitions upto were observed with ISO/LWS.
3.2 Detailed PDR Modelling - First results
We have started to determine the physical structure of the PDR by detailed modelling using the FUV field previously derived. Here, we briefly describe first results obtained from modelling the emission at IRS 5 using the spherical Cologne PDR model (Störzer et al. 1996, 2000). Its basic free parameters are the clump surface density, its total mass, and the impinging FUV field. We kept the FUV field fixed at times the Draine field as derived from the contribution of all embedded OB stars. First results indicate a common solution for most ratios (see Figure 4). Future modelling will include the absolute line intensities and explore the possible importance of clumps of different masses (clump mass spectrum), and of pre-shielding by an embedding H2 interclump medium.
![[Uncaptioned image]](/html/astro-ph/0312367/assets/x4.png)
Figure 4: Results from the PDR model for an external FUV field of . Lines denote the observed line ratios at IRS 5 as a function of clump mass and clump surface density. The [Ci]/CO and [Ci]/13CO flux ratios indicate high volume densities of more than cm-3. The [Oi 145m/Oi 63m] ratio is larger than expected, probably due to optically thick [Oi] 63m emission and self-absorption due to the colder foreground material also responsible for the dips in the low- and mid- CO lines. All other five observed ratios indicate a common solution of about cm-3 and a clump mass of less than Msun in this preliminary analysis.