Keck Spectroscopy and Imaging of Globular Clusters in the Lenticular Galaxy NGC 524
Abstract
We have obtained Keck LRIS imaging and spectra for 29 globular clusters associated with the lenticular galaxy NGC 524. Using the empirical calibration of Brodie & Huchra we find that our spectroscopic sample spans a metallicity range of –2.0 [Fe/H] 0. We have compared the composite spectrum of the metal-poor ([Fe/H] –1) and metal-rich clusters with stellar population models in order to estimate the ages of the NGC 524 globular clusters. We conclude that the clusters are generally old, and are coeval at the 2 confidence level. To determine the mean [/Fe] ratios of the globular clusters, we have employed the Milone et al. -enhanced stellar population models. We verified the reliability of these models by comparing them with high S/N Galactic globular cluster spectra. We observe a weak trend of decreasing [/Fe] ratios with increasing metallicity in the NGC 524 clusters, the metal-poor cluster possess [/Fe]0.3, whilst the metal-rich clusters exhibit [/Fe] ratios closer to solar-scaled values. Analysis of the cluster system kinematics reveals that the full sample (excluding an outlying cluster) exhibits a rotation of around a position angle of , and a velocity dispersion of at a mean radius of 89′′ from the galaxy centre. Subdividing the clusters into metal-poor and metal-rich subcomponents (at [Fe/H] = –1.0), we find that the metal-poor (17) clusters and metal-rich (11) clusters have similar velocity dispersions ( and respectively). However, the metal-poor clusters dominate the rotation in our sample with 147, whilst the metal-rich clusters show no significant rotation (). We derive a virial and projected mass estimation for NGC 524 of between 4 and 13 1011 (depending on the assumed orbital distribution) interior to 2 effective radii of this galaxy.
keywords:
galaxies: individual: NGC 524 – galaxies: star clusters1 Introduction
The spectroscopic study of globular cluster (GC) systems has made great progress in the past few years. The availability of 10 metre class telescopes, and efficient spectrographs, has meant that it is now possible to obtain low-resolution spectra of individual GCs of sufficient quality to derive reliable abundance and age information (in addition to valuable kinematic information) out to Virgo cluster distances. However, such studies still only number a handful, and have largely focused on the rich cluster systems of giant elliptical galaxies (e.g. NGC 4486:[Cohen et al. (1998)] 1998; NGC 1399:[Kissler-Patig et al. (1998)] 1998; [Forbes et al. (2001)] 2001; NGC 4472:[Beasley et al. (2000)] 2000; [Cohen et al. (2003)] 2003, see also [Peng et al. (2003)] (2003) for a recent study of NGC 5128).
Such studies have afforded unique insights into both the individual properties of GC systems associated with ellipticals, and the relation between GCs and the formation of their host galaxies. The results of these previous works have shown that the GCs possess metallicities ranging from 1/400 to approximately solar values, with these most metal-rich GCs comparable to the integrated bulge starlight of their host galaxies. Moreover, within the uncertainties (which remain necessarily model-dependent), many of GCs in these galaxies appear old and coeval. Recent spectroscopic data (e.g. [Forbes et al. (2001)] 2001; [Larsen et al. (2003)] 2003) and IR imaging ([Kissler-Patig et al. (2002)] 2002; [Puzia et al. (2002)] 2002) have indicated the presence of young GCs in apparently otherwise undisturbed elliptical galaxies, suggesting complex formation histories for at least a subset of ellipticals.
The situation for disk galaxies is even less well known. Larsen et al. (2002) presented a spectroscopic study of a small sample of high S/N Sombrero galaxy (M104) GCs, and found that the clusters in this relatively luminous (MB = –21.8) Sa spiral appear old and coeval, similar to the Milky Way cluster system. These authors found alpha-to-iron ratios for the clusters of [/Fe] +0.4, typical of luminous galaxy spheroids (e.g. [Trager et al. (1998)] 1998). Recently, [Kuntschner et al. (2002)] (2002) have obtained high-quality spectra for 17 GCs in the nearby ( 10 Mpc) lenticular galaxy NGC 3115. Similar to the Sombrero GCs, the GCs in NGC 3115 generally appear old, although interestingly, [Kuntschner et al. (2002)] (2002) were able to demonstrate a spread in [/Fe] ratios amongst both the metal-rich and metal-poor GCs, indicative of multiple phases of GC formation.
These latter results are particularly intriguing, since we know that the Milky Way GCs are old (i.e. 8 Gyr, [Salaris & Weiss (2002)] 2002) and generally exhibit non-solar [/Fe] ratios ([Carney & Harris (2001)] 2001). Clearly few firm conclusions can be drawn from such a small and restricted sample, and more information is required with regards to late-type galaxies.
NGC 524 is an SA(rs)0 galaxy, dominating the small NGC 524 group some 28.2 Mpc distant [de Vaucouleurs et al. (1991)]. Its GC system was first studied in any detail by [Harris & Hanes (1985)] (1985), who identified a rich, and spatially extended system. In fact it possesses one of the richest GC systems known for an S0 galaxy, with 4430 950 GCs [Harris (1991)]. More recently, the GC system of NGC 524 has been studied with HST/WFPC2 by [Larsen et al. (2001)] (2001). From two pointings they identified a total of 617 GCs to a magnitude limit of 26. Employing the KMM test [Ashman et al. (1994)] these authors determined the GC colour distribution to be bimodal with peaks at = 0.98 and = 1.19 in the ratio 2:1. Using the colour-metallicity relation of [Kissler-Patig et al. (1998)] (1998), these peaks correspond to sub-populations with [Fe/H] –1.3 and –0.6.
In this paper, we present an analysis of the broad-band imaging and spectroscopy for GC candidates associated with this galaxy, the first such study to spectroscopically investigate the GC system of NGC 524.
This paper is ordered in the following way: in 2 we discuss the data acquisition and reduction procedures. Next, in 3, we derive metallicities from our integrated spectra, and compare line-strength indices of the clusters to stellar population models. In 4 we then investigate the kinematical properties of the cluster system and sub-populations, and derive dynamical mass estimates for NGC 524. Finally, we present a summary and our conclusions in 5.
2 Observations and Data Reduction
2.1 Photometry

Broad–band imaging of NGC 524 in the V, R and I filters was obtained at the Keck-I telescope in 1996, September 8th using the Low Resolution Imaging Spectrometer (LRIS; [Oke et al. (1995)] 1995). The LRIS instrument, equipped with a TEK CCD, is mounted on the Cassegrain focus providing a imaging scale and a field–of–view. The total exposure times were 630 secs in V, 330 secs in R and 300 secs in I. Seeing conditions were good, with a median of 0.6 arcsec. These data were reduced following standard procedures, using IRAF software. The reduced images were found to be flat to better than . Photometric calibration was performed using standard stars from [Landolt (1992)] (1992).
Selection of GC candidates from our LRIS multi-filter imaging was undertaken using the following selection criteria: 20.5 24, 0.5 2.0 and 0 1.0. The magnitude limits ensured that we selected the more luminous GCs (necessary for spectroscopy) whilst excluding bright foreground stars. The colour cuts covered the full range expected for GCs including photometric errors, whilst excluding extremely blue objects which were unlikely to be real GCs. After these selection criteria, we were left with a total of 245 GC candidates.
In Figure 2 we show the colour distribution of our 245 GC candidates in NGC 524 (open histogram) and those for which we have obtained LRIS spectra (filled histogram). The distribution shows a broad peak at 1.0, with possible enhancements at 0.9 and 1.1, similar to those seen in the HST data of [Larsen et al. (2001)] (2001). In an effort to obtain spectra of some very metal-rich GCs, we also selected a number of candidates at 1.8. These turned out to be bona fide GCs, although not with the high metallicities expected for these extremely red colours (see Section 3.1).

2.2 Spectroscopy
Spectra of GC candidates around NGC 524 were obtained with LRIS on the Keck-I telescope. Candidate selection was based on the imaging data, and was designed to cover a wide range of potential GC candidates. Observations consisted of two masks obtained on the nights of 1997 September 30th and October 1st. The two masks used the same setup and had comparable exposure times (i.e. 10,800 and 9,000 sec). The 600 l/mm grating used yielded a spectral resolution of 5.6Å, with a full wavelength range of 3640Å – 6200Å.
Data reduction was carried out using the REDUX software package developed by A. Phillips. Data reduction steps included trimming these data, bias-subtraction, flat-fielding, removal of any and distortions, and producing optimally sky-subtracted, 1-D spectra. Comparison lamp spectra of Mercury, Argon, Neon and Krypton were used for wavelength calibration. Spectra from the different nights were combined. Flux calibration was provided by the flux standard BD 284211 observed on the first night of the run.
In Table 2 we summarise the observational data for the objects for which we have obtained Keck spectra. The , & photometry derived from our 1996 LRIS observations were described in Section 2.1. Radial velocities and velocity uncertainties were measured from the spectra by cross-correlating against high S/N M31 GC templates (225-280) and (158-213) (using the nomenclature for the M31 GCs from [Huchra et al. (1991)] 1991 ), observed with the same instrumental set-up, using fxcor in iraf. The zero-points of these velocities were checked against 1.8Å resolution synthetic spectra [Vazdekis (1999)], broadened to the LRIS resolution. Of the 41 usable spectra obtained, 3 were Galactic stars, 9 were background galaxies and 29 bona fide GCs. Thus our magnitude and colour selection cuts have a contamination rate of about 30%.
| ID | R.A. | Dec. | V | S/N | |||
|---|---|---|---|---|---|---|---|
| (J2000) | (J2000) | (mag) | (mag) | (mag) | (kms-1) | (Å-1) | |
| K004 | 1:24:34.71 | 9:30:14.0 | 21.77 | 1.03 | 0.41 | 261340 | 25 |
| K005 | 1:24:35.29 | 9:31:09.0 | 21.90 | 1.26 | 0.58 | galaxy z=0.31 | … |
| K010 | 1:24:37.16 | 9:30:09.0 | 21.46 | 1.52 | 0.73 | star | … |
| K014 | 1:24:39.22 | 9:30:06.3 | 21.21 | 1.73 | 0.84 | galaxy z=0.31 | … |
| K015 | 1:24:40.50 | 9:29:08.5 | 22.43 | 1.03 | 0.41 | 265139 | 16 |
| K018 | 1:24:41.37 | 9:31:10.1 | 21.93 | 1.03 | 0.39 | 224374 | 23 |
| K023 | 1:24:42.89 | 9:30:04.9 | 22.39 | 0.75 | 0.44 | 226971 | 14 |
| K024 | 1:24:43.28 | 9:31:15.0 | 21.88 | 1.13 | 0.50 | 221949 | 14 |
| K029 | 1:24:43.68 | 9:30:06.1 | 22.16 | 1.16 | 0.47 | 222845 | 19 |
| K031 | 1:24:43.95 | 9:29:05.8 | 21.83 | 0.60 | 0.23 | galaxy z=0.13 | … |
| K033 | 1:24:44.49 | 9:31:40.5 | 21.92 | 1.80 | 0.39 | 277590 | 10 |
| K034 | 1:24:44.53 | 9:28:44.8 | 20.66 | 1.19 | 0.54 | galaxy z=0.34 | … |
| K036 | 1:24:45.03 | 9:30:26.0 | 22.17 | 1.11 | 0.32 | 238053 | 15 |
| K040 | 1:24:45.23 | 9:31:25.3 | 21.52 | 1.80 | 0.39 | 314171 | 14 |
| K043 | 1:24:45.59 | 9:31:47.8 | 21.92 | 1.05 | 0.44 | 273099 | 10 |
| K044 | 1:24:45.71 | 9:30:04.6 | 22.01 | 0.75 | 0.44 | 254885 | 21 |
| K051 | 1:24:46.38 | 9:30:31.0 | 22.40 | 0.27 | 0.32 | 212696 | 12 |
| K052 | 1:24:46.40 | 9:30:47.8 | 21.31 | 0.76 | 0.19 | 245384 | 24 |
| K054 | 1:24:46.73 | 9:29:19.9 | 21.84 | 1.85 | 0.68 | galaxy z=0.14 | … |
| K056 | 1:24:46.84 | 9:30:45.3 | 21.72 | 0.77 | 0.54 | 258459 | 14 |
| K057 | 1:24:47.11 | 9:30:56.6 | 20.93 | 1.39 | 0.51 | 258693 | 13 |
| K058 | 1:24:47.17 | 9:33:39.4 | 21.02 | 1.84 | 0.80 | star | … |
| K061 | 1:24:47.57 | 9:31:49.8 | 20.77 | 1.73 | 0.83 | 262963 | 12 |
| K065 | 1:24:48.36 | 9:32:39.4 | 21.67 | 1.16 | 0.45 | 250023 | 25 |
| K067 | 1:24:48.49 | 9:32:07.3 | 21.73 | 1.28 | 0.44 | 223082 | 11 |
| K069 | 1:24:48.95 | 9:31:54.3 | 20.97 | 1.33 | 0.56 | 2465110 | 10 |
| K074 | 1:24:49.46 | 9:30:34.6 | 21.72 | 1.02 | 0.40 | 270266 | 21 |
| K075 | 1:24:49.58 | 9:32:13.5 | 21.49 | 0.94 | 0.49 | galaxy z=0.06 | … |
| K076 | 1:24:49.59 | 9:31:33.2 | 20.77 | 1.43 | 0.39 | galaxy z=0.06 | … |
| K078 | 1:24:49.93 | 9:30:49.1 | 21.54 | 0.99 | 0.33 | 2644106 | 12 |
| K083 | 1:24:50.45 | 9:33:04.8 | 22.22 | 1.00 | 0.45 | 249852 | 16 |
| K085 | 1:24:50.70 | 9:33:27.4 | 22.15 | 1.02 | 0.44 | 245358 | 17 |
| K086 | 1:24:50.72 | 9:31:20.9 | 21.59 | 1.32 | 0.48 | 237541 | 20 |
| K089 | 1:24:50.90 | 9:34:05.1 | 21.25 | 1.02 | 0.47 | 257736 | 23 |
| K092 | 1:24:52.87 | 9:30:54.1 | 21.56 | 1.88 | 0.95 | 2131130 | 11 |
| K099 | 1:24:54.25 | 9:33:17.2 | 21.75 | 0.68 | 0.30 | galaxy z=0.19 | … |
| K104 | 1:24:55.72 | 9:33:02.6 | 22.24 | 1.07 | 0.43 | galaxy z=0.06 | … |
| K109 | 1:24:56.68 | 9:30:24.6 | 22.13 | 1.03 | 0.39 | 218386 | 14 |
| K110 | 1:24:57.58 | 9:33:15.8 | 22.18 | 0.85 | 0.38 | 2115107 | 19 |
| K113 | 1:25:00.47 | 9:31:55.7 | 22.33 | 0.99 | 0.45 | 209183 | 11 |
| K115 | 1:25:00.99 | 9:32:51.9 | 21.46 | 0.83 | 0.28 | star | … |
: suspect photometry due to dust.
Line-strength indices both in the Lick system (e.g. [Trager et al. (1998)] 1998 and references therein) and using the [Brodie & Huchra (1990)] (1990) definitions were measured from our flux-calibrated spectra. Due to the variable nature of the wavelength ranges in multi-slit spectra, the same set of indices were not measured for all spectra. Uncertainties in the indices were derived from the photon noise in the un-fluxed spectra following [Cardiel et al. (1998)] (1998). In general these were in good agreement with the uncertainties obtained from a Monte Carlo approach (e.g. [Kuntschner et al. (2002)] 2002). However, a few of the lowest S/N spectra yielded Monte Carlo errors which where significantly larger than the [Cardiel et al. (1998)] (1998) prescription, suggesting that in this regime other effects (such as flat-fielding) dominate the index uncertainties.
Our resulting calibrated spectra possessed S/N = 10–25 Å-1, corresponding to errors in the e.g. H index of 0.9–0.3 Å.
3 Spectroscopic Indices of the GCs
3.1 Metallicities
There were two approaches we considered in estimating the metallicities of the NGC 524 GCs from our integrated spectra. The empirical calibration of [Brodie & Huchra (1990)] (1990) was specifically designed to estimate metallicities for extragalactic GCs from low-resolution, and potentially low S/N spectra. Alternatively, stellar population models may be employed to derive metallicities either by assuming an age for the GCs (necessary due to the age–metallicity degeneracy), or by allowing age discrimination to come from Balmer indices.
The former technique is tied to Milky Way and Andromeda GC calibrators with independently derived metallicities, and has been employed with some success by a number of workers (e.g. [Brodie & Huchra (1991)] 1991; [Perelmuter et al. (1995)] 1995; [Bridges et al. (1997)] 1997; [Kissler-Patig et al. (1998)] 1998; [Barmby et al. (2000)] 2000; [Schroder et al. (2002)] 2002). This is, however, also an important drawback; the scarcity of solar, and lack of super-solar calibrators makes the metal-rich end poorly constrained (e.g. [Kissler-Patig et al. (1998)] 1998). The latter method has the great benefit of employing input stellar libraries based on both halo and disk stars which in principle extend to above solar values. However, the key disadvantage in these models is that, whilst halo stars are known to exhibit -element enhancement similar to Galactic GCs of all metallicities (e.g. [Carney & Harris (2001)] 2001), disk stars have scaled-solar abundances. This has complicated the interpretation of stellar population models for metallicity (and age) derivations. Moreover, the use of individual indices coupled with the Balmer lines generally requires reasonably high S/N data. In view of these issues, we have initially adopted the [Brodie & Huchra (1990)] (1990) calibration to derive metallicities for the NGC 524 GCs. Later, we examine the ages and abundance ratios of the NGC 524 GCs using SSP models.
| ID | CNR | G band | MgG | MgH | Mg2 | MgB | Fe52 |
|---|---|---|---|---|---|---|---|
| (Å) | (Å) | (Å) | (Å) | (mag) | (Å) | (Å) | |
| K004 | 1.090.57 | 3.130.56 | 1.030.36 | 1.050.39 | 0.0630.008 | 1.380.30 | 1.280.34 |
| K015 | 0.510.76 | 5.180.75 | 1.190.52 | 0.800.55 | 0.0640.011 | 1.800.43 | 1.260.49 |
| K018 | –4.250.67 | 3.220.58 | –1.310.41 | 1.420.42 | –0.0080.008 | –0.190.34 | 0.240.38 |
| K023 | 1.630.73 | 2.930.77 | 1.900.54 | 0.300.59 | 0.0670.012 | 1.660.46 | 1.660.51 |
| K024 | 5.420.68 | 6.010.76 | 0.420.54 | 7.880.51 | 0.2060.011 | 2.710.48 | 3.590.47 |
| K029 | 3.480.67 | 7.000.63 | –0.250.45 | 4.100.44 | 0.2980.009 | 5.240.38 | 2.950.40 |
| K033 | 0.640.85 | 1.980.91 | 3.300.75 | –0.650.84 | 0.1360.017 | –0.170.70 | 2.260.76 |
| K036 | 9.970.58 | 5.680.76 | 0.610.56 | 6.300.53 | 0.3060.012 | 4.780.49 | 4.820.49 |
| K040 | 6.150.60 | 5.190.68 | 2.680.52 | 1.500.56 | 0.1630.011 | 1.560.44 | 3.290.50 |
| K043 | –2.071.00 | 6.731.12 | 0.371.03 | 3.930.99 | 0.2570.021 | 10.320.57 | 7.440.85 |
| K044 | –2.710.60 | 2.790.56 | 0.960.42 | 0.670.45 | 0.0490.009 | 0.690.35 | 1.390.40 |
| K051 | 0.830.79 | 2.890.83 | 0.370.66 | 1.020.72 | 0.0840.014 | 2.760.58 | 2.640.65 |
| K052 | –2.040.52 | 2.970.49 | 1.620.38 | 0.510.42 | 0.0270.008 | 1.790.31 | –0.390.39 |
| K056 | –0.150.73 | 3.120.66 | –3.730.63 | 3.340.58 | 0.0540.012 | –2.240.52 | –0.220.57 |
| K057 | 7.350.90 | 3.690.76 | 3.720.57 | 2.170.61 | 0.2330.013 | 4.990.48 | 2.280.57 |
| K061 | –1.190.67 | 0.811.05 | 1.380.66 | 1.220.78 | 0.0900.015 | 3.190.52 | 0.670.70 |
| K065 | 1.940.49 | 6.490.47 | 1.030.38 | 2.470.39 | 0.2160.008 | 3.540.34 | 3.930.34 |
| K067 | –6.221.00 | 1.901.09 | 3.510.79 | 4.310.86 | 0.0740.018 | 1.580.71 | 5.810.75 |
| K069 | –5.610.97 | 7.680.91 | 6.540.69 | 0.610.78 | 0.2000.017 | 3.670.58 | 2.610.71 |
| K074 | –1.540.59 | 3.580.55 | 2.040.42 | 1.620.45 | 0.1180.009 | 1.650.35 | 0.200.42 |
| K078 | –1.900.99 | 5.511.00 | 5.640.76 | 0.140.91 | 0.1190.018 | –1.620.72 | 7.810.79 |
| K083 | 4.100.71 | 6.350.71 | 0.570.54 | 1.850.55 | 0.1740.011 | 3.630.45 | 1.540.52 |
| K085 | 4.340.63 | 1.760.73 | –0.120.50 | 0.400.52 | 0.1290.010 | 1.650.43 | 1.930.46 |
| K086 | 0.050.59 | 4.880.56 | 2.720.41 | 0.590.46 | 0.0920.009 | 1.930.35 | 0.450.41 |
| K089 | 1.090.54 | 5.340.52 | 2.520.38 | 1.160.41 | 0.1400.008 | 2.260.32 | 2.030.35 |
| K092 | –8.441.07 | 1.260.96 | 4.610.64 | 0.290.75 | 0.1160.015 | 0.580.61 | 0.900.74 |
| K109 | 9.730.49 | 3.290.67 | –2.700.62 | 3.750.56 | 0.0830.012 | 0.310.53 | 3.450.56 |
| K110 | –1.950.78 | 4.700.71 | 1.580.44 | –0.890.50 | 0.0500.010 | 0.220.39 | 0.480.42 |
| K113 | –3.691.06 | 5.480.90 | 7.230.63 | 3.370.72 | 0.2590.015 | 2.020.59 | 3.310.63 |
To employ the metallicity calibration of [Brodie & Huchra (1990)] (1990), we have measured the line–strength indices of the NGC 524 GCs using the definitions given in their paper. For our metallicity determinations we have used seven indices calibrated by [Brodie & Huchra (1990)] (1990), these are CNR, G band, MgG, MgH, Mg2, MgB and Fe52. We did not use indices bluewards of CNR (e.g. CNB, , H+K), since the majority of the spectra do not reach to these shorter wavelengths. Moreover, we did not include Na D ( 5890 Å) since this index was severely affected by sodium sky lines (see [Larsen & Brodie (2002)] 2002). We have opted to leave our data in their ’natural’ resolution ( 5.6Å). Any systematic differences due to the differing resolutions of these data and those of [Brodie & Huchra (1990)] (1990) are expected to be small (e.g. [Larsen & Brodie (2002)] 2002).
These ’raw’ index measurements of the NGC 524 GCs are given in Table 4 along with their associated photon error. The individual and mean metallicities for the NGC 524 GCs using the [Brodie & Huchra (1990)] (1990) calibration are listed in Table 6. The uncertainties on these mean metallicities were determined using the correction to the mean metallicity estimates as discussed in [Larsen & Brodie (2002)] (2002). Note that since the [Brodie & Huchra (1990)] (1990) calibration is tied to the [Zinn & West (1984)] (1984) scale, all metallicities derived using this calibration are given in [Zinn & West (1984)]’s (1984) [Fe/H].
| ID | CNR | G band | MgG | MgH | Mg2 | MgB | Fe52 | [Fe/H] |
|---|---|---|---|---|---|---|---|---|
| K004 | –0.920.47 | –1.250.38 | –1.670.43 | –1.470.50 | –1.580.35 | –1.520.51 | –1.340.64 | –1.400.08 |
| K015 | –1.070.49 | –0.390.42 | –1.590.46 | –1.560.52 | –1.570.35 | –1.300.53 | –1.350.67 | –1.250.15 |
| K018 | –2.160.48 | –1.210.38 | –2.700.44 | –1.340.50 | –2.290.35 | –2.310.52 | –1.950.64 | –1.990.18 |
| K023 | –0.790.48 | –1.330.43 | –1.270.47 | –1.740.52 | –1.540.36 | –1.380.54 | –1.120.67 | –1.320.10 |
| K024 | 0.240.48 | –0.030.42 | –1.940.47 | 1.110.51 | –0.160.35 | –0.820.54 | 0.070.66 | –0.230.31 |
| K029 | –0.300.48 | 0.430.39 | –2.240.45 | –0.350.50 | 0.750.35 | 0.610.53 | –0.340.65 | –0.160.34 |
| K033 | –1.030.50 | –1.710.46 | –0.610.53 | –2.070.56 | –0.860.38 | –2.300.60 | –0.760.75 | –1.310.24 |
| K036 | 1.680.47 | –0.170.42 | –1.850.48 | 0.490.52 | 0.830.36 | 0.340.55 | 0.850.67 | 0.300.37 |
| K040 | 0.450.47 | –0.390.40 | –0.900.47 | –1.310.52 | –0.590.35 | –1.430.54 | –0.120.67 | –0.610.21 |
| K043 | –1.680.51 | 0.300.52 | –1.970.61 | –0.420.59 | 0.340.40 | 3.950.57 | 2.630.78 | 0.370.80 |
| K044 | –1.820.47 | –1.390.38 | –1.700.44 | –1.600.50 | –1.720.35 | –1.870.52 | –1.280.65 | –1.630.07 |
| K051 | –0.990.49 | –1.350.44 | –1.970.50 | –1.480.54 | –1.380.36 | –0.790.57 | –0.520.71 | –1.250.16 |
| K052 | –1.670.47 | –1.310.36 | –1.390.44 | –1.660.50 | –1.940.35 | –1.310.52 | –2.310.64 | –1.630.11 |
| K056 | –1.230.48 | –1.250.40 | –3.720.49 | –0.640.52 | –1.670.36 | –3.280.55 | –2.210.69 | –1.940.37 |
| K057 | 0.820.50 | –1.020.42 | –0.400.48 | –1.070.53 | 0.100.36 | 0.460.55 | –0.740.69 | –0.250.25 |
| K061 | –1.480.48 | –2.150.50 | –1.510.50 | –1.410.55 | –1.320.37 | –0.560.55 | –1.700.73 | –1.440.17 |
| K065 | –0.710.47 | 0.190.36 | –1.660.44 | –0.960.50 | –0.070.35 | –0.370.52 | 0.280.63 | –0.460.22 |
| K067 | –2.570.51 | –1.730.51 | –0.510.54 | –0.270.57 | –1.470.38 | –1.420.60 | 1.500.74 | –1.070.45 |
| K069 | –2.440.51 | 0.750.46 | 1.010.51 | –1.620.55 | –0.220.38 | –0.290.57 | –0.550.73 | –0.440.44 |
| K074 | –1.560.47 | –1.070.37 | –1.200.45 | –1.260.50 | –1.040.35 | –1.380.52 | –1.970.65 | –1.300.10 |
| K078 | –1.640.51 | –0.250.49 | 0.550.53 | –1.790.58 | –1.030.38 | –3.000.61 | 2.890.76 | –0.730.63 |
| K083 | –0.130.48 | 0.130.41 | –1.870.47 | –1.180.52 | –0.480.35 | –0.310.54 | –1.190.67 | –0.670.24 |
| K085 | –0.070.48 | –1.790.41 | –2.180.46 | –1.700.51 | –0.930.35 | –1.380.54 | –0.960.66 | –1.290.23 |
| K086 | –1.180.47 | –0.520.38 | –0.880.44 | –1.630.51 | –1.300.35 | –1.240.52 | –1.830.65 | –1.170.14 |
| K089 | –0.920.47 | –0.320.37 | –0.980.44 | –1.430.50 | –0.820.35 | –1.060.52 | –0.900.64 | –0.890.11 |
| K092 | –3.010.52 | –1.980.47 | 0.030.50 | –1.740.55 | –1.060.37 | –1.930.58 | –1.560.74 | –1.570.34 |
| K109 | 1.590.47 | –1.180.40 | –3.290.49 | –0.490.52 | –1.380.36 | –2.060.56 | –0.030.69 | –1.010.51 |
| K110 | –1.650.49 | –0.600.41 | –1.410.45 | –2.150.51 | –1.710.35 | –2.110.53 | –1.810.65 | –1.600.18 |
| K113 | –2.040.52 | –0.260.46 | 1.370.49 | –0.630.54 | 0.360.37 | –1.190.57 | –0.110.70 | –0.300.39 |

We show a histogram of the mean spectroscopic metallicities derived for the NGC 524 GCs (last column of Table 6) in Figure 4. Using the [Brodie & Huchra (1990)] (1990) calibration, our sample of 29 GCs spans a metallicity range of –2.0 [Fe/H] 0.4. The high metallicities of the two most metal-rich GCs shown in Figure 4 are possibly overestimates. These are our lowest S/N spectra (reflected in their large uncertainties in Table 6), and the [Brodie & Huchra (1990)] (1990) calibration for Mg2 and MgH over-predicts [Fe/H] (with respect to stellar population models) at high metallicities [Kissler-Patig et al. (1998)]. The distribution appears bimodal with peaks at approximately [Fe/H] –1.40 and [Fe/H] –0.4. However, not only is the significance of this bimodality rather low due to small number statistics, but also there is a bias inherent in our spectroscopic sample since we deliberately targeted metal-poor and metal-rich clusters for study. An unweighted mean of the metallicities shown in Figure 4 yields a mean metallicity of [Fe/H]=–0.97, with a dispersion of 0.62 dex.
The two vertical arrows indicate the positions of the mean metallicities of the metal-poor and metal-rich Milky Way GC subpopulations at [Fe/H]=–1.62 and –0.61. These were derived by applying the homoscedastic KMM test [Ashman et al. (1994)] to the GC metallicities in the February 2003 version of the [Harris (1996)] (1996) catalogue∗*∗*http://physun.physics.mcmaster.ca/ harris/mwgc.dat. From Figure 4 alone we may conclude the metallicity distribution of the NGC 524 GCs is similar to that of the Milky Way, although the metallicity distribution for the NGC 524 GCs appears 0.15 dex more metal-rich. We also appear to be missing some of the most metal-poor GCs seen in the Galaxy, which is probably a result of our colour selection criteria.
Four of our spectral sample of GCs (K033, K040, K061 & K092) possess very red colours (V–I 1.7), and were selected from our initial catalogue as being candidate high-metallicity GCs. However, whilst our radial velocity measurements confirm their GC status, the spectroscopic metallicities of these GCs indicate that they have significantly less than solar metallicity (e.g. see Table 6). Their spectroscopic metallicities are in disagreement with empirical colour-metallicity relations, the flattest of which [Kissler-Patig et al. (1998)] predicts [Fe/H] +1.0 for such red colours.
All of these GCs lie within 1 arcminute of the galaxy centre, and a plot of colour versus galactocentric radius for the full Keck sample reveals a mean of 1.0, except interior to 1 arcminute, when the mean colour jumps to 1.5. This suggests that either reddening by dust, or possibly the high galaxy background at small radii is affecting the colours.
[Sil’chenko (2000)] (2000) identified a slightly inclined (by 20 degrees) ring of dust and gas in the centre of NGC 524, approximately 20 arcseconds ( 3 kpc) in radius. This encompasses the projected radius of the innermost GC (K061), with K033 and K040 in close proximity. GC K092 is slightly more distant, at a projected radius of 50 arcseconds ( 8 kpc) from the centre of NGC 524. We thus conclude that the very red colours of these four GCs are likely affected by dust. This finding emphasises the importance of spectroscopic indices in determining accurate metallicities for GCs in galaxies likely to host significant amounts of dust.
3.2 Metallicity and Age Constraints using Stellar Population Models
It can be seen in Table 6 that the uncertainties in the individual indices for the majority of the GCs are relatively large, which impacts severely on our ability to constrain ages and abundance ratios for the GCs. Therefore, in addition to investigating individual clusters, we have co-added the NGC 524 GCs into a metal-rich and metal-poor “composite” GC, taking the separation between sub-populations as [Fe/H] = –1, as indicated by e.g. Figure 4. The spectra of our composite metal-rich and metal-poor GCs are shown in Figure 8.
In order to examine the metallicities and ages of the NGC 524 GCs, we have compared Lick indices measured for the NGC 524 GCs with simple stellar population (SSP) models. We measured Lick indices for the individual and composite NGC 524 GCs using the index definitions given in [Trager et al. (1998)] (1998). These have been supplemented by measurements of the higher-order H and H Balmer lines as defined by [Worthey & Ottaviani (1997)] (1997). To provide a first-order correction to the Lick system resolution, we have broadened our data to a FWHM of 8–11 Å using a wavelength-dependent Gaussian kernel. The Lick indices and the respective uncertainties for the NGC 524 GCs are listed in Table 8.
| ID | Mg2 | Mg | Fe5270 | Fe5335 | H | H | H |
|---|---|---|---|---|---|---|---|
| (mag) | (Å) | (Å) | (Å) | (Å) | (Å) | (Å) | |
| K004 | 0.066 0.008 | 1.70 0.30 | 1.36 0.34 | 1.86 0.39 | 2.42 0.30 | –0.90 0.56 | 5.38 0.63 |
| K015 | 0.067 0.011 | 2.22 0.43 | 1.31 0.49 | 1.80 0.55 | 2.47 0.43 | –3.29 0.83 | 0.99 0.86 |
| K018 | –0.005 0.008 | 0.13 0.35 | 0.29 0.39 | 1.60 0.43 | 2.83 0.32 | –3.69 0.62 | 5.48 0.63 |
| K023 | 0.070 0.012 | 1.88 0.46 | 1.76 0.52 | 4.04 0.56 | 3.81 0.41 | –2.39 0.82 | 1.41 0.84 |
| K024 | 0.209 0.011 | 3.03 0.45 | 3.55 0.47 | 3.10 0.53 | 2.22 0.43 | –6.77 0.85 | –1.63 0.99 |
| K029 | 0.301 0.009 | 5.56 0.34 | 3.00 0.38 | 4.01 0.42 | 1.26 0.36 | –7.37 0.80 | –0.48 0.92 |
| K033 | 0.129 0.016 | 0.15 0.71 | 2.31 0.71 | 1.53 0.85 | 3.78 0.49 | 0.09 0.91 | 2.21 1.00 |
| K036 | 0.309 0.011 | 5.10 0.44 | 4.77 0.47 | 2.39 0.56 | 2.62 0.44 | –3.89 0.90 | –9.75 1.25 |
| K040 | 0.166 0.011 | 1.88 0.46 | 3.35 0.49 | 4.25 0.53 | 1.49 0.43 | –0.54 0.75 | –4.86 0.99 |
| K043 | 0.260 0.021 | 10.74 0.60 | 7.59 0.97 | 6.80 0.89 | 2.96 0.91 | –5.14 0.84 | –4.36 0.82 |
| K044 | 0.052 0.009 | 1.01 0.36 | 1.55 0.40 | 1.20 0.46 | 1.83 0.34 | –1.13 0.58 | 3.30 0.60 |
| K051 | 0.111 0.014 | 4.18 0.54 | 2.60 0.62 | 3.73 0.69 | 1.84 0.61 | 1.53 0.86 | –9.10 1.22 |
| K052 | 0.030 0.008 | 2.01 0.32 | –0.44 0.39 | –1.09 0.45 | 2.57 0.31 | 0.81 0.50 | 3.23 0.54 |
| K056 | 0.057 0.012 | –1.92 0.53 | –0.17 0.56 | 2.35 0.59 | 1.50 0.46 | –6.70 0.88 | 0.66 0.86 |
| K057 | 0.236 0.012 | 5.01 0.46 | 2.24 0.56 | 1.56 0.65 | 3.52 0.44 | –2.62 0.96 | 0.90 1.00 |
| K061 | 0.193 0.014 | 5.11 0.50 | 0.73 0.67 | 4.79 0.65 | 2.52 0.53 | 5.39 1.00 | 6.04 0.89 |
| K065 | 0.219 0.008 | 4.06 0.31 | 3.99 0.34 | 3.74 0.38 | 1.75 0.30 | –3.84 0.60 | –0.92 0.63 |
| K067 | 0.077 0.018 | 1.90 0.71 | 5.66 0.72 | –1.29 0.98 | 1.28 0.71 | –4.41 1.26 | –1.12 1.21 |
| K069 | 0.203 0.016 | 3.99 0.62 | 2.66 0.70 | 5.60 0.75 | 4.09 0.56 | –5.26 1.40 | –8.82 1.22 |
| K074 | 0.121 0.009 | 1.97 0.36 | 0.23 0.42 | 1.50 0.46 | 1.23 0.34 | 0.04 0.56 | 2.73 0.63 |
| K078 | 0.122 0.018 | –1.30 0.82 | 7.86 0.69 | 4.14 0.90 | 1.78 0.63 | –3.23 1.23 | 1.10 1.21 |
| K083 | 0.177 0.011 | 3.95 0.43 | 1.60 0.50 | 1.65 0.55 | 2.03 0.39 | –2.96 0.86 | –2.97 1.07 |
| K085 | 0.132 0.010 | 1.87 0.42 | 1.98 0.46 | 1.91 0.51 | 1.04 0.42 | 0.18 0.71 | –3.07 0.92 |
| K086 | 0.095 0.009 | 2.25 0.36 | 0.51 0.41 | 1.44 0.47 | 1.64 0.36 | –2.13 0.62 | –1.24 0.73 |
| K089 | 0.143 0.008 | 2.68 0.32 | 2.08 0.36 | 1.91 0.40 | 3.11 0.31 | –2.93 0.60 | 0.62 0.66 |
| K092 | 0.119 0.015 | 0.90 0.62 | 0.96 0.66 | 0.18 0.79 | 1.40 0.52 | 4.71 0.84 | 2.77 0.69 |
| K109 | 0.086 0.012 | 0.54 0.51 | 3.50 0.54 | 6.40 0.57 | 0.37 0.45 | –2.39 0.71 | –8.18 1.07 |
| K110 | 0.053 0.010 | 0.54 0.39 | 0.53 0.43 | 0.11 0.49 | 3.31 0.37 | –1.36 0.77 | 2.72 0.84 |
| K113 | 0.262 0.015 | 2.44 0.62 | 3.37 0.64 | 3.32 0.73 | 3.54 0.53 | –7.36 1.05 | 1.42 1.34 |
| Metal–poor | 0.065 0.004 | 1.52 0.17 | 0.82 0.19 | 1.13 0.20 | 2.14 0.19 | –1.31 0.30 | 2.19 0.28 |
| Metal–rich | 0.213 0.006 | 4.19 0.21 | 3.09 0.22 | 2.77 0.24 | 2.13 0.22 | –4.09 0.49 | –2.52 0.50 |
For this analysis, we have used the SSP models of [Maraston & Thomas (2000)] (2000). These are our models of choice since they cover the expected age–metallicity parameter space of the NGC 524 GCs, and have also been shown to adequately reproduce the ages and metallicities of both Galactic globular clusters [Maraston & Thomas (2000)], and LMC star clusters over a wide age range [Beasley et al. (2002)]. The evolutionary synthesis models of [Maraston & Thomas (2000)] (2000) deal with post-main sequence stellar evolution using the Fuel Consumption Theorem [Renzini & Buzzoni (1986)]. The TP-AGB phases are calibrated upon observations of star clusters in the Magellanic Clouds, and adopt classical, non-overshooting stellar tracks [Cassisi et al. (1998)]. These models span a metallicity range of –2.25 [Fe/H] +0.67, and an age range from 30 Myr to 15 Gyr, although here we only consider models 0.5 Gyr.


We have first compared different metallicity-sensitive Lick indices measured from our data with the [Maraston & Thomas (2000)] SSP models. This provides both a test of the SSP models’ ability to describe the data, and gives us an insight into the internal consistency of these spectroscopic data. This latter point is especially important since we have no repeat observations of these clusters and, as discussed in Section 3.1, for relatively low S/N spectroscopic data uncertainties in flat-fielding and sky-subtraction can become a dominant source of error.
We show in Figure 10 the NGC 524 data compared to the SSP models for the commonly used Mg2, Fe5270, Fe5335 and the composite [MgFe] index defined by [González (1993)] (1993). To illustrate the importance of our error estimates when comparing to the SSP models, we have split our spectroscopic sample into ’high’ S/N and ’low’ S/N groups at S/N 15, yielding 14 GCs in the high S/N group. The cut at S/N 15 was chosen such that the index error distributions were Gaussian about their expected mean. In Figure 10 these are represented by filled circles (high S/N GCs) and open circles (low S/N GCs).
These data, shown in Figure 10, exhibit varied behaviour depending upon the combination of indices used, but more importantly, upon the quality of the data. In all cases, not only does the higher S/N data show smaller scatter (as expected, and indicated by the correspondingly smaller error bars) but also exhibit Gaussian uncertainties, whereas the poorer quality data shows indications of a bias towards larger index values. This is particularly true of GC K043 which appears as an outlier in all four panels of Figure 10 and has the lowest S/N of the sample.
Concentrating solely on the higher S/N data, we find that the models (plotted such that they are effectively degenerate in age and exhibit only a metallicity sequence) reproduce the data very well. This is also the case for our composite metal-poor and metal-rich GCs. There is a suggestion of a systematic offset in the Mg b – Mg2 grid, since the composite GCs lie slightly above the grids, although the offset is not large.
For comparison purposes, we also show the position of the central nuclear line-strengths of NGC 524 (through a standard 1.4 4′′ aperture), taken from [Trager et al. (1998)] (1998). Two of the GCs in Figure 10 appear to have metallicities similar to that of NGC 524 itself. In principle, [/Fe] ratios may be derived from these plots, but we defer further discussion of this subject to the next section.
For the rest of this analysis, we concentrate on the 14 GCs which have higher S/N. In Figure 12 we compare our data with the [Maraston & Thomas (2000)] (2000) models, for the Fe (Fe5270 + Fe5335)/2, Mg2, H, H and H indices, and the combined [MgFe] index. To assist in our interpretation of the grids, an additional metallicity interval at [Fe/H] = –0.84 has been included in the models shown in Figure 12, by linear interpolation between the [Fe/H] = –1.35 and –0.33 lines.
It is clear that the individual data-points for the GCs populate a large area of the SSP grid parameter space. In the lower two panels of Figure 12 the distribution in H is broadly consistent with the observational errors following the old-aged loci of the grids. The H index also behaves similarly; however it is clear that we can only measure H poorly. We have also plotted the nuclear line-strengths of NGC 524 itself, taken from [Trager et al. (1998)] (1998), which indicate an old, metal-rich stellar system.
To tighten constraints on the ages of the GCs, we show the positions of our composite metal-poor and metal-rich GCs in Figure 12. We find that from the H and H indices, the metal rich composite GC appears somewhat younger than the metal-poor GC. The difference varies between the different age diagnostics, but is in the range 2–5 Gyr at 2, and is model dependent. Needless to say, this is consistent with the GCs being coeval (and old) in these current data.
In summary, the individual S/N of the GCs are generally too low to place constraints upon individual GC ages. Therefore we have co-added the individual spectra (separated by metallicity) and find that these composite NGC 524 GCs have line-strengths consistent with old stellar populations. The metal-poor and metal-rich sub-populations are old and coeval at the 2 level of confidence.
3.3 Abundance ratios
It has been known for some time that luminous elliptical galaxies exhibit non-solar abundance ratios from their integrated light (e.g. [O’Connell (1976)] 1976; [Peletier (1989)] 1989; [Worthey et al. (1992)] 1992). Integrated light studies also suggest that GCs associated with both ellipticals (NGC 1399: [Kissler-Patig et al. (1998)] 1998; [Forbes et al. (2001)] 2001) and spirals (M 31: [de Freitas Pacheco (1997)] 1997; the Sombrero: [Larsen et al. (2002)] 2002; the Milky Way: [Borges et al. (1995)] 1995 and see later this section) also exhibit similar abundance patterns.††††††Note that Trager et al. (2000a) and several other authors have argued that [Mg/Fe] 0 should be viewed as a suppression in Fe rather than any real “-element enhancement”

To assess the [/Fe] ratios in our data, following [Larsen et al. (2002)] (2002) we have used the “-enhanced” models of [Milone et al. (2000)] (2000), who present a calibration of the Mg2 and TiO (7464) indices (the latter not measured in our spectra), as a function of [Fe/H] and [/Fe] for SSP models. These models rely on the fact that the Mg2 and Fe indices should trace [Mg/H] and [Fe/H] differently, thereby providing a diagnostic of any departures in [/Fe] from solar values.
Prior to deriving [/Fe] ratios for the NGC 524 GCs, we have performed a consistency check of the [Milone et al. (2000)] (2000) calibrations by comparing them to stellar populations with independently derived [/Fe] ratios, namely Galactic GCs. This is a necessary verification since the test applied by [Milone et al. (2000)] (2000) themselves (using the Fe, Mg2, and TiO indices of 12 elliptical galaxies) only covered the narrow metallicity range of –0.2 [Fe/H] +0.2.‡‡‡‡‡‡We note also that [Borges et al. (1995)] (1995) performed a similar comparison between their “-enhanced” SSP models and the Galactic GC data of [Burstein et al. (1984)] (1984), although over smaller metallicity range and with poorer quality data.
To this end, we use the Galactic GC data from [Cohen et al. (1998)] (1998), who have scanned the cores of 12 Galactic GCs in the metallicity range –2.3 [Fe/H] 0, achieving a typical S/N of 500. [Cohen et al. (1998)] (1998) took these data with LRIS on Keck I, using an essentially identical set-up to the NGC 524 observations presented here. This should ensure that any instrument-dependent differences are minimised in our comparisons. However, [Cohen et al. (1998)] (1998) only measured a subset of Lick indices for these data, and did not include Fe5335 or Mg2 in their analysis. For the purposes of our analysis, we have re-measured these Lick indices (along with their associated uncertainty) from the LRIS spectra (kindly supplied by J. Blakeslee), broadened to the Lick/IDS resolution. From a comparison with the six clusters in common with [Burstein et al. (1984)] (1984), we find no evidence for a significant offset in the Mg2 index between these data and the Lick system, contrary to the claim by [Cohen et al. (1998)] (1998).
We compare the Galactic GC data to the [Milone et al. (2000)] (2000) models in Figure 14. The majority of the Galactic GCs in the figure lie in the 0.3 [/Fe] 0.6 range of the models, suggesting that these Galactic GCs exhibit non-solar abundance ratios from their integrated spectra. Indeed, the Galactic GCs seemingly trace a locus which extends to the “-enhanced” metal-rich position of the nucleus of NGC 524 itself.
We list the derived [/Fe] ratios for these Galactic GCs using the [Milone et al. (2000)] (2000) models in column 4 of Table 10. For comparison, we also list literature [Fe/H] values of the Galactic GCs, in addition to the extant [/Fe] ratios of GCs obtained from high-resolution spectroscopy of individual cluster giants (from the compilation of [Carney (1996)] 1996; supplemented with data from [King et al. (1998)] 1998; [Cohen et al. (1999)] 1999 and [Carretta et al. (2001)] 2001). These literature [/Fe] ratios derive from the unweighted mean of three -elements : [Si + Ca + Ti/Fe]. As suggested by [Carney (1996)] (1996), these elements should give a good indication of “primordial” -element abundances, since these elements are neither synthesised nor destroyed on the red giant branch in globular clusters.
We find that the agreement between [/Fe] ratios derived from the integrated spectra and high-resolution measurements is generally good. We note that from their integrated spectra, the abundance ratios of the Galactic GCs remain roughly constant at [/Fe] + 0.4, from [Fe/H] = –1.8, up to solar metallicities. The Galactic GC M13 appears to have an [/Fe] ratio somewhat closer to the solar abundance. M92 appears too metal-poor for the [Milone et al. (2000)] (2000) models and we do not discuss it further. In general, the predictions of the [Milone et al. (2000)] (2000) models for the Galactic GC [Fe/H] values are consistent with the literature values (Table 10). However, the models overestimate the metallicity of M13 by 0.3 dex. This is potentially the origin of the lower [/Fe] ratios obtained for this GC. We also note that at these metallicities the [Milone et al. (2000)] (2000) models have a small range and abundance ratio discrimination is lost.§§§§§§An alternative explanation is that we are seeing the effects of altered surface abundances of magnesium due to deep mixing in metal-poor globular cluster giants. [Kraft et al. (1993)] (1993) find a strong O/Na anti-correlation in nine M13 giant stars.
We conclude that the [Milone et al. (2000)] (2000) models are able to reproduce the abundance ratios of Galactic GCs from integrated spectra over our observed metallicity range reasonably well
| ID | [Fe/H] | [Fe/H] | [/Fe] | /Fe] | Ref |
|---|---|---|---|---|---|
| (SSP) | (Lit) | (SSP) | (Lit) | ||
| M92 | — | -2.29 | — | +0.240.13a | 1 |
| M13 | -1.80 | -1.54 | +0.150.20 | +0.290.02 | 2 |
| M4 | -1.41 | -1.20 | +0.450.14 | +0.300.03 | 3,4 |
| N6171 | -1.00 | -1.04 | +0.320.12 | — | |
| M71 | -0.85 | -0.73 | +0.460.12 | +0.310.02 | 3,5 |
| N6539 | -0.65 | -0.66 | +0.450.12 | — | |
| N6760 | -0.44 | -0.52 | +0.500.10 | — | |
| N6356 | -0.75 | -0.50 | +0.450.10 | — | |
| N6624 | -0.70 | -0.42 | +0.400.07 | — | |
| N6440 | -0.47 | -0.34 | +0.500.07 | — | |
| N6553 | -0.20 | -0.25 | +0.300.05 | +0.200.06 | 6 |
| N6528 | -0.14 | -0.17 | +0.400.04 | +0.300.09b | 7 |
Sources: 1 : [King et al. (1998)] (1998); 2 : [Kraft et al. (1993)] (1993); 3 : [Gratton et al. (1986)] (1986); 4: [Brown & Wallerstein (1992)] (1992); 5 : [Sneden et al. (1994)] (1994); 6 : [Cohen et al. (1999)] (1999); 7 : [Carretta et al. (2001)] (2001). a : shows star-to-star abundance variations, [/Fe] derived from Ti + Ca only. b : [/Fe] derived from Si + Ca only.
In Figure 14 we show the position of the individual NGC 524 GCs compared to the [Milone et al. (2000)] (2000) models. The uncertainties on these points are relatively large, as indicated by the mean error bar shown in the plot. They do, however, show some trend in that their [/Fe] ratios appear to weakly decrease as metallicity increases. We also show the location of our two composite NGC 524 GCs in the figure compared to the models. These composite data behave similarly to the individual datapoints; the metal-rich bin shows a lower [/Fe] ratio than the metal-poor bin. Similar to the situation for the Galactic GCs (and for the nucleus of NGC 524 itself), the location of these data suggests that many of the NGC 524 GCs are -enhanced. The metal-poor bin possesses [/Fe] = 0.30.3, whilst the metal-rich bin exhibits [/Fe] = 0.100.15.
The non-solar [/Fe] ratios seen in luminous ellipticals are generally thought to be a result of an ISM largely polluted by type-II supernovae, for which viable explanations include either relatively short star-formation time-scales and/or an IMF skewed towards more massive stars (e.g. [Wyse & Gilmore (1988)] 1988; [Yoshii et al. (1996)] 1996). Abundance ratio differences between the NGC 524 GC sub-populations suggest that they either formed in sites with different enrichments, or over different timescales. Interestingly, our data hints that the metal-rich clusters may be more iron-enriched (i.e. from type-I products) than the bulk of the spheroid of NGC 524.
It is currently not clear whether galaxy nuclei and GCs undergo similar chemical enrichment, and indeed the interpretation of such abundance variations are not unambiguous from low-dispersion analysis. Existing data suggests that the abundance ratios of alpha to iron-peak elements show complex behaviour which may differ between GCs and galaxies. For example, [Ca/Fe] 0 in Milky Way GCs (e.g. [Carney (1996)] 1996), whilst luminous ellipticals apparently have [Ca/Fe] 0 (e.g. [Worthey (1998)] 1998), or may in fact be underabundant ([Saglia et al. (2002)] 2002; [Cenarro et al. (2003)] 2003). Whether calcium in elliptical galaxies is truly suppressed with respect to other -elements, or that this apparent suppression is due to deficiencies in current stellar population models (e.g. see discussion in [Borges et al. (1995)] 1995), requires further investigation.
4 Radial Velocities of the Globular Clusters
4.1 Kinematics of the Cluster System

We have also examined the kinematics of these NGC 524 data using our measured radial velocities. Whilst our sample is not large enough to perform a comprehensive kinematical analysis (e.g. [Zepf et al. (2000)] 2000; [Côté et al. (2001)] 2001; [Côté et al. (2003)] 2003), we have been able to place the first constraints on the dynamics of the NGC 524 GC system.
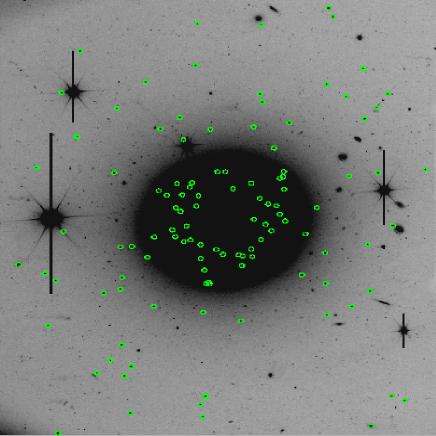
In Figure 16, we show the spatial and velocity distribution of our whole spectroscopic sample with respect to NGC 524. The dashed and solid concentric circles indicate approximately 1 and 2 effective radii of the galaxy respectively ( 13 kpc and 26 kpc respectively). From our entire cluster sample (29 clusters) we derive a mean velocity of , in good agreement with the literature systemic velocity of NGC 524 of [de Vaucouleurs et al. (1991)]. Removing an extreme cluster (#K040, ) from the sample, we obtain a mean velocity of , in even better agreement with the literature.
To obtain the velocity dispersion of the full sample, we have used a maximum likelihood estimator [Pryor & Meylan (1993)]. We obtain a velocity dispersion of for the entire cluster sample, at a mean radius of 89 arcsec ( 12 kpc) from the galaxy centre. Removing the outlying cluster, we obtain a velocity dispersion of . We note that a measurement of the stellar velocity dispersion at 40 arcsec is reported by [Simien & Prugniel (2000)] (2000) to be around this value (between 150 and 210 depending on the side of the galaxy).
We have looked for rotation in the entire cluster system by fitting a sinusoid of the general form:
| (1) |
to the position angle and GC velocity data using a nonlinear, least-squares fit (e.g. [Sharples et al. (1998)] 1998). and Vrot are free parameters, and represent the position angle of the line of nodes and the rotation velocity of the GCs respectively. V0 is the systemic velocity of the GC system (i.e. our derived mean velocity).
We find that the GC system shows rotation of (excluding the outlying cluster), around a position angle of . We plot the radial velocities of these clusters against position angle, along with our best (weighted) sinusoidal fit in Figure 18. Interestingly, the rotation we derive is similar to the maximum observed rotation velocity of the stellar light of . However this measurement is along a position angle of [Simien & Prugniel (2000)]. Therefore, the stellar rotation appears to be at to the GCs if the position angle conventions are correct.

Many luminous early-type galaxies host at least two populations of GCs, as suggested by their bimodal colour distributions (e.g. [Gebhardt & Kissler-Patig (1999)] 1999; [Kundu & Whitmore (2001)] 2001; [Larsen et al. (2001)] 2001) and increasingly by their differing kinematic properties (e.g. [Cohen & Ryzhov (1997)] 1997; [Zepf et al. (2000)] 2000; [Côté et al. (2001)] 2001; [Geisler et al. (2001)] 2001). NGC 524 also possesses a GC system with a bimodal colour distribution (e.g. [Larsen et al. (2001)] 2001 and see Figure 2). We have looked at the kinematics of these sub-populations in our present sample.
We have separated the cluster sample into metal-poor ([Fe/H] –1.0) and metal-rich ([Fe/H] –1) groups on the basis of the metallicities derived in Section 3.1. Performing the same analysis as described above, we find that the metal-poor GCs (17 clusters) dominate the rotation in our sample, with a rotation of around a position angle of . In contrast, we find that the metal-rich GCs (11 clusters excluding the outlier) show no significant rotation, with . Although the rotation of the two metallicity groups are not strongly constrained at this point, this result seems to differ from that of the NGC 3115, the nearby lenticular galaxy studied by [Kuntschner et al. (2002)] (2002). From a total sample of 24 GCs, [Kuntschner et al. (2002)] (2002) found that both the metal-poor and metal-rich GCs had a similar rotation signal.
Returning to NGC 524, the velocity dispersions of the two cluster populations, when neglecting rotation, differs only slightly: for the metal-poor GCs, for the metal-rich GC sub-population. Moreover, when the rotational component is taken into account, the dispersion of the two sub-populations are very similar (201 versus 193 ). The kinematical results for the NGC 524 GC system are summarised in Table 12.
The lack of rotation in the metal-rich population translates into a rather low value for Vrot/, an often used diagnostic for the degree of rotation over anisotropy. For the metal-rich clusters we find Vrot/ = 0.40 0.64, where the rather large error reflects the small sample of clusters. This is similar to the situation found by [Zepf et al. (2000)] (2000) for the NGC 4472 GC system, although they also found only a modest level of rotation in the metal-poor clusters.
| Sample | N | V0 | Vrot | Vrot/ | |||
|---|---|---|---|---|---|---|---|
| () | () | (degrees) | () | ||||
| All clusters excluding #K040 | 28 | 243238 | 11460 | 2227 | 18629 | 0.610.17 | |
| All Metal-poor clusters | 17 | 241554 | 14775 | 626 | 19739 | 0.750.22 | |
| Metal-rich clusters excluding #K040 | 11 | 244760 | 6884 | — | 16943 | 0.400.64 |
These results hint at either different density profiles or different families of orbits for the GC sub-populations (e.g. see [Kissler-Patig & Gebhardt (1998)] 1998 for a similar situation in M87). The most likely explanation is that this is due to the metal-poor clusters having a flatter density distribution than the metal-rich clusters, as observed in luminous galaxies (e.g. see [Rhode & Zepf (2001)] 2001 for the specific case of NGC 4472).
However, it does remain puzzling why the metal-poor globular clusters rotate at a right angle with respect to the stellar light of NGC 524. Integral field data available for this galaxy (see [de Zeeuw et al. (2002)] 2002) will clarify whether or not it is connected to the kinematically decoupled core. Clearly a larger sample of radial velocities for the NGC 524 GCs is desirable for a more detailed analysis of these issues.
4.2 The Mass of NGC 524
Globular clusters can be used to good effect as test-particles to probe the gravitational potential of their parent galaxies (e.g. [Cohen & Ryzhov (1997)] 1997; [Kissler-Patig et al. (1998)] 1998; [Zepf et al. (2000)] 2000), and are complementary to other techniques such as studies of planetary nebulae (e.g. [Hui et al. (1995)] 1995; [Arnaboldi et al. (1998)] 1998) and integrated light (e.g. [Dressler (1984)] 1984; [Bender et al. (1994)] 1994).
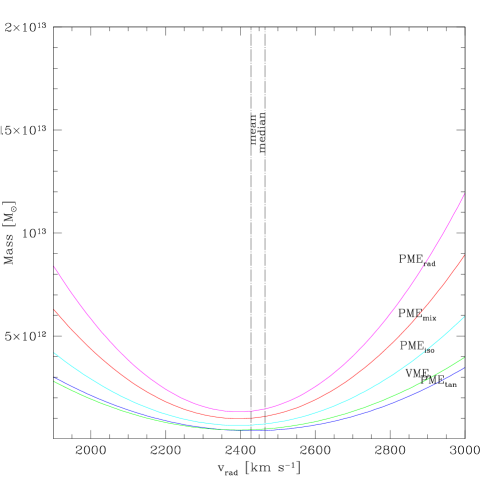
Our present spectroscopic sample allows us to estimate the total mass of the galaxy within a radius of 200′′, i.e. within roughly 2 effective radii ( 26 kpc) of NGC 524. For this purpose we used the virial (VME) and projected (PME) mass estimators, as described in [Bahcall & Tremaine (1981)] (1981) and [Heisler et al. (1985)] (1985) respectively. With our adopted distance to NGC 524 of 28.2 Mpc [de Vaucouleurs et al. (1991)], we obtain masses of M⊙ (VME) and between (PME, purely tangential orbits) and M⊙ (PME, purely radial orbits). We show in Figure 20 the various mass-solutions we obtain for this galaxy, resulting from our assumptions about the nature of the NGC 524 cluster orbits.
5 Summary and Conclusions
We have obtained low-resolution spectra for 41 GC candidates associated with the lenticular galaxy NGC 524. From this sample, 29 candidates are identified as genuine GCs on the basis of their radial velocities. Deriving mean metallicities for the NGC 524 GCs, we find our sample spans a wide range in metallicity, with –2.0 [Fe/H] 0.
The individual S/N of our spectra are generally insufficient to derive useful age constraints, since we rely on age discrimination to come from individual indices (e.g. H). Therefore we have co-added the GCs into metal-poor ([Fe/H] –1.0) and metal-rich ([Fe/H] –1.0) ’composite’ GCs. From comparison with the stellar population models of [Maraston & Thomas (2000)] (2000), we find that the composite metal-rich and metal-poor GC sub-populations both appear old, and are coeval within the 2 uncertainties.
We have examined the abundance ratios of the NGC 524 GCs using the -enhanced stellar population models of [Milone et al. (2000)] (2000). The calibration of these models was first tested using a sample of high S/N Galactic GC integrated spectra [Cohen et al. (1998)], which have independently determined [/Fe] ratios from high resolution spectroscopy. We find that the model predictions are in good agreement with these literature values. Comparing the [Milone et al. (2000)] (2000) models to our data, we find a weak trend of decreasing [/Fe] with increasing [Fe/H]. This is supported by the co-added data, with the composite metal-poor GC possessing [/Fe] 0.3, whereas the metal-rich composite GC shows [/Fe] 0.1. The lower [/Fe] ratios of the metal-rich clusters may in fact reflect a mix of [/Fe] ratios (i.e. sub-populations amongst the metal-rich clusters) as found by [Kuntschner et al. (2002)] (2002) for the lenticular galaxy NGC 3115.
We have also investigated the kinematics of the NGC 524 GC system. After the removal of one outlying GC, we obtain a velocity dispersion of . The entire cluster system shows a rotation of (excluding the outlying cluster), around a position angle of . By separating the GC systems into metal-rich and metal-poor components (at [Fe/H]=–1.0), we find that the NGC 524 GC sub-populations potentially exhibit different kinematics. Both sub-populations have similar (neglecting rotation) velocity dispersions ( and respectively), but the metal-poor clusters show signs of rotation (), whereas the metal-rich clusters do not ().
Finally, using the entire GC system, we derive a virial and projected mass estimation for NGC 524 of between 4 1011 and 13 1011 (depending on the assumed orbital distribution) interior to 2 effective radii of this galaxy.
6 Acknowledgements
We thank Soeren Larsen and Michael Pierce for useful comments and suggestions, John Blakeslee for supplying the Galactic GC data and the anonymous referee, who greatly improved the presentation of the paper, and noticed an error in the original manuscript. Part of this research was funded by NSF grant AST 9900732 and AST-0206139. The data presented herein were obtained at the W.M. Keck Observatory, which is operated as a scientific partnership among the California Institute of Technology, the University of California and the National Aeronautics and Space Administration. The Observatory was made possible by the generous financial support of the W.M. Keck Foundation. This research has made use of the NASA/IPAC Extragalactic Database (NED), which is operated by the Jet Propulsion Laboratory, Caltech, under contract with the National Aeronautics and Space Administration.
References
- Arnaboldi et al. (1998) Arnaboldi M., Freeman K. C., Gerhard O., Matthias M., Kudritzki R. P., Méndez R. H., Capaccioli M., Ford H., 1998, ApJ, 507, 759
- Ashman et al. (1994) Ashman K. A., Bird C. M., Zepf S. E., 1994, AJ, 108, 2348
- Bahcall & Tremaine (1981) Bahcall J. N., Tremaine S., 1981, ApJ, 244, 805
- Barmby et al. (2000) Barmby P., Huchra J. P., Brodie J. P., Forbes D. A., Schroder L. L., Grillmair C. J., 2000, AJ, 119, 727
- Beasley et al. (2002) Beasley M. A., Hoyle F., Sharples R. M., 2002, MNRAS, 336, 168
- Beasley et al. (2000) Beasley M. A., Sharples R. M., Bridges T. J., Hanes D. A., Zepf S. E., Ashman K. M., Geisler D., 2000, MNRAS, 318, 1249
- Bender et al. (1994) Bender R., Saglia R. P., Gerhard O. E., 1994, MNRAS, 269, 785
- Borges et al. (1995) Borges A. C., Idiart T. P., de Freitas Pacheco J. A., Thevenin F., 1995, AJ, 110, 2408
- Bridges et al. (1997) Bridges T. J., Ashman K. M., Zepf S. E., Carter D., Hanes D. A., Sharples R. M., Kavelaars J. J., 1997, MNRAS, 284, 376
- Brodie & Huchra (1990) Brodie J. P., Huchra J. P., 1990, ApJ, 362, 503
- Brodie & Huchra (1991) Brodie J. P., Huchra J. P., 1991, ApJ, 379, 157
- Brown & Wallerstein (1992) Brown J. A., Wallerstein G., 1992, AJ, 104, 1818
- Burstein et al. (1984) Burstein D., Faber S. M., Gaskell C. M., Krumm N., 1984, ApJ, 287, 586
- Cardiel et al. (1998) Cardiel N., Gorgas J., Cenarro J., Gonzalez J. J., 1998, AAPS, 127, 597
- Carney (1996) Carney B. W., 1996, P.A.S.P., 108, 900
- Carney & Harris (2001) Carney B. W., Harris W. E., 2001, ”Saas-Fee Advanced Course on Star Clusters”. Saas-Fee Advanced Course on Star Clusters Bruce W. Carney / William E. Harris, Swiss Society for Astrophysics and Astronomy, Springer.
- Carretta et al. (2001) Carretta E., Cohen J. G., Gratton R. G., Behr B. B., 2001, AJ, 122, 1469
- Cassisi et al. (1998) Cassisi S., Castellani V., degl’Innocenti S., Weiss A., 1998, AAPS, 129, 267
- Cenarro et al. (2003) Cenarro S. J, Gorgas J., Vazdekis A., Cardiel N., Peletier R. F., 2003, MNRAS, 339, L12
- Cohen et al. (1998) Cohen J. G., Blakeslee J. P., Ryzhov A., 1998, ApJ, 496, 808
- Cohen et al. (1999) Cohen J. G., Gratton R. G., Behr B. B., Carretta E., 1999, ApJ, 523, 739
- Cohen & Ryzhov (1997) Cohen J. G., Ryzhov A., 1997, ApJ, 486, 230
- Côté et al. (2001) Côté P. et al., 2001, ApJ, 559, 828
- Côté et al. (2003) Côté P., McLaughlin D. E., Cohen J. G., Blakeslee J. P., 2003, ApJ, 591, 850
- Cohen et al. (2003) Cohen J. G., Blakeslee J. P., Côté P., 2003, ApJ, 592, 866
- de Freitas Pacheco (1997) de Freitas Pacheco J. A., 1997, AAP, 319, 394
- de Vaucouleurs et al. (1991) de Vaucouleurs G., de Vaucouleurs A., Corwin J. R., Buta R. J., Paturel G., Fouque P., 1991, in Third reference catalogue of bright galaxies (1991). Springer, p. 0
- de Zeeuw et al. (2002) de Zeeuw P. T. et al., 2002, MNRAS, 329, 513
- Dressler (1984) Dressler A., 1984, ApJ, 281, 512
- Forbes et al. (2001) Forbes D. A., Beasley M. A., Brodie J. P., Kissler-Patig M., 2001, ApJ Lett., 563, L143
- Gebhardt & Kissler-Patig (1999) Gebhardt K., Kissler-Patig M., 1999, AJ, 118, 1526
- Geisler et al. (2001) Geisler D. P. et al., 2001, American Astronomical Society Meeting, 199, 1407
- González (1993) González J. J., 1993, Ph.D. thesis. Univ. Calif., Santa Cruz (G93), (1993)
- Gratton et al. (1986) Gratton R. G., Quarta M. L., Ortolani S., 1986, AAP, 169, 208
- Harris (1991) Harris W. E., 1991, ARA&A, 29, 543
- Harris (1996) Harris W. E., 1996, AJ, 112, 1487
- Harris & Hanes (1985) Harris W. E., Hanes D. A., 1985, ApJ, 291, 147
- Heisler et al. (1985) Heisler J., Tremaine S., Bahcall J. N., 1985, ApJ, 298, 8
- Huchra et al. (1991) Huchra J. P., Kent S. M., Brodie J. P., 1991, ApJ, 370, 495
- Hui et al. (1995) Hui X., Ford H. C., Freeman K. C., Dopita M. A., 1995, ApJ, 449, 592
- King et al. (1998) King J. R., Stephens A., Boesgaard A. M., Deliyannis C., 1998, AJ, 115, 666
- Kissler-Patig et al. (2002) Kissler-Patig M., Brodie J. P., Minniti D., 2002, AAP, 391, 441
- Kissler-Patig et al. (1998) Kissler-Patig M., Brodie J. P., Schroder L. L., Forbes D. A., Grillmair C. J., Huchra J. P., 1998, AJ, 115, 105
- Kissler-Patig & Gebhardt (1998) Kissler-Patig M., Gebhardt K., 1998, AJ, 116, 2237
- Kraft et al. (1993) Kraft R. P., Sneden C., Langer G. E., Shetrone M. D., 1993, AJ, 106, 1490
- Kundu & Whitmore (2001) Kundu A., Whitmore B. C., 2001, AJ, 121, 2950
- Kuntschner et al. (2002) Kuntschner H., Ziegler B. L., Sharples R. M., Worthey G., Fricke K. J., 2002, AAP, 395, 761
- Landolt (1992) Landolt A. U., 1992, AJ, 104, 340
- Larsen & Brodie (2002) Larsen S. . S., Brodie J. P., 2002, AJ, 123, 1488
- Larsen et al. (2003) Larsen, S. S., Brodie, J. P., Beasley, M. A., Forbes, D. A., Kissler-Patig, M., Kuntschner, H., & Puzia, T. H. 2003, ApJ, 585, 767
- Larsen et al. (2002) Larsen S. . S., Brodie J. P., Beasley M. A., Forbes D. A., 2002, AJ, 124, 828
- Larsen et al. (2001) Larsen S. . S., Brodie J. P., Huchra J. P., Forbes D. A., Grillmair C. J., 2001, AJ, 121, 2974
- Maraston & Thomas (2000) Maraston C., Thomas D., 2000, ApJ, 541, 126
- Milone et al. (2000) Milone A., Barbuy B., Schiavon R. P., 2000, AJ, 120, 131
- O’Connell (1976) O’Connell R. W., 1976, ApJ, 206, 370
- Oke et al. (1995) Oke J. B. et al., 1995, P.A.S.P., 107, 375
- Peletier (1989) Peletier R. F., 1989, Ph.D. Thesis, Univ. of Groningen
- Peng et al. (2003) Peng E. W., Ford H. C., Freeman K. C., (astro-ph/0311265)
- Perelmuter et al. (1995) Perelmuter J., Brodie J. P., Huchra J. P., 1995, AJ, 110, 620
- Pryor & Meylan (1993) Pryor C., Meylan G., 1993, in ASP Conf. Ser. 50: Structure and Dynamics of Globular Clusters, p. 357
- Puzia et al. (2002) Puzia T. H., Zepf S. E., Kissler-Patig M., Hilker M., Minniti D., Goudfrooij P., 2002, AAP, 391, 453
- Renzini & Buzzoni (1986) Renzini A., Buzzoni A., 1986, in ASSL Vol. 122: Spectral Evolution of Galaxies, p. 195
- Rhode & Zepf (2001) Rhode K. L., Zepf S. E., 2001, AJ, 121, 210
- Saglia et al. (2002) Saglia R. P., Maraston C., Thomas D., Bender R., Colless M., 2002, ApJ Lett., 579, L13
- Salaris & Weiss (2002) Salaris M., Weiss A., 2002, AAP, 388, 492
- Schroder et al. (2002) Schroder L. L., Brodie J. P., Kissler-Patig M., Huchra J. P., Phillips A. C., 2002, AJ, 123, 2473
- Sharples et al. (1998) Sharples R. M., Zepf S. E., Bridges T. J., Hanes D. A., Carter D., Ashman K. M., Geisler D., 1998, AJ, 115, 2337
- Sil’chenko (2000) Sil’chenko O. K., 2000, AJ, 120, 741
- Simien & Prugniel (2000) Simien F., Prugniel P., 2000, AAPS, 145, 263
- Sneden et al. (1994) Sneden C., Kraft R. P., Langer G. E., Prosser C. F., Shetrone M. D., 1994, AJ, 107, 1773
- Trager et al. (1998) Trager S. C., Worthey G., Faber S. M., Burstein D., Gonzalez J. J., 1998, ApJS, 116, 1
- Vazdekis (1999) Vazdekis A., 1999, ApJ, 513, 224
- Worthey (1998) Worthey G., 1998, P.A.S.P., 110, 888
- Worthey et al. (1992) Worthey G., Faber S. M., Gonzalez J. J., 1992, ApJ, 398, 69
- Worthey & Ottaviani (1997) Worthey G., Ottaviani D. L., 1997, ApJS, 111, 377
- Wyse & Gilmore (1988) Wyse R. F. G., Gilmore G., 1988, AJ, 95, 1404
- Yoshii et al. (1996) Yoshii Y., Tsujimoto T., Nomoto K., 1996, ApJ, 462, 266
- Zepf et al. (2000) Zepf S. E., Beasley M. A., Bridges T. J., Hanes D. A., Sharples R. M., Ashman K. M., Geisler D., 2000, AJ, 120, 2928
- Zinn (1985) Zinn R., 1985, ApJ, 293, 424
- Zinn & West (1984) Zinn R., West M. J., 1984, ApJS, 55, 45