ISO††thanks: An ESA project with instruments funded by ESA member states. observations of four active galaxies
We present ISO PHOT-S spectra of four galaxies known or suspected to host a central AGN. Two of them are selected, among several others, from the initial Iras/Rosat sample of Boller et al. (1992) because of their substantial X-ray emission, while no obvious Seyfert features was present in their optical spectra: IRAS 14201+2956 and IRAS 21582+1018 . The latter, also known as Mrk 520, was bright enough to also allow SWS observations around selected neon lines, to establish its excitation. While both PHOT-S spectra are characteristic of starburst-dominated galaxies, the neon line ratios in IRAS 21582+1018 indicate the presence of a hard excitation source. Complementary optical spectra, both at low and high spectral resolution, show only a weak, broad component around Hα, establishing the presence of a central AGN which may not be detected in standard, classification spectra. Both objects are now classified as Sey 1.9 galaxies. These results show therefore that, although IR observations were expected to be able to pierce through the dusty central regions to reveal the presence of an active nucleus, the result may be ambiguous: the broad band IR energy distribution can still be dominated by starburts located in a wider circumnuclear region, and the AGN appear only in specific observations ( high-excitation lines in the IR, or high-resolution optical spectra). As a complement, two other galaxies from the same initial sample were also observed with PHOT-S: the Narrow Line Seyfert galaxies (NLS1) Mrk 359 and Mrk 1388. NLS1s appear in high proportion in the Rosat/Iras sample, and in soft X-ray samples in general, and their Balmer line-widths are sometimes comparable to those of interacting, star-forming galaxies. Their ISO spectra however do not reveal the typical, strong PAH features found in the starburst galaxies and are more like those of standard Seyferts. All these observations therefore indicate that the key element is the presence or absence of a circumnuclear starburst region which, if strong enough, may completely hide the presence of a central AGN in the IR spectral energy distribution . The dust obscuration however needs to be patchy rather than complete to explain the detection of the high-excitation lines and Balmer wings in some cases. Only high-energy observations can then establish the strength of the central AGN and the amount of extinction with certainty.
1 Introduction
The comparison between the ROSAT All Sky Survey (RASS) and the IRAS Point Source Catalog revealed many galaxies with X-ray luminosity in the range – erg s-1, which had not been previously classified as Active Galactic Nuclei (AGN) (Boller et al. 1992, Boller et al. 1998, hereafter B92 and B98). For many of them, this was simply due to the lack of optical spectroscopy, but for some others, the existing, low-dispersion spectra did not reveal clear characteristics of a Seyfert type nucleus. These cases opened the possibility that AGN may exist in many galaxies without being detected by standard spectroscopy (Boller et al. 1993) and deserved further studies. As the selection process of this sample included detection by IRAS, it was also clear that obscuration by dust was an important factor, as shown by the results obtained in various IRAS galaxies samples (e.g. Heckman et al. 1987; Veilleux et al. 1995). In particular, the controversy about the nature of the dominant energy source, starburst or AGN, in the high-luminosity IRAS galaxies (Sanders and Mirabel, 1996, and references therein) was illustrative of the questions raised by IR-selected objects.

A systematic optical spectroscopic follow-up of the B92
sample was therefore undertaken, the results of which will be presented
elsewhere (Dennefeld et al., in preparation).
Independant observations were also published by Moran et al. (1996).
But at the same time, the
availability of the Infrared Space Observatory (ISO) of the European Space
Agency (Kessler et al. 1996) allowed specific mid-infrared spectroscopy to
be envisaged for those objects with high X-ray luminosity and no obvious AGN
signature in the visible, with the hope that the smaller extinction expected
at these IR wavelengths would allow a better determination of the
nature of the nuclear source. Observations of a large number of reference
objects, both starburst and Seyfert galaxies, in the ISO core-program, would
provide the necessary reference for this identification: indeed, results by
Genzel et al. (1998) show that both fine structure lines observed with the
Short Wavelength Spectrometer (SWS) and polycyclic aromatic hydrocarbon (PAH)
features observed at lower spectral resolution with the ISOPHOT-S are
excellent diagnostics to distinguish starburst and AGN energy sources.
The allocated observing time and the effective ISO sensitivity allowed us to
observe only a few, bright objects, among the many initially selected.
Two of them belong to the subclass of
X-rays bright objects without previous Seyfert classification from the B92
sample: IRAS 14201+2956 and IRAS 21582+1018 , the second one also being known as
Mrk 520 (Markarian and Lipovetskii, 1974). To those were added two other,
bright, Narrow Line Seyfert galaxies (NLS1): Mrk 359 (Markarian and
Lipovetskii, 1971) and Mrk 1388 (Markarian et al., 1980). This class of
objects
was not well represented in the Genzel et al. (1998) core-program, but
appeared in large proportions in the B92 sample. The Balmer line-widths
of NLS1 are much smaller than in standard Seyfert 1s, and are sometimes
comparable to those of interacting, star-forming galaxies,
raising the question of a
possible link between the peculiarities of the NLS1 and
the properties of dusty starbursts/AGNs.
The basic parameters of these four objects are presented in Table 1.
To facilitate the separation between the two types of objects,
we will call the two NLS1s by their Markarian names, and refer to the two
other objects by their IRAS name.
| Source | (0.5–2 keV) | IRAS | ||||
|---|---|---|---|---|---|---|
| (km s-1) | ( ) | ( ergs s-1) | (m flux ratio) | |||
| Mrk 359 | 1039 | 5100 | 3.28 | 34.1 | 0.39 | |
| Mrk 1388 | 4404 | 6350 | 2.34 | 2.3 | 1.33 | |
| IRAS 14201+2956 | 4255 | 15700 | 15.8 | 13.7 | 0.21 | |
| IRAS 21582+1018 | 3308 | 8200 | 23.1 | 5.7 | 0.12 |
In this paper, we report the results of the ISO observations of these four targets, together with those of complementary optical observations. We will assume km s-1 Mpc-1, but the exact value has little influence on our conclusions. Energies are quoted in the source rest frame . The ISO observations are presented in Section 2, the other data in Section 3 (X-rays, radio, optical), and the results are discussed in the last Section.
2 ISO observations and data reduction
2.1 The PHOT-S observations
All four objects were observed in 1996-97 with the ISOPHOT-S spectrophotometer (Lemke et al. 1996) in rectangular chopped mode, with on-source integration times of 512 s. The total spectral range is covered simultaneously by two linear arrays, from 2.47 to 4.87m and from 5.84 to 11.62m respectively, with a common entrance aperture of 24” x 24”. The ISOPHOT-S data were reduced using the PIA version 8.1: the main steps of reduction can be found in Rigopoulou et al. (1999). But it is worth mentioning here that, with this version, the short-wavelength range is also satisfactorily processed and no additionnal flux correction factor is necessary. The resulting spectra are shown in Fig. 1 and some measured values can be found in Table 2 (columns 4 to 8).
2.2 SWS observations
The brightest source, Mrk 520 = IRAS 21582+1018 , was also observed in late 1996 with SWS, in selected wavelength ranges around the Neon lines ( [Ne II] at 12.8, [Ne V] at 14.3 and [Ne III] at 15.5m rest wavelength respectively) in the high resolution SWS AOT6 mode. In this configuration, the entrance slit is 14” x 20”, slightly smaller than the aperture used in PHOT observations. The data were reduced using the SWS Interactive Analysis (IA) data reduction software package using standard ISO pipeline data routines and the corresponding calibration files (version 9.5). We have also used some more sophisticated software tools to improve dark current subtraction and flat fielding. The final spectra were re-binned to resolutions between 1200 and 1500. The resulting lines together with Gaussian line fits (used to determine line fluxes) are shown in Fig. 2.
| Source | 5.9 m Cont. | 7.7 m Cont. | 7.7 m PAH Flux | 7.7 m | 6.2 m PAH Flux | ||
|---|---|---|---|---|---|---|---|
| (mJy) | (mJy) | ( W ) | L/C ratio | ( W ) | |||
| Mrk 359 | 53.1 | ||||||
| Mrk 1388 | 43.0 | ||||||
| IRAS 14201 | 10.4 | ||||||
| IRAS 21582 | 40.2 |
†Galactic value in parentheses
3 Additional data at other wavelengthes
3.1 X-rays data
The four objects were selected from a cross-correlation (B92) between the
Iras data
and the Rosat All-Sky Survey; the latter is the main source for X-rays data.
For each of the objects, a power law fit was done over the 0.1-2.4 keV spectral
range, with free photon index and hydrogen
column density .
The results for and are given in the first two
columns of Table 2. The value for the Galactic foreground absorbing column
density (Dickey and Lockman, 1990, and references therein ) is given in
parentheses after the value obtained from the best fit.
The absorption corrected flux is then used to
derive the X-rays luminosity given in Table 1.
For Mrk 1388 and IRAS 21582+1018 the
spectral fit is poorly constrained. An alternative flux determination can
then be done by fitting a power law with fixed spectral index (2.3
used here) and only the Galactic foreground absorbing column density.
The resulting flux, 1.0 and 3.3 ergs s-1 respectively, is
a factor of two lower than the result from the spectral fit, consistent with
the lower absorbing column density used, and gives an estimate of the
uncertainties. For IRAS 21582+1018 the optical galaxy is offset from the centroid of
the X-ray position but lies within the contours;
no other optical object is
visible within these contours down to B=23 at least, and the galaxy is the
only candidate, although the contribution from a neutron star cannot be
formally excluded.
IRAS 14201+2956 is in fact a pair of galaxies,
but the X-ray source is clearly related to one of the components only (the
SW one),
to which the ISO and optical spectra refer also. No bridge is seen
between those two galaxies on deep optical images obtained at OHP.
No indication for variability is apparent from the Rosat data, except for
IRAS 14201+2956 . This is also the only object for which other X-ray data are available: it
has been observed in the Einstein extended medium-sensitivity survey (Gioia
et al. 1990) with a flux of
ergs
in the 0.3-3.5 keV range.
The Rosat flux of 1.15
ergs cm-2 s-1, in the smaller spectral range of
0.1-2.4 keV, is indeed higher, but this could be due to the soft-X excess
only. We have used the power law fit done over the Rosat spectral range to
evaluate the flux in the Einstein band (0.3-3.5 keV) and found a value
of 5.9 ergs cm-2 s-1. The difference with the
original Einstein observations appears to be marginally
significant and could be indicative of time variations also.
No hard X-ray data are available for the moment for any of
those objects, making difficult the analysis of the energy source from the
X-ray point of view alone.
3.2 Optical observations
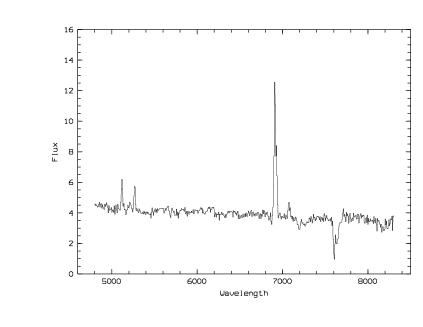
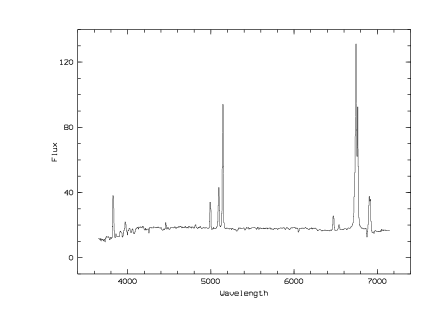
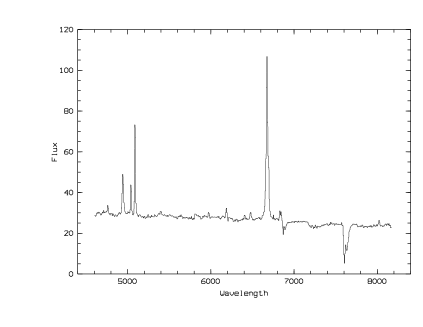
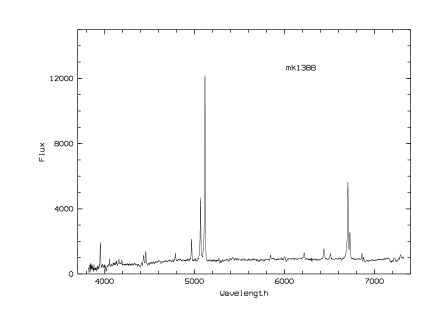
Complementary spectra were obtained over several observing runs at Haute-Provence Observatory (OHP) with the 1.93m telescope, both at low and high dispersion. The first spectra, at 7 per pixel, were obtained for IRAS 14201+2956 (Fig. 3) and IRAS 21582+1018 in May 1992, and did not show any clear evidence of a Seyfert nature. In the spectrum of IRAS 21582+1018 some line ratios ([NII]/Hα or [SII]/Hα) show higher values than in standard HII regions, but not high enough to firmly establish the presence of an AGN (they could as well be produced by supernova-remnants). This surprising result in view of the strong X-ray emission called for additional efforts. Confirmation spectra at 7 per pixel were therefore obtained again, as well as spectra at a better resolution of 1.8 per pixel (in either the Hα or the Hβ spectral region). For IRAS 21582+1018 this was done in September 1996: Fig. 4 shows the low-dispersion spectrum, with better signal to noise than the 1992 one, while the high-dispersion one is presented in Fig. 5. In the mean time, Moran et al. (1996) published also a spectrum of this object, classifying it as a Sey 1.9 . For IRAS 14201+2956 a second low dispersion spectrum was secured in May 1995, but only the Hα region could be observed at higher resolution during this run. Both the Hα and the Hβ region were re-observed during another run in May 1998 and the Hα part is presented in Fig. 6. The dashed lines in these figures represent the result of multi-component analysis, which will be discussed in Section 4.2. Low dispersion spectra were obtained for the known Seyferts Mrk 359 (January 1996; Fig. 7) and Mrk 1388 (June 1999; Fig. 8), to check for eventual variability, but no conspicuous changes were noted. All spectra were reduced in the standard way and calibrated in flux with the help of standard stars observed with the same setting during the same runs. The relative fluxes are estimated to be accurate within 10 (except at the very blue end were the atmospheric extinction is not well calibrated). Absolute fluxes are not given systematically, as the observing conditions were not perfect in each of the runs. Small variations of the total magnitude of an object from one run to the next can therefore not be estimated here.

3.3 Radio data
We searched the publicly available radio catalogues for counterparts to our objects. IRAS 21582+1018 was found in the NVSS survey (Condon et al. 1998) with a flux of 57.9 mJy at 1.4 GHz, and so was the NLS1 Mrk359, with a flux of 4.8 mJy. The other NLS1 in our list, Mrk 1388, was found in the FIRST catalogue as source J145037.8+224403 (the positional coincidence is better than 0”9 and is limited by the accuracy of the optical position) with an integrated flux of 9.93 mJy at 20 cm. The source IRAS 14201+2956 is found to be associated with the source FIRST J142220.2+294255, with an integrated flux of 2.48 mJy at 20 cm.
4 Discussion
4.1 The mid-IR properties
The basic properties of these galaxies can be best discussed with the PHOT-S
data, where all four objects have been observed. The spectrum with best
signal to noise, IRAS 21582+1018 alias Mrk 520, displays several PAH lines superposed
on a
relatively flat continuum. The strongest line is the 7.7m, with a well
separated 8.6m line on its red shoulder. The 6.2m line is also well
detected. The sharp raise at the red extremity of the spectrum is clearly due
to the presence of the 11.3m line, partly shifted out of the observed
range because of the recession velocity of this object. When comparing with
the various types of objects: starbursts, AGN’s and ULIRG’s, observed and
discussed by Lutz et al. (1998) (see for instance their Fig. 1), Mk 520
clearly appears like a typical Starburst galaxy in the mid-IR. Rigopoulou et
al. (1999) also discussed a larger sample of ULIRG’s, with special emphasis
on the possible effect of large extinction on the appearance of the mid-IR
spectrum. The main effect of extinction is to suppress the 8.6m line and
to depress the continuum redwards of it, as shown by a comparison between M82
and Arp 220 (their Fig. 6). No such suppression is seen here and the spectrum
of Mrk 520 clearly ressembles the one of M82 rather than Arp220. The 6.2/7.7
PAH flux ratio (0.27) is also consistent with a moderate
extinction only.
Although much noisier, the spectrum of IRAS 14201+2956 (the faintest of the four
sources) resembles the one
of Mrk 520, with detected 7.7 and 6.2m PAH features and a flat
continuum. The 8.6m line is not seen in the noise, while the 11.3m
one is out of range due to the higher redshift. The silicate absorption is
probably strong. This spectrum is best
described as ”Starburst” when comparing to the templates of Lutz et al.
(1998), but an ”AGN” cannot be excluded.
By contrast, the NLS1 Mrk 359 shows only weak PAH features and a
steadily raising continuum, typical of a power-law spectrum.
This continuum is even detected in the usually noisy 2.4-5m range.
The 6.2m PAH line is present with low contrast, as well as the
7.7 one.
The 11.3m line is possibly seen at the edge of the spectrum and a weak
silicate absorption may be present. This
spectrum, with its higher slope and low contrast between line and continuum
is reminiscent of the AGN template in Lutz et al.. Although the presence
of the 6.2m line indicates also a starburst contribution, this object
is clearly AGN dominated.
The last
spectrum, Mrk 1388, which has the lowest signal to noise ratio, does not show
any
clear PAH line, but its raising continuum
indicates preferentially an AGN. The slope of the continuum may be
affected by a
strong silicate absorption, as indicated by the sharp rise at the red end.
The apparent ”emission” around 9.4m,
which does not correspond to any known emission line, is probably instrumental
in origin.
We observed also the Pf line in IRAS 14201+2956 with SWS, in the hope to
reveal broad wings, signature of a Seyfert 1. We however failed to detect the
line, and derived an
upper limit to its flux of , with an uncertainty of about 20 percents.
Beyond the detection or not of the PAH features, the only other
mid-IR information available for an identification of the nuclear
source comes from the neon fine-structure lines, detected in Mrk 520, and
displayed in Fig. 2. All three lines: [NeII] at 12.8m, [NeIII] at
15.5m and [NeV] at 14.3m are well detected with a good signal to
noise ratio. The important result is that the [NeV]/[NeII] ratio is
measured at
1.2, higher than in any other template observed by Genzel et al. (1998).
Although this ratio is not corrected for reddening (as no estimate of the
latter is available), its value will not change significantly for any
plausible reddening value (only 10 for a screen of 50)
and is a clear sign of the presence of a hard UV radiation field,
i.e. an AGN. For Mrk 520, the PAH features and the fine structure lines
provide therefore apparently contradictory diagnostics.
4.2 Comparison between IR and other wavelengths
Putting aside for a moment the two NLS1 objects, the reason to observe the two other, ”starburst”, objects (IRAS 14201+2956 and IRAS 21582+1018 ) was their high X-rays luminosity in the Rosat sample, rather uncommon for starburst objects. No known starburst galaxy is so X-ray luminous (Ptak et al. 1999). The mean relation between soft X-rays and FIR luminosities derived empirically by David et al. (1992) for starburst and normal galaxies predicts an X-ray luminosity one order of magnitude lower than observed for IRAS 21582+1018 and two orders of magnitude lower for IRAS 14201+2956 , which is far beyond the scatter of this relation. The observed X-ray luminosities, and erg s-1 respectively, are, on the other hand, not uncommon among Seyfert galaxies (in our list, Mrk 1388 has in fact a lower X-ray luminosity than these two objects!).
The low dispersion optical spectra do not show conspicuous signs of a Seyfert
nature for IRAS 14201+2956 and IRAS 21582+1018 (this was the starting problem when
they were detected in the Rosat survey). In the course of this work,
it appeared that IRAS 14201+2956 had been detected in the
Einstein Medium Sensitivity Survey (Gioia et al. 1990),
and quoted as an AGN without further precision. The spectroscopic follow-up
by Stocke et al. (1991) is based on a blue spectrum only (without
Hα), and does not give a more precise classification: as judged
from our own spectra at similar resolution, this object was therefore among
their 8 percent of objects where the classification was based on
[OII]/[OIII] ratios only,
and thus requiring additional observations. No further spectrum was taken
by Moran et al. (1996) in their Rosat follow-up, so it is not clear where
their S1 classification is coming from.
Only the higher dispersion
spectra presented here show unambiguously the presence of a broad component
around Hα (Fig. 4):
this object can
therefore be classified now as a Sey 1.9, as, indeed, no similar broad component
is detected around Hβ (although the detection limit might be improved).
The excitation measured by the
[OIII]/Hβ ratio is around 1, therefore a priori excluding a
classical Seyfert 2 galaxy.
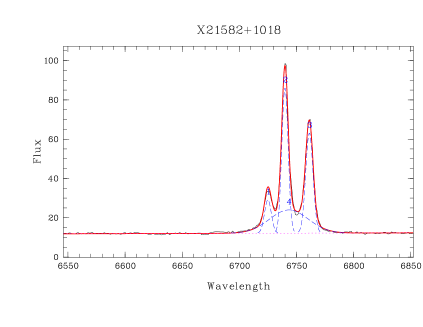
For IRAS 21582+1018, no previous spectra were available and our first classification spectrum did not reveal broad components, but an excitation close to the border line between starburst and Seyfert galaxies. A better spectrum obtained in 1996 (Fig. 4) confirms those line ratios, placing the object close to the border line but on the Seyfert side on the diagnostic diagrams presented by Veilleux et al. (1999) for Iras galaxies. The decisive ratio is the [OIII]5007/Hβ one with a value of 5, while no broad Hα component is seen, therefore pointing towards a Seyfert 2. The presence of the broad Hα component is only revealed in our high-dispersion spectrum by a multi-component analysis: three narrow components with similar width (Hα and the two [NII] lines) and one Hα component with greater width were adjusted to reproduce the observed complex. The result of the fit is shown in Fig. 5 with dashed lines: the broad Hα component has an amplitude 7 times smaller than the narrow component and a FWHM of 1800 km/s. The observed width of the narrow components is 310 km/s, while the instrumental profile is 180 km/s FWHM. The total intensity of the broad Hα component is about equal to that of the narrow component. This object is thus also classified here as a Sey 1.9, in accordance with the classification proposed by Moran et al. (1996) from a spectrum at resolution. From the ratio of the narrow components of Hα/Hβ, we derive a reddening of magnitudes under the assumption of case B recombination.
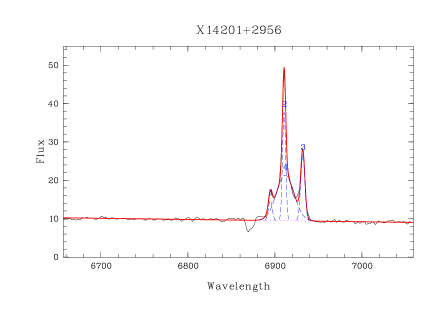
A similar multi-component analysis made for IRAS 14201+2956 (Fig. 5)
gives an intensity for the broad Hα component of 2.2 times the
intensity of the narrow component, and a FWHM of only 1030 km/s (220 km/s
for the narrow components). The
Hα/Hβ ratio gives here a reddening essentially zero, with
however a significant uncertainty. The optical
classification of both objects as Sey 1.9 is thus now in agreement
with the detection of a strong soft X-rays component.
For the NLS1 objects, our spectra do not reveal any significant new feature
compared to previous classification. Mrk 359 was observed in
details by Veilleux (1991), who noted its small line widthes and the
apparent absence of reddening in the narrow line region.
For Mrk 1388, the excitation is extremely high, a feature already noticed
by Osterbrock (1985), and which is more
appropriate for Seyfert 2 galaxies, than for Seyfert 1s.
No substantial reddening is indicated here for those objects either.
While the X-ray and optical observations are now in agreement with an AGN
classification for IRAS 14201+2956 and IRAS 21582+1018,
the contradiction of the broad IR features with this interpretation
remains. The PAH features detected by ISO-PHOT characterise
starburst galaxies.
The broad SED in the far IR, from 10 to
100m, is also typical of
starburst galaxies and does not satisfy the various criteria defined to
select AGN in IRAS data (de Grijp et al. 1985; Désert & Dennefeld
1988).
On the contrary, both Mrk 359 and Mrk 1388, the NLS1 galaxies,
stand out with a mid-IR
excess around 25m, typical of warm dust heated by an AGN, the excess
being particularly strong for Mrk 1388.
If we use the radio data, to compute the standard IR/radio parameter q
discussed by Condon at al.(1995), we find
a value of 2.52 for IRAS 14201+2956 , again typical of starburst galaxies and showing
that the AGN, if present, is not dominating
the IR emission and/or that the object is radio-weak.
For Mrk 359, the q parameter has the value 2.51, which is not typical
of a strong AGN, and thus points probably towards a
radio-weak nature.
For Mrk 1388, on the
contrary, this ratio
is much lower (1.54), indicating the predominance of the AGN. The case
of IRAS 21582+1018 is intermediate, with q = 2.01, reflecting the complexity of
this source and the mix of starburst and AGN.
Finally, the
observed infrared luminosities for the two Sey 1.9s,
IRAS 14201+2956 and IRAS 21582+1018 , are very high
if we assume that the objects have an
ratio typical for AGN or quasars with
erg s-1 (4.5; Elvis et al. 1994):
extrapolating the Rosat fluxes and correcting for absorption provides
a 0.5–10 keV luminosity of 4 and erg s-1, which
translates into an ratio of 16 and 45 respectively.
The
bulk of the IR emission has therefore to be attributed to another source
than the AGN.
The fact that IRAS 14201+2956 is located close to another galaxy (included in the
Iras lobe) could mean that this second object is also contributing to the
far IR emission, but we can rule out a significant contribution from it
because its
optical spectrum is not the one of a typical Iras starburst galaxy (no
emission lines present).
The discrepancy between X-ray and IR signatures is therefore best resolved
if the two emissions
have a different origin. The X-rays come from a central AGN, whose
contribution to the IR emission is negligible.
The bulk of the IR radiation is produced by an
intense star formation episode, occurring on spatial scales of the
order of or larger than the NLR, and not directly linked to the AGN.
The limited angular resolution of our ground-based
spectra (1”2 per pixel, with an average seeing of 2”) does not allow us to
disantangle spectroscopically the AGN from the starburst region: we can
only say that this star forming region must be contained within a ”central”
region of about 3 kpc diameter for IRAS 14201+2956 and 2 kpc for IRAS 21582+1018. This is
completely consistent with what is known for other, starbursting, IRAS
galaxies.
However the fact that
the neon line ratios clearly indicate an AGN in IRAS 21582+1018 means that the
dusty starburst is not fully obscuring the view to the central region.
The other question is then to understand why
the optical spectrum hardly reveals the broadline region, while the
X-rays are coming out:
the measured optical extinction of is
largely unsufficient to hide it.
The column density derived from the X-ray spectral analysis provides
only
, barely consistent with the value derived from the optical:
there is
therefore no room in the X-rays for additional extinction towards the center.
The measured optical extinction probably refers then to an outer region
only (starburst/NLR), possibly linked to a dusty, warm absorber, as known in
other cases (e.g. Reynolds et al., 1997). This is another argument for a
distinct origin of the IR and X-ray emission.
For IRAS 14201+2956 , both the optical and the X-ray indicate an absorption close to
zero, but the broad Hα component is also better detected.
We can also use an isotropic indicator of the AGN’s intrinsic brightness,
like the [OIII] luminosity, corrected for extinction, and compare it to
the 1–10 keV luminosity
(derived by extrapolation from the Rosat data) to get an estimate of the
absorption affecting the X-rays flux (Maiolino et al. (1998); Bassani
et al. (1999). Using our 1996 spectrum for
IRAS 21582+1018 (obtained in photometric conditions), we derive a
ratio of 1.3 only, on the very low side of the bulk
of Seyfert 1 galaxies (Maiolino et al. 1998, their Fig. 6), thus
leaving room for at least
a moderate absorption, although a compton-thick source is difficult
to justify with the available data (as a comparison, the same ratio
derived for Mrk 1388
is about 10, a value typical for Sey 1 galaxies). For IRAS 14201+2956 , this ratio is
much higher
(): even if it is affected by a large uncertainty (a factor of 2)
on the [OIII] luminosity, this object is probably not heavily absorbed.
In both cases however,
one has to remember that the X-rays fluxes used in the calculation are
extrapolated from soft
data, and could therefore be overevaluated due to the possible presence
of a strong soft X-rays excess.
We could therefore propose that these two objects are better described as weak AGNs rather than highly obscured objects. From their optical properties, they refer mainly to the Sey 1.9 or 1.8 classes, where the reason for weak broad lines is still not understood. As they have a large soft X-ray component, they could be closer than suspected to NLS1s, where the extinction is small also. It will therefore be important to get hard X-ray observations for all these objects, to determine the relative importance of the soft X-ray component (excess or not), to check the existence of a dusty, warm absorber and to assess the real strength of the central AGN and the obscuration in front of it. Confirming the possible variability is another element to clarify their nature. They may in the end be local examples of the absorbed type-2 objects searched for at much higher redshift.
5 Conclusion
A combination of optical, IR and X-ray observations has helped to clarify the apparent discrepancies in the properties of the two galaxies IRAS 14201+2956 and IRAS 21582+1018 . The high soft X-ray emission detected by Rosat, which is difficult to explain by a starburst, is linked to a central AGN whose presence is detected in the optical only by high resolution spectroscopy revealing a weak, broad component in Hα. The emission and spectral energy distribution in the IR, on the other hand, is clearly dominated, even in the ISO mid-IR range, by a circumnuclear starburst revealed by the PAH features. The discrepancy between the X-ray and IR properties is therefore best explained by a different origin of the main emissions. In the case of IRAS 21582+1018 however, high resolution spectroscopic observations with ISO have also revealed high-excitation lines clearly associated with the AGN and its NLR, but not dominating the energy balance in the IR. The extinction measured from the X-ray or the optical is insufficient to explain the lack of strong, broad emission lines and pertains essentially to the starburst/NLR only. IRAS 21582+1018 and to a lesser extent IRAS 14201+2956 are therefore best described by a central, perhaps weak, AGN, with a BLR partly obscured by a structured absorber, and an absorbed NLR, mixed with a region of intense star formation of perhaps larger extension. These examples show that the detection of AGN spectral line characteristics in the optical or IR are not enough to establish the main source of energy in the IR and that mixed cases may be frequent. Many of them are probably found in the B92 and B98 samples, as the selection there was made both by X-ray and IR emission. The only established common property between those objects and the NLS1 galaxies also found in large number in these samples (of which two examples, Mrk 359 and Mrk 1388, were studied here) seems to be the strong soft X-ray emission. Whether or not both type of objects have more common properties, and are for instance both characterized by a weak central AGN remains to be established: only hard X-ray observations will be able to measure the strength of the central engine and determine the surrounding absorption.
Acknowledgements.
This research has made use of the LEDA Extragalactic Database, which is operated at Observatoire de Lyon (France), and of data obtained through the High Energy Astrophysics Science Archive Research Center Online Service, provided by the NASA/Goddard Space Flight Center. We thank the anonymous referee for helpful comments.References
- (1) Bassani L., Dadina M., Maiolino R., et al., 1999, ApJ Supp. 121, 473
- (2) Boller T., Meurs E.J.A., Brinkmann W., et al., 1992, A&A 261, 57
- (3) Boller T., Dennefeld M., Brinkmann W., et al., 1993, in ”First light in the Universe: Stars or QSOs?”, Editions Frontières, Rocca-Volmerange B., Guiderdoni B., Dennefeld M., Tran Thanh Van J. (eds.), p.339
- (4) Boller Th., Bertoldi F., Dennefeld M. and Voges W., 1998, A&A Supp. 129, 87
- (5) Condon J.J., Andreson E., Broderick J.J., 1995, AJ 109, 2318
- (6) Condon J. J., Cotton W. D., Greisen E. W. et al. 1998, AJ 115, 1693
- (7) David L.P., Jones C. and Forman W., 1992, ApJ 388, 82
- (8) Désert F.X.D. and Dennefeld M., 1988, A&A 206, 227
- (9) Dickey J. M. and Lockman F. J., 1990, Ann. Rev. Astron. Astrophys. 28, 215
- (10) Elvis M., Wilkes B., McDowell J.C., et al., 1994, ApJS 95, 1
- (11) Genzel R., Lutz D., Sturm E. et al. 1998 ApJ 498, 579
- (12) de Grijp M.H.K., Miley G.K., Lub J., de Jong T., 1985, Nature 314, 240
- (13) Gioia I. M., Maccacaro T., Schild R. E., et al. 1990, ApJS 72, 567
- (14) Heckman T.M., Armus L., Miley G.K., 1987, AJ 93, 276
- (15) Kessler M.F., et al. 1996, A&A 315, L27
- (16) Lemke, D. et al., 1996, A&A 315, L64
- (17) Lutz D., Spoon H.W.W., Rigopoulou D., Moorwood A.F.M., and Genzel R., 1998, ApJ 505, L103
- (18) Maiolino R., Salvati M., Bassani L. et al. 1998, A&A 338, 781
- (19) Markarian B.E., and Lipovetskii V.A., 1971, Astrophysics 7, 299
- (20) Markarian B.E., and Lipovetskii V.A., 1974, Astrophysics 9, 283
- (21) Markarian B.E., Lipovetskii V.A. and Stepanyan D.A., 1980, Astrophysics 15, 363
- (22) Moran E.C., Halpern J.P., Helfand D.J., 1994, ApJ 433, L65
- (23) Moran E.C., Halpern J.P., Helfand D.J., 1996, ApJS 106, 341
- (24) Osterbrock D.E., 1985, PASP 97, 24
- (25) Ptak A., Serlemitsos R., Yaqoob T. and Mushotzky R., 1999, ApJS 120, 179
- (26) Reynolds C.s., Ward M.J., Fabian A.C. and Celotti A., 1997, MNRAS 291, 403
- (27) Rigopoulou D., Spoon H.W.W., Genzel R., Lutz D., Moorwood A.F.M., and Tran Q.D., 1999, Astron. J. 118, 2625
- (28) Sanders D.B., and Mirabel I.F., 1996, ARAA 34, 749
- (29) Stocke J. T., Morris S. L., Gioia I. M. et al., 1991, ApJS 76, 813
- (30) Tran H.D., Osterbrock D.E., Martel A., 1992, A.J. 104, 2072
- (31) Veilleux S., 1991, ApJ 368, 158
- (32) Veilleux S., Kim D.C., Sanders D.B., Mazzarella J.M., Soifer B.T. 1995, ApJS. 98, 171
- (33) Veilleux S., Kim D.C., and Sanders D.B., 1999, ApJ 522,113