Coronal stripping in supersaturated stars
A recent unambiguous detection of X-ray rotational modulation of the supersaturated star VXR45 (P = 0.223 days) has shown that its corona has discrete dark and bright X-ray regions. We suggest that due to the rapid rotation, the X-ray emitting corona has been centrifugally stripped away, creating open field regions that are dark in X-rays. This leads naturally both to a significant rotational modulation in X-rays but also to the lower X-ray luminosity of supersaturated stars compared to those rotating more slowly. To demonstrate the effect, we take as an example a more slowly rotating star for which surface magnetograms are available. We extrapolate the potential coronal magnetic field based on these magnetograms and determine for a hydrostatic, isothermal atmosphere the structure of the density and of the optically-thin X-ray emission. We show that if the rotation rate of this star were increased, the magnitude of the X-ray luminosity would decrease while its rotational modulation would increase in a way that is consistent with the recent observations of VXR45.
Key Words.:
stars: activity – stars: coronae – stars: late-type – stars: magnetic fields – stars: rotation – X-ray: stars1 Introduction
While the nature of the X-ray emission from the Sun is relatively well understood, the way in which that emission changes with increasing rotation rate is less clear. Observations suggest that, compared to the Sun, stars of increasing rotation rate show a rise in their X-ray emission that reaches a maximum of about at rotation rates of about kms-1 \citefmtVilhu1984 . Beyond this rotation rate is the “saturated” regime where the X-ray luminosity is independent of rotation rate. This behaviour persists until rotation rates of about kms-1, where the X-ray luminosity begins to decrease again. This regime is referred to as “supersaturated” \citefmtProsser et al.1996 ; \citefmtRandich1998 .
There are several possible explanations for saturation of the X-ray emission. It may be that with increasing rotation rate, the dynamo process itself saturates due to the back-reaction of the field on the plasma. Alternatively the increasing dynamo activity may lead to a complete coverage of the stellar surface in active regions such that no further increase in X-ray emission is possible \citefmtVilhu1984 . A rise in coronal temperatures above the detection limit might also produce an apparent saturation.
A detection of rotational modulation of X-ray emission in a saturated star could potentially address some of these questions. A lack of any modulation could be consistent with a corona that is densely packed with X-ray emitting loops, while the presence of modulation might provide some clues as to which magnetic structures are dominating the emission. Rotation modulation has, however, proved very difficult to detect, given the high levels of X-ray variability in active stars.
There have been some indications from observations of both binary and single stars that rotational modulation may be greater for lower-temperature plasma which has a smaller pressure scale height and so may be confined closer to the stellar surface \citefmtWhite et al.1990 ; \citefmtGüdel et al.1995 . Lack of rotational modulation may of course be due to an extended, densely-packed corona, but it can also be due to most of the emission coming from high latitudes where it is not eclipsed \citefmtSiarkowski et al.1996 ; \citefmtSolanki et al.1997 ; \citefmtJeffries1998 ; \citefmtStȩpień et al.2001 . A very clear example of this is the case of AB Dor (P=0.514 days). A long term ROSAT study \citefmtKürster et al.1997 showed a very low rotational modulation of only , while observations of two flares with BeppoSAX \citefmtMaggio et al.2000 showed no rotational modulation of the X-ray emission over the decay phase of the flares, although they lasted for more than one rotation period. Modelling of the flare decay indicated that the flaring loops were small, with a maximum height of only R⋆. This implies that the flaring regions must have been located at latitudes above 60∘ (the stellar inclination) where they were never eclipsed.
Zeeman-Doppler images of AB Dor \citefmtDonati & Collier Cameron1997 ; \citefmtDonati et al.1999 certainly show flux at the kilogauss level at these latitudes. By extrapolating the coronal magnetic field of these magnetograms and determining the corresponding X-ray emission from an isothermal, hydrostatic atmosphere, \scitejardine02xray showed that the surface magnetic maps would lead naturally to most of the emission coming from the high latitude regions. This gave a low rotational modulation coupled with the observed high density and emission measure.
In the case of the supersaturated star VXR45, however, the X-ray emission is very different. This star is very rapidly rotating member of IC 2391 with a spectral type of dG9 and photometric period of 0.223 days \citefmtPatten & Simon1996 and a kms-1 \citefmtStauffer et al.1997 . Its value of log() is between and and so it is clearly in the supersaturated regime. The XMM-Newton observations reported by \scitemarino03VXR45 show an unambiguous rotational modulation of about . Given the broad energy bandpass of XMM-Newton, \scitemarino03VXR45 rule out the possibility that the temperature range of the emission is responsible for the supersaturation and claim that the result shows clearly that the X-ray emission is coming from discrete structures that are rotationally self-eclipsed.
It is possible that for these very rapid rotators the dynamo process has changed its nature from a saturated state to one where it produces a more patchy coverage of flux at the stellar surface. Doppler images of VXR45 do not appear to support this suggestion \citefmtMarsden et al.2003 , but even if this were the case, the effect of coronal stripping \citefmtJardine & Unruh1999 could mask the onset of such a change, or disguise it completely. At high rotation rates the co-rotation radius (where centrifugal forces balance gravity) moves inside the X-ray emitting corona. The rise of gas pressure in the summits of magnetic loops then breaks open these loops to form open field regions that are dark in X-rays. This reduction in the emitting volume initially balances the rise in the density of the corona to give a saturation of the X-ray emission, but eventually enough of the coronal volume has been forced open that the X-ray emission falls with rotation rate. As a result, at the highest rotation rates much of the corona is filled with open field and so there should be a significant rotational modulation in X-rays.
The purpose of this paper is to demonstrate that a simple increase in the stellar rotation rate is sufficient to produce both a rise in rotational modulation and a drop in the emission measure consistent with that seen in both AB Dor and VXR45.
2 Modelling the coronal emission
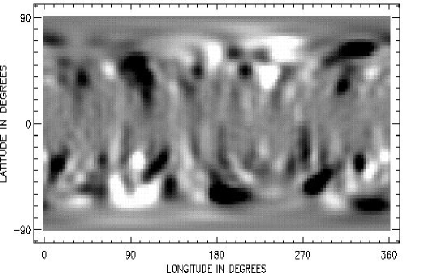
We do not have a map of the surface magnetic field of VXR45, although Doppler images \citefmtMarsden et al.2003 show a distribution of dark spots essentially similar to that found on the more slowly rotating star AB Dor, with much of the surface, especially the high latitude regions, showing large spots. Given that we do not know in detail how the surface flux distribution should vary with rotation rate for these saturated and supersaturated stars, we choose to take one sample surface flux distribution and keep that independent of rotation rate. To this end we have used a magnetogram for AB Dor to provide a coronal field structure with the degree of complexity that is implied by Zeeman-Doppler maps \citefmtDonati & Collier Cameron1997 ; \citefmtDonati et al.1999 . We note that due to the stellar inclination of AB Dor, only one hemisphere can be observed and so to allow for the flux from the hidden hemisphere we artificially add in a surface map from another year (see Fig 1). Using this composite surface map as a boundary condition for the magnetic field, we can extrapolate the coronal field by assuming it to be potential.
The method of extrapolating the coronal field has been described in \scitejardine01structure and will not be repeated in detail here. We use the source surface method pioneered by \scitealtschuler69 and a code originally developed by \scitevanballegooijen98. Briefly, we write the magnetic field in terms of a flux function such that and the condition that the field is potential () is satisfied automatically. The condition that the field is divergence-free then reduces to Laplace’s equation with solution in spherical co-ordinates
| (1) |
where the associated Legendre functions are denoted by . The coefficients and are determined by imposing the radial field at the surface from the Zeeman-Doppler maps and by assuming that at some height above the surface the field becomes radial and hence . This second condition models the effect of the plasma pressure in the corona pulling open field lines to form a stellar wind. We set the source surface to be at the Keplerian co-rotation radius such that for a stellar rotation rate , . Thus, for AB Dor and for VXR45.


In order to calculate the X-ray emission, we must determine the coronal density structure. As a first step, we calculate the pressure structure of the corona assuming it to be isothermal and in hydrostatic equilibrium. Hence the pressure at any point is where is the component of gravity (allowing for rotation) along the field and
| (2) |
At the loop footpoints we scale the plasma pressure to the magnetic pressure such that . We set for all models in this paper, giving a pressure of 120 dyne cm-3 for AB Dor at K based on an emission-measure weighted density of cm-3. As described in \scitejardine02xray scaling K simply scales the mean density and the emission measure. The plasma pressure within any volume element of the corona is set to zero if the field line through that volume element is open, or if the gas pressure exceeds the magnetic pressure (i.e. ) at any point along the field line. From the pressure, we calculate the density assuming an ideal gas and determine the morphology of the optically thin X-ray emission by integrating along lines of sight through the corona. We show results for two stellar inclinations, (appropriate for AB Dor) and the value of determined by \scitemarino03VXR45 for VXR45. The rotational modulation is defined as the fractional change in emission measure over one rotation.
3 Results and conclusions
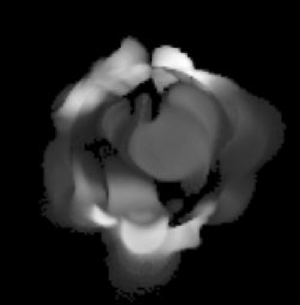
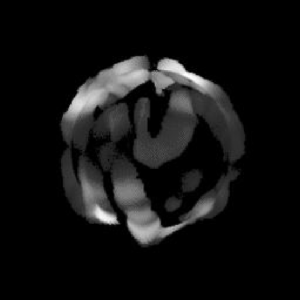
We show in Fig. 2 images of the X-ray emission for two sample rotation periods, 0.514 and 0.17 days. As the scale height has increased with rotation rate from to , more field lines have been forced open by the pressure of the coronal gas and there is a clear reduction in the volume of the corona that is bright. To quantify this, we define a filling factor based on the emission-measure-weighted density such that
| (3) |
If the rotation period decreases from 0.514 to 0.17 days, falls from to while the heights of the brightest regions fall from about to .
As shown in Figs. 3 and 4 there is a corresponding drop in the magnitude of the emission measure but a rise in its rotational modulation. The variation of the emission measure for different scalings of the magnetic field strength and the temperature with rotation rate has already been explored in \scitejardine99stripping. The overall level of emission depends on where , but the rotational modulation depends on the pattern of bright and dark regions. Even if the field strength and temperature are independent of rotation rate (as in Figs. 3 and 4) the rise in the pressure scale height with rotation rate will force closed loops to become open when and so convert bright regions to dark regions. Changing the way that the field strength scales with rotation rate alters the overall level of emission, but has little effect on the rotational modulation since we have already set at the coronal base and so the gas and magnetic pressures rise together. Lowering the temperature but keeping it and the field strength independent of rotation rate simply shifts the curves in Figs. 3 and 4 to higher values.
The rotational modulation is less for the lower inclination case since the brightest regions are at high latitude where they remain in view as the star rotates. In each hemisphere the brightest region is a high-latitude section of the large magnetic arcade that runs north-south over the rotation pole. Consequently, with an inclination of 90∘ these two bright regions give two maxima in the variation of the emission measure with rotational phase (unless they have been positioned at the same longitude when the composite surface map is made in which case only one peak is seen). For lower inclinations, the bright region in the lower hemisphere is hidden, and only a single peak remains.
For the case of a inclination and rotation period of 0.223 days appropriate for VXR45, the rotational modulation is 26 at K and 36 at K, both close to the observed value of . The similarity between the two temperatures (also noted by \scitemarino03VXR45) is because the same structures are emitting at both temperatures. Since the hotter gas has a greater scale height, however, it suffers more from coronal stripping and so the emission measure at K is about of its value at K.
This model is of course not intended to reproduce exactly the observed results for VXR45. Its aim is simply to demonstrate the principle that rapid rotation alone can account for the high rotational modulation and reduced emission measure observed for a very rapidly-rotating star. At high rotation rates the increased plasma pressure in the summits of the tallest magnetic loops forces these loops to be open, with the result that X-ray bright loops become X-ray dark open field regions. Thus, at the highest rotation rates, much of the coronal volume is dark in X-rays leading to an increased rotational modulation.
4 Acknowledgements
We would like to thank Drs A. van Ballegooijen and K. Wood for allowing us to use their codes for calculating the potential field extrapolation and the optically-thin emission measure respectively.
References
- (1) Altschuler M. D., Newkirk, Jr. G., 1969, Solar Phys., 9, 131
- (2) Donati J.-F., Collier Cameron A., 1997, MNRAS, 291, 1
- (3) Donati J.-F., Collier Cameron A., Hussain G., Semel M., 1999, MNRAS, 302, 437
- (4) Güdel M., Schmitt J., Benz A., Elias II N., 1995, A&A, 301, 201
- (5) Jardine M., Unruh Y., 1999, A&A, 346, 883
- (6) Jardine M., Collier Cameron A., Donati J.-F., 2002, MNRAS, 333, 339
- (7) Jardine M., Wood K., Collier Cameron A., Donati J.-F., MacKay D., 2002, MNRAS, 336, 1364
- (8) Jeffries R., 1998, MNRAS, 295, 825
- (9) Kürster M., Schmitt J., Cutispoto G., Dennerl K., 1997, A&A, 320, 831
- (10) Maggio A., Pallavicini R., Reale F., Tagliaferri G., 2000, A&A, 356, 627
- (11) Marino A., Micela G., Peres G., Sciortino S., 2003, A&A, 407, L63
- (12) Marsden S., Waite I. A., Carter B. D., Donati J.-F., 2003, in IAU 2003, Joint Discussion Meeting JD9
- (13) Patten B. M., Simon T., 1996, ApJS, 106, 489
- (14) Prosser C., Randich S., Stauffer J., Schmitt J., 1996, AJ, 112, 1570
- (15) Randich S., 1998, in Donahue, D. and Bookbinder, J., ed, 10th Cambridge Workshop on Cool Stars, Stellar Systems and the Sun. p. 501
- (16) Siarkowski M., Prés P., Drake S., White N., Singh K., 1996, ApJ, 473, 470
- (17) Solanki S.K., Motamen S., Keppens R., 1997, A&A, 325, 1039
- (18) Stauffer J., Balachandran S., Krishnamurthi A., Pinsonneault M., Terndrup D., Stern R., 1997, ApJ, 475, 604
- (19) Stȩpień K., Schmitt J.H.M.M., Voges W., 2001, A&A, 370,157
- (20) van Ballegooijen A., Cartledge N., Priest E., 1998, ApJ, 501, 866
- (21) Vilhu O., 1984, A&A, 133, 117
- (22) White N., Shafer R., Horne K., Parmar A., Culhane J., 1990, ApJ, 350, 776