Modification of Dust Grain Structure by Sputtering
Abstract
We have applied the SRIM computer code to study the sputtering of some likely astrophysical grain materials, and we have shown that selective embedding of metallic projectiles offers a partial explanation of gas-phase depletions. We show that supernova shockwaves sweep a significantly larger mass of interstellar gas per unit time than the shockwaves generated by outflows in star-forming regions. We apply our sputtering model to the bombardment levels expected in a supernova shock, and show that net embedding may dominate over net sputtering, leading to grain growth under some circumstances, particularly when the bombarding gas is enriched with metals from the supernova progenitor star. A combination of short cooling times and net embedding mean that it is possible for a type II supernova to generate more dust that it destroys, and we conclude that, in general, the sputtering process often leads to a compositional change in the grain material rather than simply to grain erosion.
keywords:
ISM: dust — ISM: evolution — atomic processes1 Introduction
The life-cycle of astrophysical dust is not well understood. Whilst certain constraints can be set on the class of stars which are sources of dust (Whittet [Whittet 1992], Jones [Jones 1997]) and additional information can be gleaned from isotopic compositions of grains [Zinner 1998] we know surprisingly little about the fate of an average grain from the point where it passes from the stellar wind of its host star, or supernova, into the wider interstellar medium (ISM).
Of particular interest for models of the life-cycle of dust [Edmunds 2001] are a set of competing processes which control the size and mass of the grain, some tending to increase the average grain mass and others degrading or even destroying the grain. The effect of many of these processes on grains were considered by Barlow & Silk [Barlow & Silk 1977] and Barlow (1978a,b). One way to divide up these processes is to classify them as single particle processes, where a single gas atom or molecule collides with the grain, and grain-grain processes where there is a collision between two lumps of solid material. In both cases the result of the collision, in terms of accretion or erosion of the grain, depends on the details of the collision, such as the energy, angle, and composition of the collision partners. Such processes have been included in sophisticated models of chemical evolution, which include the development of Galactic dust properties, for example Dwek [Dwek 1998] and references therein.
Single particle collisions with a grain may result in accretion of gaseous material onto the grain, or in sputtering when the incoming particle has sufficient energy to eject a grain particle into the gas. In cold molecular clouds, we can deduce that the single particle processes lead to accretion of gas molecules onto the grains, leading to an increase in the average grain size, and mass [de Muizon et al. 1998]. The key observations in this respect are signatures of ices on dust in the spectra of dark clouds [Whittet et al. 1996]. Moreover, we can see that as the molecular cloud regions become colder, more and more volatile ices are deposited on the grains, with signatures of non-polar ices, such as non-polar CO, appearing instead of the water-ice and other polar ices common in higher temperature regions [Gibb et al. 2000].
Far less is known about the consequences of single particle collisions in the warmer and more diffuse ISM which surrounds dark clouds. Observations are sufficient to show that in these regions, grains have lost their ice mantles, exposing bare core material. There is evidence [Whittet 1992] that this is often of silicate composition, but may also be carbonaceous. It is also quite possible that refractory organic material acts as a kind of inner mantle [Greenberg & Li 1996] protecting a true inner core of silicate. The absence of ice mantles is often taken to show that grain erosion by sputtering must be an efficient process, particularly in the warm ISM. Although the thermal energy of gas atoms in this phase is typically well below the surface energies of likely grain materials, making thermal erosion impossible, thermal and non-thermal sputtering in supernova shocks is usually considered to be adequate to supply sufficient gas or plasma particles with the necessary collision energies (McKee [McKee 1989], McKee et al. [McKee et al. 1987]). Indeed, supernova shocks are taken by many authors to be the main sites of grain destruction in the ISM, for example, Itoh [Itoh 1985], McKee [McKee 1989]. The extent of destructive processes is, however, rather controversial, since there is evidence from SN1987A [Kozasa, Hasegawa & Nomoto 1991], [Arendt, Dwek & Musely 1999] and Cas A [Dunne et al. 2003] that supernovae can also produce new dust - although its subsequent fate is unknown. Theoretical condensation models [Todini & Ferrara 2001] and general consideration of grain abundances [Edmunds 2001] would argue for supernovae being a significant source of interstellar grains, implying that destruction in these environments cannot dominate.
Obviously the main single particle collision partners for grains will be hydrogen and helium, and in supernova shocks these will probably be in the form of ions. Heavier ions, which carry more momentum, are more effective at sputtering than their abundances would indicate. However, an extensive study [Field et al. 1997] indicates that their total effects are probably not more than those of the hydrogen and helium, at least for typical Galactic abundances of metals and an energy spectrum of projectiles which extends well above the sputtering threshold (see Section 3.1). More recent work [May et al. 2000] has studied the effects of sputtering of typical silicate core materials in considerable detail, though restricting the bombarding particles to helium and heavier species. In this work, we present a detailed account of the sputtering process, via the Monte-Carlo ion impact computer code srim [Ziegler, Biersack & Littmark 1985], as in [May et al. 2000], but consider phenomena not covered by that work: timescales for the release of grain material, sputtering by hydrogen, sputtering of ice-mantles, and the study of sputtering as a process of grain modification, rather then the simple errosive process which is normally assumed.
2 The SRIM package and parameters
The srim computer package was originally written to solve problems in nuclear physics, where the penetration of a target by ionizing particles is to be investigated. The program takes a Monte-Carlo approach, in which the tracks of individual particles through the target are followed, and the results from many such independent tracks are accumulated to derive useful statistics for the target/projectile combination. It should be emphasized that the individual tracks are completely independent, and assume a virgin target: that is projectiles which are stopped within the target are assumed not to change its composition. Part of this work (see Section 3.3 and 3.4) lifts this assumption by following a set of calculations, each of which has a target composition modified according to the results of the previous computation.
The basic physics contained in the srim package relates to various nuclear stopping processes, by which the input projectile loses its original energy to particles in the target. Secondary processes, or cascades, are dealt with fully, that is any target particle which recoils with a significant fraction of the energy of the projectile is then treated as a further projectile which then also has to lose its energy to further target atoms, or escape from the target. There are various parameters involved in running srim: the target composition and thickness, projectile type and energy, projectile angle, and various operational flags which control the form of the output, and the detail in which the projectile tracks are reported. There are also three energies related to the lattice of the target: the surface energy, , the displacement energy, , and the lattice binding energy, . The first of these is the energy needed to eject a surface atom from the target. The second is the energy required to displace an atom from its lattice site, measured from the bottom of the potential well in which the target atom can move, to the top of the potential barrier that must be overcome to leave the site. Once free of its lattice site, a target atom may be able to escape the target as a sputtered atom, but if it does escape to infinity, it must have gained an energy at least equal to the lattice binding energy, relative to when it was bound in its lattice site.
Most of the work reported here involves the bombardment, by protons and heavier ions, of targets which approximate reasonably to interstellar dust surfaces. We note that srim has already been used to study the effects of sputtering by heavy ions in the CNO group [Field et al. 1997], and for more limited results with hydrogen and helium [Tielens et al. 1994]. The versions of the srim code used in this work were srim-2000.10, for the comparison with Tielens et al. [Tielens et al. 1994], and and srim-2000.40, for the work on olivine substrates.
3 Sputtering Results
The results of this work fall into the following categories: First, we verify the srim method, by comparing our sputtering yields, as a function of projectile energy and angle, with the work of other authors, both for srim calculations, Field et al. [Field et al. 1997], May et al. [May et al. 2000], and for other methods [Tielens et al. 1994]. Secondly, we consider the effects of selective sputtering by introducing small amounts of metallic impurities into the grain material; we discuss whether or not this could help to explain the observed gas-phase defficiencies in certain elements. Thirdly, we discuss the overall effect of the bombardment of grain materials by common ions, including the modification of the grain material by projectiles which are stopped inside the grain.
3.1 Comparison with Previous Work
In Figure 1, we plot the sputtering yield, , defined as the number of target atoms ejected per projectile, expressed as a percentage , as a function of projectile energy, for three different target materials. The projectiles are taken to strike the target at an angle, , of zero with respect to the surface normal. The projectiles are hydrogen nuclei in all cases, and the energy range is from 2 eV to 2 MeV. The target materials have been chosen to represent three likely populations of astrophysical grains: graphite and silicate to represent grain cores, and water-ice to represent grains which have accumulated cold mantles. In Figure 2, for a more restricted range of projectile energy, we show the angle-averaged sputtering yield, assuming an isotropic distribution of projectile trajectories. This average sputtering yield is given by
| (1) |
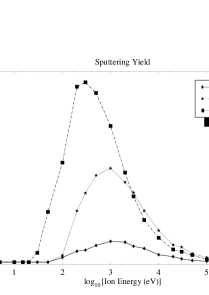
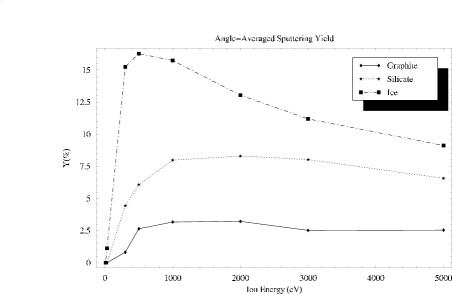
The main features of Figure 1 are the following: Sputtering is an essentially inefficient process; we see that even at the optimum energy for the most susceptible material (ice) the yield is less then 10%. We also see that there is a band of interesting energies. For the target used here, of thickness 100 nm, we find little sputtering outside the range 30 eV to 100 keV. The lower figure depends only on the surface energy, displacement energy and lattice binding energy of the material. On the other hand, the upper limit depends on the grain size, so that we expect significant sputtering damage to persist to higher energies for large grains, whilst very small grains will become immune to sputtering at lower energies than in Figure 1. This view of the sputtering process is reinforced by Figure 2: even with the bias to large angles introduced by the solid-angle integral in eq.(1), no mean sputtering yield exceeds 20%.
Field et al. [Field et al. 1997] and May et al. [May et al. 2000] do not consider sputtering by hydrogen projectiles, so we compare our results in Figure 1 and Figure 2 to the work of Tielens et al. [Tielens et al. 1994], which also contains some experimental data. For carbon (graphite) the top left-hand graph of Figure 10 of Tielens et al. shows hydrogen sputtering from a carbon (graphite) surface. The peak yield is about 1% at 350 eV, and the threshold for sputtering is around 40 eV. In our work (Figure 1) we find a peak yield of about 1% for impact energies near 1 keV, and a sputtering threshold energy near 50 eV. The hydrogen sputtering in Figure 1 of Jurac, Johnson & Donn [Jurac, Johnson & Donn 1998] has a similar peak yield, but is shifted to slightly lower energy than the equivalent graph in Tielens et al. The silicate graph in Figure 10 of Tielens et al. does not have a plot for hydrogen, but comparing it with the graph for SiC, and assuming the same order of magnitude difference between H and He sputtering, our figure of about 3% for the peak sputtering yield from hydrogen impacts seems reasonable. For ice, we find a larger discrepancy between our results and those of Tielens et al.: we calculate a peak sputtering yield for hydrogen ions, normally incident on ice (see Figure 1), of 6.5%, but Tielens et al. find 30%. It is not clear where this difference arises, but we note that Tielens et al. have scaled their theoretical curves via the free parameter, , in order to fit experimental data, of which only a small amount is available. One likely explanation is that neutralization of a projectile ion, when striking an ice surface, can lead to electronic sputtering, a process not included in srim [Jurac, Johnson & Donn 1998]. Another is that that there are many allotropes of ice, each with its own lattice binding energy. However, as we do not consider ice further in this work, but concentrate on silicate cores, the discrepancy noted above is not particularly important here.
For comparison with May et al. [May et al. 2000] we choose an olivine target, and look at the sputtering yield of silicon when the olivine, MgFeSiO4, is bombarded by oxygen and iron projectiles (see Figure 2 of May et al). When we reverted our SRIM code to include the restrictions imposed by their earlier version, the results were the same to within the accuracy with which we could read their Figure 2 (%). For example, at eV with oxygen projectiles, we obtained a yield of Si of ; the marker on Figure 2a of May et al. at eV is clearly just below . For the same graph, at eV, we find a yield of Si of , whilst the graph value at this energy is almost exactly . This excellent agreement was found in spite of a small difference in the density used for the olivine (we used g cm-3 [The CRC Handbook 1996] instead of the g cm-3 used by May et al.), although the yield is expected to be quite insensitive to the density: Field et al. [Field et al. 1997] state that a % change in sputtering yield requires a change in density as large as %. Note that we have used the fractional definition of the yield here, as in May et al., rather than the percentage definition used elsewhere in this work. The principal restriction of the older version of SRIM used by May et al. is that it allowed only a single value for each of the energy parameters, , and , defined in Section 2. Therefore, they used a weighted average over all the constituents of each target. In our work, we used the more recent srim-2000.40 to study the olivine target, and this allows separate values of , and to be chosen for all species in the target. We used the values supplied by srim-2000.40 which appear in Table 1 above. None of the individual species energies supplied by SRIM are as high as the blanket averages used in May et al. It is therefore not surprising that, in our work on olivine, we find significant sputtering of Si by O, Fe, and other projectiles, at eV. When using the species-specific energy parameters, we obtain a fractional yield of silicon, at 100 eV, of for the oxygen projectile and for the iron projectile. Below this energy, large descrepancies appear between our data and May et al. [May et al. 2000]. Fortunately, we are considering a higher energy regime than May et al., so the precise energy of the sputtering threshold is less important.
| Element | |||
|---|---|---|---|
| eV | eV | eV | |
| Mg | 1.54 | 25.0 | 3.0 |
| Fe | 4.34 | 25.0 | 3.0 |
| Si | 4.7 | 15.0 | 2.0 |
| O | 2.0 | 28.0 | 3.0 |
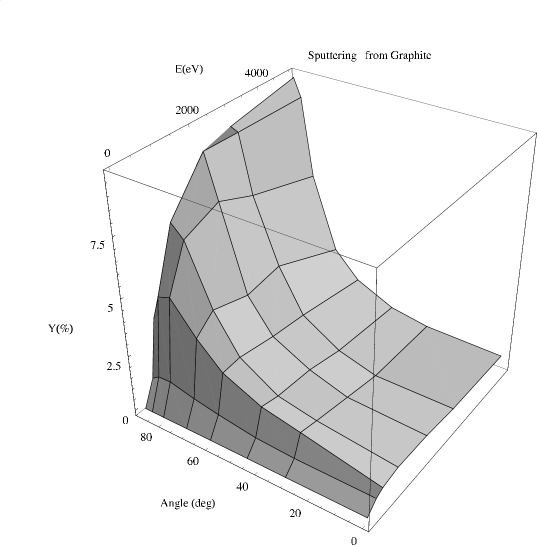
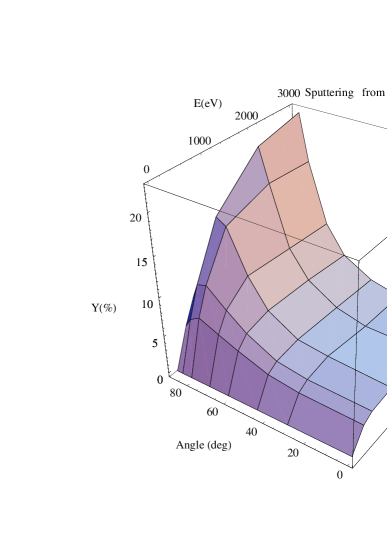
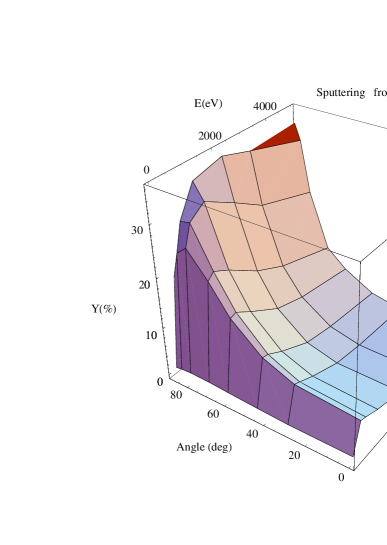
In Figure 3, Figure 4, and Figure 5 we show more detail in the sputtering yield, including, in these figures, the dependence on the angle of incidence of the projectile. Figure 3 shows the results for a carbonaceous grain (graphite), Figure 4 shows analogous results for a silicate material (quartz), and data for water-ice are depicted in Figure 5. All the surfaces exhibit a qualitatively similar behaviour: higher angles of incidence increase the sputtering yield for a given energy, until an optimum angle, usually in the range 75-88 degrees. At higher angles, the number of backscattered projectiles becomes so large that sputtering efficiency is lost. Only near the optimum energies for the most susceptible material (ice) does the sputtering yield at the optimum angle exceed 30%. The form of the angular dependence in Figure 3 to Figure 5 can be compared to Figure 2 of Jurac et al. [Jurac, Johnson & Donn 1998], noting that the latter results are for a helium projectile.
A conclusion that we share with Tielens et al. [Tielens et al. 1994] is that thermal sputtering is rarely of importance in the quiescent ISM. Only the hot, or coronal gas, phase of the ISM has sufficient temperature to place ions above the sputtering threshold of typical grain materials; this hot gas is, however, too diffuse to erode grains within a reasonable time. Sputtering therefore proceeds rapidly only in shocks, in which some of the particles at least are subject to non-thermal acceleration mechanisms and/or thermal sputtering at much higher densities than exist in the coronal gas. The two likely candidates for shock-sputtering of grains are supernova shocks, for example Tielens [Tielens et al. 1994], Jenkins [Jenkins 1989], McKee [McKee 1989], and the C-type shocks fronting molecular outflows in star-forming regions, as considered by Field et al. [Field et al. 1997] and May et al. [May et al. 2000]. Which of these shock processes is dominant?
Thermal sputtering is out of the question in cold molecular clouds. Therefore, Field et al. [Field et al. 1997] and May et al. [May et al. 2000] introduce non-thermal sputtering via a model of a C-type (continuous) MHD shock, of modest speed (- km s-1), moving through a molecular medium. The post-shock gas does not reach temperatures sufficient to ionize most components of the gas, so neutrals remain abundant, and sputtering results from a large drift velocity between the neutral and ionized fluids. The grains are taken to be part of the latter fluid; see the discussion in Weingartner & Draine [Weingartner & Draine 2001] for the range of possible charge-states that are accessible to astrophysical dust grains: both positive and negative charging is possible. We now calculate the likely sweeping rate of the ISM by shocks of this type, assuming that they are produced by bipolar outflows, associated with star-formation. Bontemps et al. [Bontemps et al. 1996] derive an expression for the ‘momentum flux’ in an outflow, based upon observations. This flux is related to the bolometric luminosity of the source, which is, in turn, assumed to be produced by accretion during the outflow phase. Combining expressions for the momentum flux and accretion power from Bontemps et al. yields
| (2) |
where the ‘momentum flux’, , is measured in units of solar masses per year times an outflow line-width in km s-1, and is the accretion rate. Assuming a timescale for the outflow phase of yr [Saraceno et al. 1996], where is the outflow lifetime in units of yr, and a velocity width of km s-1, the rate at which ISM material is shocked by the outflow is given by , where is the velocity width in units of km s-1, or
| (3) |
where we have assumed that the star accretes its own mass during the time , so that . We note that is essentially twice the shock velocity of the outflow. Assuming a modified power-law initial mass function (IMF), with an index of for stars below M⊙, and the classical Salpeter index of for stars of greater mass [Kitchin 1987], we find that, for stellar mass limits of M⊙, and M⊙, the mean stellar mass is M⊙ and the mean sweeping rate, found from
| (4) | |||||
is M⊙ yr-1. We note that if the IMF were extended to brown-dwarf masses, the mean stellar mass, and mean sweep-rate would be lower than calculated here. Finally, the amount of ISM swept by the outflow of an average star, during its formation, is found by multiplying the sweeping rate by , giving
| (5) |
where we note that the dependence on the outflow lifetime is very weak.
We compare the swept mass of ISM from eq.(5) to a figure for supernovae, derived by McKee [McKee 1989], of M⊙ before the shock decelerates to km s-1. Using the same IMF as used above for the outflows, we find that the fraction of stars formed as supernova progenitors (M⊙) is . Assuming that the modern supernova rate is equal to the formation rate of such stars, then the relative efficiency of shocking interstellar gas by supernovae and outflows is in the ratio , which is equal to . Supernovae therefore shock about times more material than star-forming outflows, so whilst the outflows can be locally very important, most sputtering occurs in supernova shocks unless the sputtering efficiency in outflows is vastly more efficient than in supernovae; this is unlikely to be the case.
As a check on the above calculation, we compare observational estimates of the current supernova and star-formation rates, which are independent of any assumed IMF. McKee estimates the effective supernova rate (for supernovae which interact strongly with the ISM, which effectively excludes type Ia supernovae, and allows for correlations due to multiple supernovae in clusters) to be about event per yr. We compare this with estimates of the Galactic star-formation rate by Boissier & Prantzos [Boissier & Prantzos 1999], who estimate a rate of M⊙ yr-1 pc-2 for the solar neighbourhood. From Figure 2 of Boissier & Prantzos, we can see that the star-formation rate does not reach ten times this value at any radius in the Galactic disc. Adopting a Galactic radius of kpc, and using the mean stellar mass, calculated earlier, of M⊙, we find a star-formation rate of yr-1. The ratio of the effective supernova rate to the total star-formation rate is therefore , compared with the calculated on the basis of our IMF. These figures are consistent if we adopt the lower figure, because the value of is not corrected for the effectiveness of the supernovae. With the lower figure, the supernovae are still about times as effective at shocking interstellar gas then star-forming outflows.
In the light of the analysis above, the model we adopt in the present work is very different from May et al. [May et al. 2000]. We consider a J-type supernova blast-wave moving at over km s-1, which provides both thermal and non-thermal sputtering projectiles. The post-shock gas is ionized by the supernova shock, so the projectiles and grains are both part of the charged fluid, and the ion-neutral drift velocity mechanism is not applicable. In the present work, we ignore betatron acceleration of the grains and projectiles, and also the fact that a grain will initially have a large initial velocity relative to the gas until its motion is thermalized. We divide the post-shock gas into a thermal fraction, which has an energy distribution function given by the Maxwell-Boltzmann form,
| (6) |
rather than a skewed Maxwellian (used, for example, in Barlow [Barlow 1978a]), and a small non-thermal fraction, which enters a first-order Fermi acceleration process above some injection energy, . We use the results of a diffusive shock model [Berezhko & Ellison 1999] to obtain our non-thermal energy distribution functions and the post-shock conditions. The crucial difference between these models and simpler test-particle calculations is that penetration of the pre-shock gas by energetic particles leads to energy loss from the shock: there is no longer a simple limiting compression ratio for the shock, and it can become very large. However, for accelerated particles which have not reached relativistic energies, the power-law spectrum of the non-thermal distribution is not different to the test-particle case [Berezhko & Ellison 1999]. The power-law energy spectrum of ions of species , derived from Berezhko & Ellison, is
| (7) |
where is the injection fraction of particles into the non-thermal mechanism, is the ratio of the injection momentum to the thermal momentum , is the ratio of specific heats in the thermal gas, is the mean particle mass, and is the mass of species . The temperature in the post-shock gas is , and the adiabatic sound speed in the post-shock gas is . The power-law index results from taking the compression-ratio in the sub-shock, , to be (see Berezhko & Ellison [Berezhko & Ellison 1999]). A crucial quantity is the post-shock temperature, . We adopt the most physically realistic case which allows for loss of energy from the shock, allowing the overall compression ratio to rise above its classical limit of , but we allow the compression ratio to be limited by the dissipation of Alfvén waves, so it cannot rise without limit as the Mach number tends to infinity. The post-shock temperature is therefore given by
| (8) |
where is the shock speed in units of km s-1, and is the Alfvén speed in the unshocked gas in units of km . The thermal and non-thermal spectra are matched at an injection energy which is assumed to be species dependent: Berezhko & Ellison consider only hydrogen, and specify the injection to thermal momentum ratio as . We assume that this momentum ratio holds for all species, such that the injection energy is . By demanding equality of eq.(6) and eq(7) at the injection energy, we calculate an injection fraction of
| (9) |
An important consequence of the mechanisms used in the present work is that, compared to May et al. [May et al. 2000], hydrogen and helium are much more important: in the thermal distribution particles have the same energy, not the same speed, so impact energy is not weighted to projectiles of higher mass. Also, in the non-thermal mechanism, the injection energies are higher, and the injection fractions smaller, for ions of higher mass, reducing their importance relative to light ions. Hence, in contrast with May et al., we cannot ignore hydrogen sputtering in the present work.
3.2 Selective Sputtering of Impurities
Certain metallic elements, notably Ca, Ti, Co & Ni, are observed to be very under-abundant in the gas-phase of the ISM [Savage & Sembach 1996]. It has long been known that gas-phase metallicity correlates with gas velocities [Barlow & Silk 1977], suggesting that shocked gas loses some of its grain material back to the gas. We test here, the idea that such observations may be explained, at least in part, by a selective propensity of these elements to resist sputtering, relative to the bulk grain material, or alternatively, of a strong tendency to be stopped, and captured within a grain when acting as a projectile. These processes are likely to be complementary to the lower energy differential surface adsorption proposed by Barlow & Silk [Barlow & Silk 1977] and Barlow [Barlow 1978b].
The first possibility, a strong resistance to sputtering, has been tested by admixing each of the grain materials with small percentages of selected elements as impurities before carrying out the sputtering calculations. We note that some degree of non-stoichiometric sputtering is expected, with the more volatile components of the target likely to experience a greater degree of sputtering [Tielens et al. 1994]. Initial calculations were carried out with the srim-2000.10 code, in which the energy parameters. , , and are not species-specific. These results were negative: that is, the fraction of impurity atoms sputtered from the target was not substantially different from the initial fractional abundance of the same element in the target. In case this negative result was due to the uniformity of the energy parameters, we also studied selective sputtering from the olivine target using the more versatile srim-2000.40 which allows separate values of the energy parameters to be set for the Mg, Si, Fe, and O-components of the olivine. We note that of these consistuents, Mg, Fe and Si are underabundant in the gas phase relative to oxygen, with Fe being the most extreme of the three and Si, the least extreme [Savage & Sembach 1996]. Our results for this case are tabulated in Table 2. We show angle-averaged total sputtering yields for each element in the olivine at four different energies. The figures for oxygen have been divided by four to allow for its stoichiometric abundance in olivine. The total sputtering yields have been calculated by summing over the abundance-weighted contributions of the ten commonest Galactic species (see Appendix 1).
| Element | ||||
|---|---|---|---|---|
| % | % | % | % | |
| O | ||||
| Mg | ||||
| Fe | ||||
| Si |
Notes for Table 2.
Values for oxygen have been divided by four to allow for its
stoichiometric ratio in the target.
The results in Table 2 do show differences between the amount of sputtering for each element. Close to the threshold for sputtering, Si has the highest sputtering yield, which reflects its low displacement energy (see Table 1). At higher energies we find an approximate binary divide with oxygen and magnesium more likely to be sputtered than the iron and silicon. This cannot explain the observed sequence of gas-phase depletions however: we expect magnesium to be intermediate between iron and silicon, which is not the case in Table 2, where Mg is more easily sputtered than oxygen at all but the lowest energies.
The second possibility, a strong tendency to be captured by a grain, looks far more promising as an explanation for gas-phase depletions. The basic argument is that an atom from one of the depleted elements, striking a grain as a projectile, is likely to be stopped within the grain, and trapped, at a depth characteristic of the grain material, and the impact energy (see Section 3.3). In the event that it does cause sputtering, it is likely not to eject an atom of its own kind, or one of similar rarity, but an atom of the basic grain material: hydrogen, oxygen, carbon, silicon, or perhaps iron. We therefore expect a steady loss of such atoms from the gas-phase until we reach an equilibrium state, where the rate of stopping in grains, for a particular element, becomes equal to the rate of return by the dominant grain destruction process. Atoms of the heavy elements are more likely to be stopped inside the target, with a lower probability of backscattering than hydrogen and helium. In Table 3, we show the backscattered fraction for projectiles of various types, when incident on an olivine target at and keV.
| Element | ( eV) | ( keV) |
|---|---|---|
| H | 0.3272 | 0.1874 |
| He | 0.2387 | 0.1845 |
| C | 0.0587 | 0.0582 |
| N | 0.0451 | 0.0476 |
| O | 0.0346 | 0.0381 |
| Ca∗ | 0.0030 | 0.0072 |
| Ti | 0.0002 | 0.0031 |
| Co | 0.0000 | 0.0008 |
| Ni | 0.0000 | 0.0008 |
| Cr | 0.0001 | 0.0019 |
| Fe | 0.0000 | 0.0011 |
| Mg | 0.0166 | 0.0200 |
| Si | 0.0107 | 0.0151 |
Notes for Table 3.
∗ Calcium has the highest gas-phase depletion.
The data in Table 3 show that very few ions of the elements with large gas-phase depletions get backscattered compared with hydrogen, helium and the C,N,O group of elements. Ions from the depleted group (from Ca onwards in Table 3) are very likely to be stopped inside the the target, and become part of it. The implication is that this is a viable mechanism for explaining interstellar depletion, although we concede that Ca would not be the most depleted element on the the basis of these data.
3.3 Modification of Grain Material
The ‘classical’ sputtering yield effectively treats the sputtering process as negative accretion, with a grain radius, , that declines according to the equation
| (10) |
where is the mean mass of grain atoms, is the number density of projectile atoms in the gas-phase, is the relative velocity of projectile and grain, and is the density of the grain. It is a consequence of the results presented above, that this view of sputtering cannot be correct because, given that the projectile atoms do not immediately escape the material, we find a steady increase in the number of grain atoms with time. We discuss below whether it is reasonable to expect stopped projectiles to escape the grain material rapidly compared with other evolutionary timescales. For bombarding gas with normal Galactic abundance, most of the deposited particles will be light, but we investigate an alternative evolution for sputtered grains in supernova remnants in Section 4, where atoms of the C,N,O group and heavier species have very high abundances relative to typical interstellar gas.
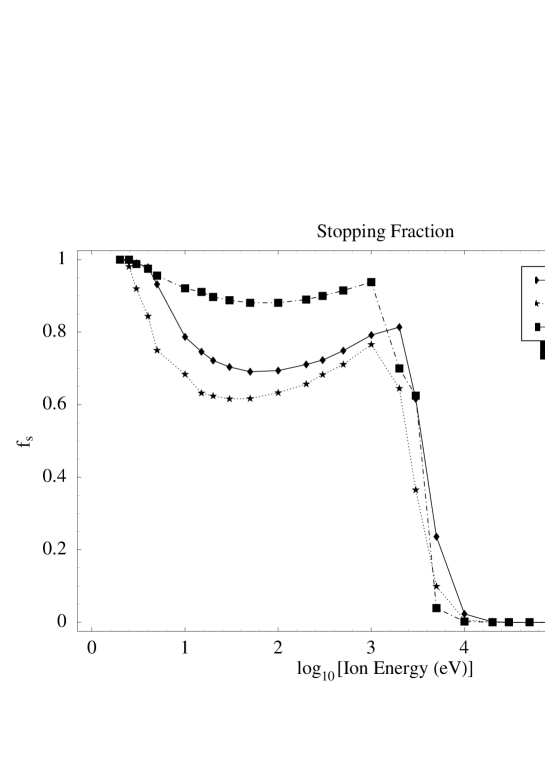
First, we plot the stopping probabilites for the standard 100 nm grain, with hydrogen projectiles, for the carbon, silicate and ice materials. The results are shown in Figure 6. We can see immediately that apart from a high-energy cut-off, dictated by the size of the grain, the fraction of projectile atoms stopped within the grain is typically above 0.6. This fraction becomes smaller at higher angles of incidence, but nevertheless the stopping fraction is, on average, higher than the sputtering yield for target materials of all three types. The conclusion is that the ‘sputtering’ process usually results in an increase of the number of particles in a grain, though not necessarily the grain mass.
It is vital to know whether embedded projectiles are likely to remain embedded within the grain material, or whether they can escape on a timescale which is very much shorter than the typical duration of the event which introduced the sputtering. If an embedded projectile can escape quickly, then the traditional sputtering yield is effectively equivalent to the true sputtering yield, whilst if the projectile becomes permanently embedded, the true yield is the difference between the traditional yield and the embedding fraction; this difference may be negative, leading to grain growth.
Atoms in a solid can diffuse through the lattice, and the same mathematical formalism can be used to describe this process as is used for gaseous diffusion [Shewmon 1989]. The diffusion process may be used for both the mobility of impurity atoms, and for ‘self-diffusion’ of the elements present in the lattice. Diffusion through solids is more complex than the analogous process in gases because of the ‘quantized’ nature of the motion, in which an impurity atom must move from one lattice site to another. This extra complexity is expressed through a diffusion ‘constant’ which depends on the packing of the lattice, its natural frequency of vibration, the temperature of the lattice, and the binding energy of the impurity atom to the lattice. The most important of these dependencies are the binding energy and temperature, because they appear in an exponential Boltzmann factor: it is very difficult for a strongly bound atom to diffuse through a very cold lattice, as expected. The precise form of the equation for the diffusion coefficient depends upon the mobility mechanism: for the vacancy mechanism, where an atom migrates by jumping between randomly-placed lattice vacancies, the equation is
| (11) |
where is the lattice spacing, is a directed oscillation frequency (towards a vacancy), is the gas constant, is the grain temperature, is an entropy and is an enthalpy. The subscript- contributions are from vacancies, and the -subscript contributions refer to lattice activation energies. For the interstitial mechanism, where a small atom ‘squeezes’ through the lattice by deforming bonds, the equation is very similar, but excludes the subscript- terms. A diffusion timescale is for spheres of diameter [Shewmon 1989]. From data in Norwick & Burton [Norwick & Burton 1975], we can deduce that at 100 K, the measured temperature of the processed dust in the SNR of Cas A [Dunne et al. 2003], all the common elements will be fixed to their lattice sites ( yr) except H and He. For example, for carbon in iron (assuming the plot in Norwick & Burton can be extended down to K at the same gradient) the diffusion coefficient is of order cm2 s-1, giving a diffusion time many orders of magnitude longer than the age of the Universe, for even the smallest grains. The fate of the helium is not crucial as it has a much lower abundance than H. For hydrogen, much depends on whether the H-atoms become chemically bound to the lattice. If they do not, for example hydrogen in -iron [Norwick & Burton 1975], the diffusion coefficient at K lies between and cm2 s-1. Even assuming the slower value, hydrogen can escape from a nm layer on a timescale of s. Contrast this with the diffusion of H2 through a silicate, where chemical bonding can take place. Here the diffusion coefficient at K is cm2 s-1, yielding a timescale of yr to escape a nm layer. Hydrogen atoms are more reactive than molecules, and so would be expected to remain longer in the solid. Chemically bound hydrogen can survive for significant times in the solid. These conclusions are of some importance in Section 3.4 and in Section 4.
Overall, typical deposition rates exceed sputtering rates. If the bombarding gas has Galactic abundance, this will still lead to net erosion, since sputtering by hydrogen and helium, even if these elements remain embedded, results in irreplaceable loss of the metallic elements that form the grain core. However, in metal-enriched gas, as found in supernova remnants, it is possible that embedding of the metals can exceed the total rate at which they are sputtered. Hydrogen and helium, if not chemically bound to the lattice, can escape from a typical grain on timescales short compared to the time needed to erode a grain by sputtering.
3.4 Processing of an olivine target
Here, we present results from srim computations which explicity take into account the modification of a target by the combined processes of sputtering and projectile stopping. The target material was olivine, as in Section 3.1 and Section 3.2, but modification of the target grain was studied in the following manner: Since srim projectiles do not modify the target with which they interact, the calculations were broken down into a series of steps, each with a fixed target composition. Beginning with a pristine target of olivine, srim calculations were carried out for all ten common projectile species at various angles and energies. Sputtering yields and stopping fractions were recorded, and also the average penetration depth for each projectile species, weighted by the distribution function developed in Section 3.1. To begin the next step, the target was divided into layers, according to the penetration depths, and the composition of each layer modified to match a bombardment of 5% by number of the original target material. The modification by species was carried out in proportion to the sputtering yields and stopping fractions for that species, and the overall weight of each species determined according to Table A1. This use of direct abundances, rather than collision rates weighted by thermal speeds of the individual species, compensates crudely for that fact that the grains in the shocked gas would have a large initial drift velocity with respect to the gas, which is only slowly dissipated. A fresh set of calculations was then performed for the modified target, which now contains projectile species. New sputtering yields and stopping fractions were computed, and the target modified again to match a further 5% by number of the original target. The penetration depths, however, were not modified on the second or subsequent steps, since stopping distances have very large standard deviations, and the number of differentiated target layers would rapidly have reached unacceptable proportions.
3.4.1 Calculations for the pristine target
First, we report the penetration depths achieved for each projectile type as a function of energy and impact angle. Since these values were also used for all subsequent steps, we discuss them only once. The depth-data appear in Table 4. The depths were originally measured at energies of , , , , , and eV, and angles of , , °, with the assumption of zero penetration at °. In the columns of Table 4, the depths have been averaged over solid angle, assuming an isotropic distribution of impacts. The final column gives the grand-average over all the energies used weighted according to the distribution function from eq.(6) and eq.(7).
| Element | |||||||
|---|---|---|---|---|---|---|---|
| nm | nm | nm | nm | nm | nm | nm | |
| H | 0.7 | 1.5 | 3.2 | 8.4 | 20.6 | 45.6 | 1.746 |
| He | 0.4 | 0.9 | 1.9 | 5.4 | 14.0 | 35.2 | 1.036 |
| C | 0.3 | 0.4 | 0.8 | 1.7 | 4.0 | 11.4 | 0.472 |
| N | 0.3 | 0.4 | 0.8 | 1.6 | 3.5 | 9.8 | 0.472 |
| O | 0.3 | 0.4 | 0.7 | 1.5 | 3.2 | 8.7 | 0.444 |
| Ne | 0.3 | 0.4 | 0.7 | 1.4 | 2.8 | 7.5 | 0.444 |
| Mg | 0.3 | 0.4 | 0.7 | 1.2 | 2.6 | 6.7 | 0.446 |
| Si | 0.3 | 0.4 | 0.7 | 1.2 | 2.4 | 5.8 | 0.446 |
| S | 0.3 | 0.4 | 0.7 | 1.2 | 2.2 | 5.2 | 0.446 |
| Fe | 0.4 | 0.5 | 0.7 | 1.1 | 2.0 | 4.2 | 0.514 |
When integrating over the distribution function, we have adopted the following standard parameters: shock speed, , Alfvén speed, , and ratio of specific heats in the thermal gas, . These parameters are typical of a supernova blast wave, close to its transition from the Sedov-Taylor phase to the pressure-driven snowplough phase of the remnant. In Table 5, we display the sputtering results for the pristine target. Each row represents a different type of projectile; the first four columns are sputtering yields for the four elemental consituents of the olivine; the final column is the stopping fraction. The sputtering yields and the stopping fraction are averaged over angle and over impact energy, weighted by the distribution function. However, the yields are not corrected for either the stoichiometric ratio of oxygen in the target, or for the relative abundances of the projectile elements. Table 5, together with Table 4 and Table A1, provide the means to alter the target composition in line with the expected bombardment in the post-shock regime.
| Element | |||||
|---|---|---|---|---|---|
| % | % | % | % | ||
| H | 1.06 | 0.73 | 0.71 | 3.78 | 0.435 |
| He | 5.86 | 2.96 | 2.90 | 19.7 | 0.494 |
| C | 13.2 | 7.35 | 7.03 | 45.5 | 0.642 |
| N | 13.8 | 7.68 | 7.28 | 47.3 | 0.661 |
| O | 14.1 | 7.89 | 7.44 | 48.5 | 0.677 |
| Ne | 14.9 | 8.21 | 7.71 | 50.8 | 0.698 |
| Mg | 15.2 | 8.37 | 7.79 | 51.7 | 0.714 |
| Si | 14.9 | 8.10 | 7.43 | 50.5 | 0.735 |
| S | 14.4 | 7.87 | 7.06 | 49.0 | 0.753 |
| Fe | 13.6 | 6.64 | 6.35 | 45.1 | 0.803 |
3.4.2 Calculations for the modified target
Following the calculation on the pristine target, the target material was divided into layers, dependent on penetration depth. Each projectile material was assumed to be uniformly distributed between the surface and its own penetration depth, from Table 4, and to have zero abundance at any greater depth in the target. Although, in principle, the modified target would have eleven layers (unmodified olivine plus ten layers modified by successive mixtures of projectile species) the average penetration depth data (final column of Table 4) allows a simplification in which the target is represented by unmodified olivine plus five modified layers. The outermost layer is contaminated by all the projectile species, the second by H, He, C, N and Fe, the third by H, He and Fe, the fourth by H and He, and the fifth by hydrogen alone. Each projectile species was assumed to sputter target atoms uniformly from all the zones into which that species could penetrate.
| Element | Layer | Layer 2 | Layer 3 | Layer 4 | Layer 5 |
|---|---|---|---|---|---|
| H | |||||
| He | - | ||||
| C | - | - | - | ||
| N | - | - | - | ||
| O | |||||
| Ne | - | - | - | - | |
| Mg | |||||
| Si | |||||
| S | - | - | - | - | |
| Fe |
Bombardment of the target was carried out in a sequence of steps, with the first step being bombardment of the pristine target. Throughout each step the composition of the target, in a given layer, was assumed to be constant. At the end of each step, the composition of the target was adjusted to take into account both the loss of sputtered atoms, and the embedding of stopped projectiles. At all steps later than the first, the projectile species form embedded populations, which may themselves be sputtered from the target. The very low abundance of all projectiles heavier than He made it possible to ignore the sputtering effect of carbon and heavier elements, even though these heavy nuclei are individually more efficient sputterers then hydrogen and helium (see Table 5). Although ignored as sputtering projectiles, the embedding of the heavier elements was still considered, and populations of these species were also subject to sputtering by H and He. For the effects of heavy elements in conditions with non-standard abundances (in SNRs) see Section 4.


The sequence of graphs, Fig. 7 to Fig. 9, shows the abundances of all species in the outermost layer of the grain as a function of bombardment. The level of bombardment is expressed as a percentage, which is the total number of projectile atoms divided by the total number of vulnerable target atoms (summed over all five layers) in the pristine target. This degree of bombardment can, of course, be converted to time, given a particular astrophysical environment; we consider the effect of supernova shocks below. Fig. 7 shows the rising abundances of the sputtering projectiles, hydrogen and helium, together with the decrease in the fraction of oxygen, the most abundant element in the pristine target. Oxygen is the most easily displaced of the elements initially present in the olivine. In Fig. 8, we show the falling abundances of the metallic components of the olivine: Fe, Si and Mg. Magnesium is significantly more easily sputtered than the other two elements, and we note that the sputtering of Si and Fe is so similar that the graphs for these two elements are indistinguishable in the figure. Fig. 9 shows the rising abundances of those projectiles which are not considered to cause significant sputtering. The low cosmic abundance of these elements means that small contaminant populations develop in the outer regions of the grain.
Overall, the effect of the sputtering process is not so much to erode the grain as to process it by significantly changing its composition. In all the penetrated zones, we find that the total zone mass and the zone density fall below the values set for the pristine olivine target, but that the particle number in all zones actually rises if we assume that H and He projectiles remain embedded in the target. We have shown in Section 3.3 that long-term survival of at least some hydrogen is likely in a silicate, providing it can bind to the lattice. The large number of vacancies produced by the sputtering process, leaving a general defficiency of oxygen, will aid binding by providing many lattice sites with low energy barriers. The low abundance of He, compared to H, makes its loss or retention in the grain of little importance.
4 Survival of grains against supernova shockwaves
Recent observational studies with SCUBA on the JCMT [Dunne et al. 2003] have convincingly demonstrated that supernovae (at least those of type II) are net producers of dust. We therefore proceed in the spirit of attempting to explain this observational fact, rather than attempting to make our models agree with previous work, which tends to favour net erosion by sputtering.
The first point that should be made is that a dust grain will experience many collisions with gas atoms and ions in a typical remnant. In most cases, the grain will receive easily enough bombardment to completely erode it if the collisions lead to net sputtering over embedding. The mean-free time in seconds for collisions between gas atoms/ions and a dust grain in the post-shock gas, is given by
| (12) |
where is the pre-shock gas temperature in units of , is the relative mass of the bombarding particle relative to H, is the number density of this bombarding species in units of cm-3, v100 is the shock speed in units of km s-1, is the post-shock temperature in units of K, and is the grain radius in nm. In deriving this equation, we have used the definition of the compression ratio from Berezhko & Ellison [Berezhko & Ellison 1999], which is , where is the shock speed and is the sound speed in the pre-shock gas. For our model grain in Section 3.4, being bombarded by hydrogen, the timescale for % bombardment (being struck by a number of H-nuclei equal to the total number of atoms in the vulnerable part of the grain) is only
| (13) |
This figure is largely size independent down to the size where the vulnerable zone becomes equal to the entire grain, since both the volume of the vulnerable zone and the grain cross-section scale as . To sputter out all the metallic elements from the vulnerable zone requires a few times , or about a century. For larger grains, including our example, we can view grain destruction as requiring the removal of several sequential layers, but even for our nm grain, total destruction would occur on a timescale less than yr; optimistic choices of yield yr. The fact that total particle number initially rises cannot prevent this destruction: the helium, which anyway has a low abundance within the grain, would probably diffuse out of the sample in a shorter time than ; hydrogen certainly would if it did not bind chemically to the lattice. Although much H might bond, hydrogen which did not attach chemically could escape on a very short timescale (see Section 3.3). Therefore the true abundance of H must always be less than in our standard model, and as metals are lost, the chances of forming a chemical bond, and becoming part of the grain material, are progressively reduced.
In a supernova remnant, abundances are very different to those in our standard model if we are considering material which is part of the ejecta, or material which is part of the ISM in a young remnant: the early swept material is almost certainly stellar wind debris, which contains enhancements of the elements He, C, N, and O with respect to the Galactic norm. For the ejecta, we have used abundances computed by Limongi & Chieffi [Limongi & Chieffi 2003]. Using the Salpeter IMF, the mean mass of a supernova progenitor is M⊙ if the upper mass limit is set to M⊙, but M⊙ if we limit the upper progenitor mass to M⊙. We have selected the latter figure, and abundances, relative to hydrogen, appear in the right-hand column of Table A1. To obtain our tabulated values, we have summed over all isotopes used by Limongi & Chieffi, and averaged over the six models computed for the mass of M⊙. To proceed further, we consider first the fate of the supernova ejecta, which are shocked by the reverse shock, and then the wind debris and raw ISM, which are shocked by the external blast-wave.
4.1 Dust in the supernova ejecta
Initially, the ejecta are cold and unshocked, with a contact discontinuity separating them from material swept-up by the blast-wave [Truelove & McKee 1999]. Even when a reverse shock is set up by the overpressure of the hot swept material, the cooling times in the ejecta are very short, leading to an early radiative phase in the ejecta [Truelove & McKee 1999]. Dust can condense under these conditions within a very short time, compared to the evolutionary scale-time of the free-expansion phase of the remnant (of order 1000 yr or less). There is observational evidence for dust condensing in SN1987A within 530 d of the outburst [Dwek 1998]. As the reverse shock accelerates, higher temperatures are attained in the shocked ejecta, but though the bombardment is efficient, the ejecta are metal-rich. Although data in Table 5 show sputtering exceeding embedding, for metallic elements, by a factor of , it is quite possible that net embedding could predominate. Values of , and closer to the May et al. [May et al. 2000] averages would lower sputtering without significantly reducing embedding rates. Also, the deposition of large amounts of carbon and hydrogen in a thin surface layer are likely to lead to the formation of a tough organic mantle on grains initially of silicate composition [Greenberg & Li 1996] [Li & Greenberg 1997]. To compute the sputtering yields from such a mantle, as a function of impact energy and time, requires much additional work but such a mantle is likely to be at least as resistant as carbon, with a yield of about a factor of three lower than for silicates (see Figure 2). The fact that supernovae appear to be net producers of dust from observations means that the investigation of such mantle formation is worthwhile. Protection of the underlying silicate could be effective until typical collision energies reach 300-400 eV, allowing the stopping of metallic projectiles to exceed their losses in sputtering. Net growth of the freshly condensed grains could therefore continue in the ejecta until roughly the end of the free-expansion phase. Truelove & McKee [Truelove & McKee 1999] quote a characteristic shock speed for the reverse shock of,
| (14) |
for supernova energy , in units of ergs, with solar masses of ejecta. The end of the free-expansion phase occurs when the speed is times the characteristic value. The mean values of and for the M⊙ model in Limongi & Chieffi [Limongi & Chieffi 2003] are , respectively, and , giving a shock speed of km s-1. This corresponds, via eq.(8), to a temperature of K, and an energy of eV. The mass of shocked ejecta, at this same stage of evolution, is , so most of the ejecta will form dust, may accumulate metals, and never be shocked to a high enough energy for net sputtering to dominate. Even the remaining of the ejecta, which is likely to lose its newly-condensed dust to sputtering, will form metal-rich gas which, when it eventually cools, is likely to add to the dust already present in the cooler shocked ejecta. We note that the cooling time is given by
| (15) |
where is the number density of the cooling gas in cm-3 and is a metallicity correction factor [Cioffi, McKee & Bertschinger 1988]. Therefore, the destruction of the dust enhances , and enhances cooling towards temperatures where the bombardment process results in net grain growth. Overall then, much of the metal content of the ejecta can survive the supernova remnant bound in dust. We note that the survival of initially condensed ejecta dust was predicted by Barlow & Silk [Barlow & Silk 1977], but this would provide insufficient mass to make supernovae net creators of dust.
4.2 Dust in the ISM and wind debris
The fate of grains in the wind debris and raw interstellar gas is more complicated. We expect the wind material to have enhanced abundances (over the mean ISM values) of lower-mass nucleosynthesis products, but not to have high abundances of the iron-group elements. We also expect successive shells of wind debris to have come from a sequence of evolutionary stages with different chemical composition. Nevertheless, we expect much of this material to resemble red supergiant winds, and to be rich in dust. For most reasonable parameter values, the entire wind-zone will be swept within the free-expansion phase of the remnant, and will therefore be shocked and heated to very high temperatures. For the particular case of the mean Limongi & Chiefi [Limongi & Chieffi 2003] M⊙ model, the blast-wave speed at the end of the free-expansion phase is still km s-1 which is destructive, even for metal-rich gas. However, as in the inner regions of the ejecta (see above) the dust destruction leads to metal-rich gas with cooling times that are much more rapid than those for typical ISM gas. With the help of the Berezhko & Ellison [Berezhko & Ellison 1999] formula, , we can calculate a compression factor of for the end of the free-expansion phase, and a corresponding temperature of K from eq,(8). With typical coolants at levels of times their typical ISM abundances, eq.(15) reduces to yr which is of similar order to the grain destruction time. It is therefore likely that the shell of wind debris becomes rapidly radiative, and that dust either survives or rapidly recondenses, joining the mass of dust formed in the ejecta. This mass of dust is likely to be similar to, but not greater than, the mass of dust in the ejecta, on the grounds that the pre-supernova star was unlikely to have lost more than half its ZAMS mass as wind debris.
Once the blast-wave has cleared the wind material, usually before the end of the free-expansion phase of the remnant, it begins to sweep-up unenriched ISM gas, which is likely to contain dust at typical ISM proportions of 1% by mass. This gas is still heated to high temperatures, and now there is no chance of net embedding for elements heavier than H and He (see Section 3.4). Gas bombardment of grains in this regime can only be destructive, and nor will the release of metals into the gas reduce the cooling time very much. This state of affairs will last until the end of the Sedov-Taylor phase, that is until the shock becomes radiative, and cooling times, even for unenriched gas, become short compared to the evolutionary timescale of the remnant. Some dust destruction may continue into the early PDS (pressure-driven snowplough) phase which follows the Sedov-Taylor era.
A rough estimate of the amount of dust destroyed can be obtained from the mass swept by the blast-wave during the Sedov-Taylor (ST) phase of the SNR. The PDS phase begins after yr [Cioffi, McKee & Bertschinger 1988]. From the end of the free-expansion phase up to this time, the remnant sweeps up a mass of
| (16) |
which is notably independent of the ISM density. The quantity is the mean relative particle mass in the unshocked ISM. For our standard model at M⊙, we find a total swept mass of M⊙, so for a typical dust mass fraction about M⊙ of pre-supernova dust is destroyed.
5 Discussion
The results of this work are broadly as follows: Firstly, sputtering in the classical sense is almost invariably an inefficient process: In most situations, the sputtering yield for a hydrogen projectile, and the chosen targets, is far lower than the 100% required to ensure erosion of the grain. Slow erosion is still possible at sputtering yields below 100%, but this requires that most of the incident projectiles do not get stopped in the target and hence become part of the grain. In fact, we find that the stopping fraction is typically large, and ususally, the number of atoms in the grain will increase due to particle collisions, as a result of the stopping of projectile atoms within the grain. In many cases, the grain mass will actually increase. For particle collisions to be effective at destroying grains, we need to appeal to the secondary effects of lightening the average atomic mass in the grain, the disruption of its crystal structure and diffusion of light elements from the grain.
The analysis of survival of dust in a supernova remnant produces an ambiguous result, but we cannot exclude net production on the basis of this very simple estimate. The Sedov-Taylor phase destroys M⊙ of ISM dust. On the other side of the balance sheet, the mass of elements heavier than He in the ejecta is M⊙, so the ejecta and wind debris could between them contribute about M⊙ of dust. The masses of dust produced and destroyed are very similar, and it is necessary to complete a very detailed analysis to find out which predominates, though it appears to be a requirement from models of galactic dust evolution [Edmunds 2001] that supernovae must be net producers of dust.
The dust produced by condensation followed by bombardment would have an interesting structure: the core would be a condensate, possibly crystalline initially, but bombardment would then insert heavy elements at random down to their typical penetration depths in the grain. Thus even if the original condensate were a silicate, the outer layers would be rich in heavy elements that did not form part of the mineral: carbon and nitrogen for example. This formation and processing scheme could make grains very similar to the silicate core with ‘organic’ mantle type that form the large grain population in Greenberg’s unified model [Greenberg & Li 1996] [Li & Greenberg 1997]. The dust is also formed in the correct region, as observationally determined: between the blast-wave and reverse shocks [Dwek 1998]. Changes in dust grain structure due to bombardment could also affect the optical properties of the grains, and this may be required to explain the SCUBA observations of supernova dust emission compared with more general ISM dust.
ACKNOWLEDGMENTS
MDG acknowledges the award of a University Research Fellowship by the Royal Society.
References
- [Arendt, Dwek & Musely 1999] Arendt R.G., Dwek E., Musely S.H., 1999, ApJ, 521, 234
- [Barlow 1978a] Barlow M.J., 1978, MNRAS, 183, 367
- [Barlow 1978b] Barlow M.J., 1978, MNRAS, 183, 417
- [Barlow & Silk 1977] Barlow M.J., Silk J., 1977, ApJ, 211, L83
- [Berezhko & Ellison 1999] Berezhko E.G., Ellison D.C., 1999, ApJ, 526, 385
- [Boissier & Prantzos 1999] Boissier S., Prantzos N., 1999, MNRAS, 307, 857
- [Bontemps et al. 1996] Bontemps S., Andre P., Terebey S., Cabrit S., 1996, A&A, 311, 858
- [Cioffi, McKee & Bertschinger 1988] Cioffi D.F., McKee C.F., Bertschinger E., 1988, ApJ, 334, 252
- [Covatto & Aannestad 2000] Covatto C., Aannestad P.A., 2000, MNRAS, 318, 67
- [The CRC Handbook 1996] ‘The CRC Handbook of Chemistry and Physics’, Lide D.R., Frederikse H.P.R., (eds.), 77th Edition, 1996-97, CRC Press, London
- [Doremus 2002] Doremus R.H., 2002, ‘Diffusion of Reactive Molecules in Solids and Melts’, Wiley, New York
- [Dunne et al. 2003] Dunne L., Eales S., Ivison R., Morgan H., Edmunds M., 2003, Nature, 424, 285
- [Dwek 1998] Dwek E., 1998, ApJ, 501, 643
- [Edmunds 2001] Edmunds M.G., 2001, MNRAS, 328, 223
- [Field et al. 1997] Field D., May P.W., Pineau des Forêts, G., Flower D.R., 1997, MNRAS, 285, 839
- [Gibb et al. 2000] Gibb E.L. et al., 2000, ApJ, 536, 347
- [Greenberg & Li 1996] Greenberg J.M., Li A., 1996, A&A, 309, 258
- [Itoh 1985] Itoh H., 1985, MNRAS, 212, 309
- [Jenkins 1989] Jenkins E.B.,1989, in ‘Interstellar Dust’, proceedings of IAU Symposium 135, Santa Clara, 26-30 July 1988, L.J. Allamandola & A.G.G.M. Tielens (eds.), Kluwer, Dordrecht, p23
- [Jones 1997] Jones A.P., 1997, in ‘From Stardust to Planitessimals’, ASP Conference Series, Volume 122, Y.J. Pendleton & A.G.G.M. Tielens (eds.), p97
- [Jurac, Johnson & Donn 1998] Jurac S., Johnson R.E., Donn B., 1998, ApJ, 503, 247
- [Kitchin 1987] Kitchin C.R., 1987, ‘Stars, Nebulae and the Interstellar Medium’, Adam Hilger, Bristol
- [Kozasa, Hasegawa & Nomoto 1991] Kozasa T., Hasegawa H., Nomoto K., 1991, A&A, 249, 474
- [Li & Greenberg 1997] Li A., Greenberg J.M., 1997, A&A, 323, 566
- [Limongi & Chieffi 2003] Limongi M., Chieffi A., 2003, ApJ, 592, 404
- [McKee 1989] McKee C.F., 1989, in ‘Interstellar Dust’, proceedings of IAU Symposium 135, Santa Clara, 26-30 July 1988, L.J. Allamandola & A.G.G.M. Tielens (eds.), Kluwer, Dordrecht, p431
- [McKee et al. 1987] McKee C.F., Hollenbach D.J., Seab C.G., Tielens A.G.G.M., 1987, ApJ, 318, 674
- [May et al. 2000] May P.W., Pineau des Forêts G., Flower D.R., Field D., Allan N.L., Purton J.A., 2000, MNRAS, 318, 809
- [de Muizon et al. 1998] de Muizon M.J., D’Hendecourt L., Ehrenfreund P., Dartois E., Habing H.J., Puget J.-L., Breitfellner M., 1998, Ad. Sp. Res., 21, 11
- [Norwick & Burton 1975] Norwick A.S., Burton J.J., 1975, ‘Diffusion in Solids’, Academic Press, New York
- [Saraceno et al. 1996] Saraceno P., Andre P., Ceccarelli C., Griffin M., Molinari S., 1996, A&A, 309, 827
- [Savage & Sembach 1996] Savage B.D., Sembach K.R., 1996, Ann. Rev. A&A, 34, 279
- [Shewmon 1989] Shewmon P.G., 1989, ‘Diffusion in Solids’, Minerals, Metals and Materials Society of the USA, 2nd edition.
- [Tielens et al. 1994] Tielens A.G.G.M., McKee C., Seab C.B., Hollenbach D.J., 1994, ApJ, 431, 321
- [Todini & Ferrara 2001] Todini P., Ferrara A., 2001, MNRAS, 325, 726
- [Truelove & McKee 1999] Truelove J.K., McKee C.F., 1999, ApJS, 120, 299
- [Weingartner & Draine 2001] Weingartner J.C., Draine B.T., 2001, ApJSS, 164, 263
- [Whittet 1992] Whittet D.C.B., 1992, ‘Dust in the Galactic Environment’, IOP Publishing, Bristol
- [Whittet et al. 1996] Whittet D.C.B., Schutte W.A., Tielens A.G.G.M., Boogert A.C.A., de Graauw T., Ehrenfreund P., Gerakines P.A., Helmich F.P., Prusti T., van Dishoeck E.F., 1996, A&A, 315, L357
- [Ziegler, Biersack & Littmark 1985] Ziegler J.F., Biersack J.P., Littmark U., 1985, The Stopping and Range of Ions in Solids. Pergamon, New York
- [Zinner 1998] Zinner E., 1998, Ann. Rev. Earth & Planet. Sci., 26, 147
Appendix A Abundances
In our standard model, projectile ions were assumed to have Galactic abundances, and the ten most common elements were used, with abundances, relative to hydrogen, listed in the second column of Table A1. All other elements, at Galactic abundance, have individual abundances lower than relative to hydrogen.
| Element | Galactic | SN ejecta |
|---|---|---|
| H | ||
| He | ||
| C | ||
| N | ||
| O | ||
| Ne | ||
| Mg | ||
| Si | ||
| S | ||
| Fe |
The right-hand column of Table A1 shows abundances in supernova ejecta computed by Limongi & Chieffi [Limongi & Chieffi 2003] for a M⊙ progenitor. These figures are the sums over all isotopes shown, and averaged over the six models run for this mass.