Weak lensing mass reconstruction of the interacting cluster 1E0657-558: Direct evidence for the existence of dark matter 111Based on observations made with ESO Telescopes at the Paranal Observatories under program IDs 60.A-9203 and 64.O-0332
Abstract
We present a weak lensing mass reconstruction of the interacting cluster 1E0657558 in which we detect both the main cluster and a sub-cluster. The sub-cluster is identified as a smaller cluster which has just undergone initial in-fall and pass-through of the primary cluster, and has been previously identified in both optical surveys and X-ray studies. The X-ray gas has been separated from the galaxies by ram-pressure stripping during the pass-through. The detected mass peak is located between the X-ray peak and galaxy concentration, although the position is consistent with the galaxy centroid within the errors of the mass reconstruction. We find that the mass peak for the main cluster is in good spatial agreement with the cluster galaxies and offset from the X-ray halo at significance, and determine that the mass-to-light ratios of the two components are consistent with those of relaxed clusters. The observed offsets of the lensing mass peaks from the peaks of the dominant visible mass component (the X-ray gas) directly demonstrate the presence, and dominance, of dark matter in this cluster. This proof of the dark matter existence holds true even under the assumption of modified Newtonian gravity (MOND); from the observed gravitational shear to optical light ratios and mass peak – X-ray gas offsets, the dark matter component in a MOND regime has a total mass which is at least equal to the baryonic mass of the system.
Subject headings:
Gravitational lensing – Galaxies: clusters: individual: 1E0657-558 – dark matter1. Introduction
It has been long established that the velocity dispersions and X-ray gas temperatures of clusters of galaxies are too high to be explained solely by the amount of visible matter in the clusters using a physical model with Newtonian gravity and general relativity. This observation led to the introduction of a “dark matter” component of the mass which interacts with normal matter and light only via gravity. Recent observations of clusters suggest that the mass is made of of baryons observable in optical and infrared data, of baryons observable in X-ray data (e.g. Allen et al. 2002), and the remaining in the dark matter component.
An alternative explanation has been that the gravitational force only follows the Newtonian law at the level of the force observed in the solar system, and that at smaller values the decline with distance is less (Milgrom, 1983). This idea of modified gravity (MOND) has been used to reproduce the observed rotation velocities of spiral galaxies without inclusion of any dark matter (e.g. McGaugh & de Blok 1998), and could also explain the observed velocity dispersions and X-ray temperatures of clusters without needing any additional matter beyond the observed baryons and a small neutrino mass (Sanders, 2003). Several arguments against MOND have been made using gravitational lensing observations of galaxies and clusters (Gavazzi, 2002; Hoekstra et al., 2002; Mortlock & Turner, 2001), but because of the lack of a general relativistic theory giving the strength of the interaction between light and gravity in the MOND regime these observations can be explained by alterations in the MOND formalism (Sanders & McGaugh, 2002).
A definitive test of MOND, however, can be made with interacting clusters of galaxies. In the standard CDM paradigm, during the initial pass-through the dark matter particles and the galaxies are effectively collisionless while the X-ray halo is affected by ram pressure. As a result, one expects the galaxies and dark matter halo to remain spatially coincident following the interaction, while the X-ray halo is displaced toward the center of mass of the combined system (e.g. Tormen et al. 2003). In the CDM paradigm the mass of the X-ray halo is a small component of the total mass, and therefore the mass maps created from weak lensing should have the primary mass peaks in good spatial agreement with the galaxies. In a MOND regime, however, the X-ray gas is the dominant component of the total mass. The weak lensing mass reconstruction would therefore detect a primary mass peak coincident with the gas, which is spatially offset from the galaxy distribution.
The interacting cluster 1E0657-558 provides the ideal case in which to test this theory. First discovered by Tucker et al. (1995), subsequent analysis of ROSAT HRI data revealed that the system is comprised of two merging sub-clusters (Tucker et al., 1998). More recent Chandra and spectroscopic observations further indicate that this merger is nearly in the plane of the sky (Barrena et al., 2002; Markevitch et al., 2002), with the lower mass sub-cluster having recently exited the core of the main cluster (Markevitch et al., 2002).
The Chandra observations by Markevitch et al. (2002, 2003b) have been particularly valuable in elucidating the dynamical state and geometry of this unique system. These data reveal the presence of a prominent bow shock leading the lower mass sub-cluster ( keV), which is exiting the core of the main cluster ( keV) with a relative velocity of 4500 km s-1, determined from the gas density jump at the bow shock. Coupled with the current 0.66 Mpc separation between the two components, this velocity requires that the closest approach of the two components occurred 0.1-0.2 Gyrs ago. The merger is constrained to be nearly in the plane of the sky by the sharpness of the shock front, a result consistent with the small line-of-sight component of the sub-cluster velocity derived from the spectroscopic data by Barrena et al. (2002). Finally, a comparison of the Chandra data with optical imaging reveals that the X-ray gas associated with the bullet trails the galaxy distribution. This latter result, coupled with the simple geometry of the system, enables the definitive test of MOND that we describe below. In an accompanying paper, Markevitch et al. (2003a) utilize the combination of Chandra and weak lensing data to also constrain the collisional cross-section for self-interacting dark matter.
This is not the only system which is known to have a spatial offset between the galaxies and X-ray gas in a subcomponent. The high-redshift cluster MS1054-0321 has a double-peaked X-ray halo in which the western peak is offset from the nearby galaxy overdensity (Jeltema et al., 2001). Unlike 1E0657-558, however, no shock front is observed in the X-ray data, and as a result the relative velocities and geometry of the merging components are unknown. Further, while a weak lensing mass peak has been measured near the galaxy overdensity (Hoekstra et al., 2000; Clowe et al., 2000), the uncertainty in the position of this mass peak is quite large (Marshall et al., 2002).
In this paper we use and images taken with the FORS1 instrument in direct imaging mode on the VLT1 8-m telescope during 1998 and 2000, which were obtained from the ESO archive. These include the images used in Barrena et al. (2002), but we have independently created the final images from the raw data. In section 2 we present the weak lensing analysis of the image and discuss the significance and uncertainties in the positions of the detected mass peaks. We analyze the photometry in section 3 and give mass-to-light ratios for the detected mass peaks. Discussion of the results and our conclusions are presented in section 4. Throughout this paper we assume an , , km/s/Mpc universe unless stated otherwise.
2. Weak Lensing Analysis
Weak gravitational lensing is a method which can be used to measure the surface mass in a region by utilizing the fact that the path of a light bundle passing a gravitational potential will be bent by the potential. As a result, images of background galaxies which are near a massive structure, such as a cluster of galaxies, are deflected away from the structure, enlarged while preserving the surface brightness, and distorted such that they are stretched tangentially to the center of the potential. This third effect, known as gravitational shear (), causes the background galaxies’ ellipticities to deviate from an isotropic distribution, and the magnitude and direction of these deviations is used to measure the mass of the structure(s) causing the lensing. This technique of measuring the mass does not make any assumptions about the dynamical state of the mass, and is therefore one of the few methods which can be used to measure the mass of a dynamically disturbed system.
The first step in the weak lensing analysis is to detect background galaxies, measure their ellipticities, and correct the ellipticities for smearing due to the point spread function. We used the prescription given in Clowe & Schneider (2002) for performing this step, in which the objects are detected and have their photometry measured using SExtractor (Bertin & Arnouts, 1996), their shapes measured using the IMCAT software package (http://www.ifa.hawaii.edu/k̃aiser/imcat), and the PSF smearing correction performed using the KSB technique (Kaiser et al., 1995). Background galaxies were selected using the criteria of having , , having a detection significance in greater than 11, and having a encircled light radius larger than that of stars. This selection resulted in a catalog with a density of 12.3 galaxies/arcmin2 over a box on a side, which is complete, as measured by the departure of the number counts from a power law, to , with the faintest galaxy having .
The next step in weak lensing analysis is to convert the measured shear into a measurement for the convergence , which is related to the surface density of the lens via
| (1) |
where is a scaling factor:
| (2) |
where is the angular distance to the source (background) galaxy, is the angular distance to the lens (cluster), and is the angular distance from the lens to the source galaxy. Using the same magnitude and color selections on the HDF-S photometric redshift catalog from Fontana et al. (1999) as were used to create the background galaxy catalog results in a mean lensing redshift of , and a .
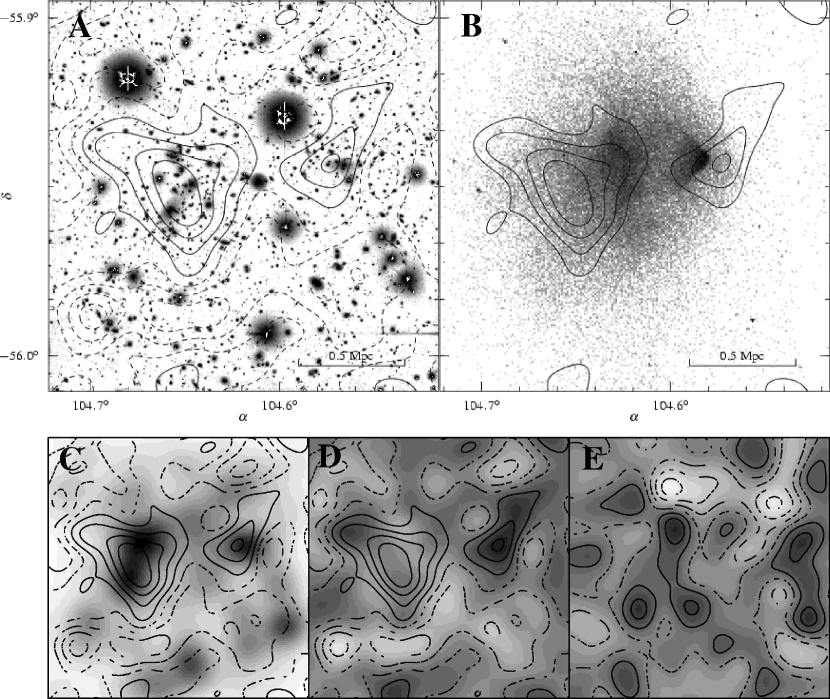
Shown in Fig. 1 in solid dark contours is a map of for this field created by using the KS93 algorithm (Kaiser & Squires, 1993) which uses the fact that both the shear and the convergence are combinations of various second derivatives of the surface potential, and therefore the Fourier transform of the shear can be converted into the Fourier transform of by the multiplication of the appropriate wave numbers. Because we are reconstructing a small field around a massive cluster, however, we actually measure the reduced shear from the background galaxy ellipticities. Therefore we must perform an iterative solution to the KS93 algorithm in which an initial map is assumed (in this case everywhere), corrected with this map to , which is then transformed to a map, which is then used in turn to correct , etc (Seitz & Schneider, 1995). This technique typically converges in a few iterations (in this case 6), and gives an measurement of in the field relative to the level of at the edge of the image, which is unknown.
As can be seen in Fig. 1, two distinct mass peaks are found in the field, each of which is spatially coincident with an overdensity of galaxies. Spectra for galaxies in both structures have been published in Barrena et al. (2002) and the two groups have the same redshift. The peaks have significances of 6.4 for the larger eastern peak (hereafter referred to as “the cluster”) and 3.0 for the smaller western peak (hereafter referred to as “the subclump”). The significances were measured by convolving the mass maps with Mexican-hat filters and comparing the filtered value at the peak position with those of randomizations of the mass maps. The randomizations were performed by first subtracting a smoothed value of the shear (smoothed using a Gaussian weighted average of the surrounding galaxy ellipticities) from the galaxy shear estimates to obtain an estimate of the intrinsic ellipticity of the galaxies, then applying a random spin to the orientation of each background galaxy while preserving their positions and intrinsic ellipticities, and creating mass maps from the catalogs.
An X-ray luminosity map from Chandra data (Markevitch et al., 2002) is overlayed in grey contours in Fig. 1. As can be seen, both peaks are also visible in the X-ray data, but are offset in position from both the galaxies and the mass peaks. From the shape, strength, and location of the shock visible in the X-ray peak for the subclump, Markevitch et al. (2002) have concluded that this system has just undergone initial infall and pass-through, and the two clusters are now moving away from one another. The separation between the galaxies, which are effectively collisionless particles in such a pass-through event, and the X-ray gas is a result of the ram pressure of the interacting gas halos slowing down the X-ray halos during the interaction. As a result, a separation between the mass peak and the X-ray peak and an agreement in positions between the mass peak and galaxy overdensity would suggest that the dark matter component of the cluster must be relatively collisionless, as compared to the X-ray emitting baryonic gas.
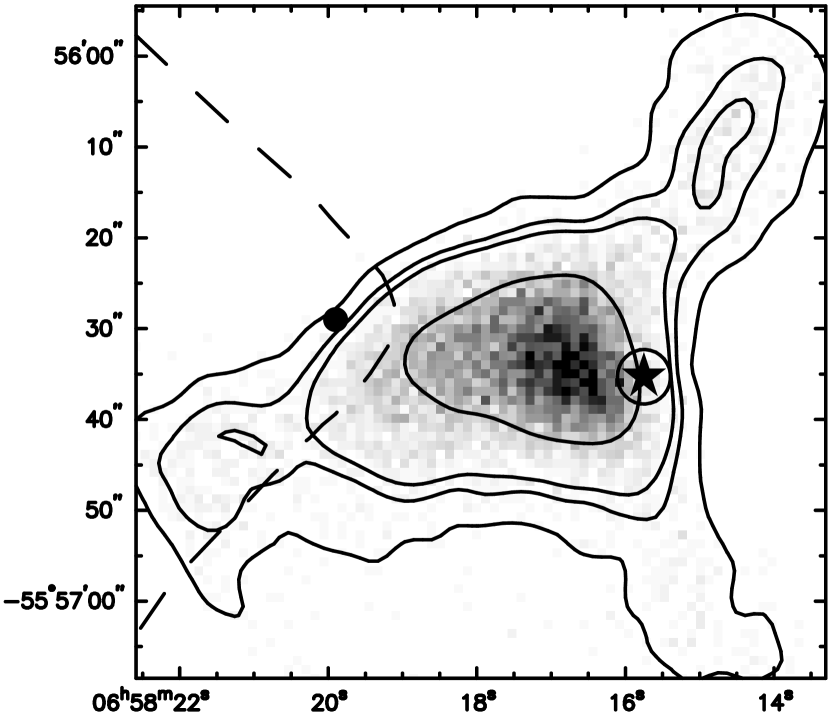
In order to place limits on the collisional cross-section of dark matter from the displacement of the mass peak from the X-ray peak, we calculated the error on the centroid determination of the subclump by performing mass reconstructions on 10,000 bootstrap-resampled catalogs of the background galaxies. For each reconstruction the map was convolved with a Mexican-hat filter to detect the nearest peak to the position of the subclump and measure its significance, imposing a minimum significance of . The resulting distribution of positions is plotted in Fig. 2. As approximately of the reconstructions should have the mass peak associated with the subclump at less than significance, we eliminated the 250 most distant peaks from the position of the subclump in the data. The remaining peaks have a rms positional offset of . The separation between the mass peak and X-ray peak in the data is , which is significant at a 1.9 confidence level. This 1-D error analysis, however, is at some level incorrect as the distribution of the peak positions is not a circular Gaussian and the resampled peak distribution has a larger rms errors in right ascension than in declination. To measure the significance in the 2-D peak position distribution we binned the data into bins and drew contours of decreasing number of peaks until the contour intersected the position of the X-ray peak. Located inside this contour were of the resampled peaks. We discuss constraints that this system gives on the collisional cross-section of dark matter in a related paper (Markevitch et al., 2003a).
The X-ray gas of the cluster is also offset from the cluster galaxies and associated dark matter peak. The dark matter peak is in good spatial agreement with the cluster galaxies, and the difference in the shape of the dark matter peak relative to the galaxy luminosity distribution seen in Fig. 1 is consistent with being caused by the noise in the mass reconstruction (Clowe et al., 2000). Using the same bootstrap-resampled catalogs described above and looking for the nearest peak to the position of the cluster gives the significance of the offset between the X-ray gas and dark matter to be . The offset gas, however, is a combination of the gas from the cluster and gas stripped from the outskirts of the subclump, and therefore requires more complicated physics to interpret.
Because the KS93 mass reconstruction can only measure the mass relative to the mean mass at the edge of the field and that the images are smaller than the expected dynamical size of the cluster (), one cannot measure the mass of the cluster reliably with the mass reconstruction in Fig. 1. Instead, we have measured the mass of the cluster using radial shear profile fitting in which one assumes a surface mass model for the cluster, converts this into a profile, and then into a profile for the reduced shear which is compared to the azimuthally averaged shear profile from the data, as shown in Fig. 3. We tried fitting a singular isothermal sphere, a NFW model (Navarro et al., 1996), and a King model to the data and found that the King model was marginally preferred over the NFW model, as measured by the between the model reduced shear profile and the data. Using an F-test (Bevington & Robinson, 1992) to compare the 1-parameter SIS to the 2-parameter NFW and King models resulted in both the NFW and King models being preferred to an SIS at confidence. We excluded a diameter region around the subclump from the shear profile in order to minimize any contamination of the profile from the subclump. Even with this excluded area, however, the fit will still include the mass of the subclump in the total mass of the cluster for radii larger than the subclump-cluster separation which will have the effects of overestimating the total mass of just the cluster itself as well as underestimating the concentration of the cluster. It should also be noted that at small smoothing lengths, the mass reconstruction of the field shows two mass peaks for the main cluster, and thus the fact that the King core-model profile is the preferred mass profile may be due to the blending of two peaks in the radial profile rather than a core in a single peak.

The King model has a mass density profile
| (3) |
which integrates to have a surface density profile
| (4) |
where , the central mass density, and , the core radius, are the fitting parameters, is the 3-D radius, and is the 2-D projected radius. The integrated NFW profile can be found in Bartelmann (1996). The best-fit parameters were for the King model and , for the NFW profile. Both models have the two parameters degenerate in the fits with poor constraints on both and . The significances of the fits, as measured by the between the model fit and a zero mass model fit, is 6.48 for the King model and 6.37 for the NFW model. The King model has surface mass measurements of , , and for 150, 250, and 500 kpc respectively. The NFW model has surface mass measurements of , , and for the same radii. These masses are in good agreement with the velocity dispersion for early-type galaxies given by Barrena et al. (2002).

In order to measure the mass of the subclump, we first had to remove the mass of the main cluster which would otherwise provide a large positive bias to the mass measurements. This was accomplished by subtracting the reduced shear profile of the best-fit King model for the cluster from the background galaxy catalog. A mass reconstruction of this catalog shows that the main cluster has been effectively removed from the lensing signal, as can be seen in Fig. 1. We fitted the three mass model profiles to the subclump shear profile, and while the King model was the preferred model, its indicated that it was not a good fit to the data. Instead, we have measured the mass of the subclump using aperture densitometry (Clowe et al., 2000; Fahlman et al., 1994), which measures the mean surface density inside a cylinder of a given radius minus the mean surface density in an annular region.
Using a 150 kpc radius for the disk and an annular region with radial extent of 640 kpc to 706 kpc resulted in a mass measurement of when centered on the middle of the subclump mass peak seen in Fig. 1 and when centered on the centroid of the red subclump galaxies. The choice of a 150 kpc radius for the mass measurement was made for two reasons: First, the mass profile for the subclump, shown in Fig. 4, shows evidence for a plateau in mass associated with the subclump between 150 and 250 kpc. This might indicate that the dark matter at larger radii has been tidally stripped from the core during the interaction. Secondly, the noise level in the aperture densitometry increases dramatically with radius, so that the signal-to-noise of the mass measurement goes from more than at to less than at .
The observed shear and derived mass of the subclump are significantly higher than could be produced by an isothermal sphere with a 212 km/s velocity dispersion, as measured by Barrena et al. (2002). This velocity dispersion, however, is measured from only 7 galaxies and could be biased low by their method for distinguishing a cluster galaxy from a subclump galaxy. Further, the conversion of a velocity dispersion to mass measurement requires the assumption of virial equilibrium, which is unlikely to apply to the subclump. The weak lensing mass is in good agreement with the 7 keV X-ray temperature for the cold gas blob, under the assumption that this was the temperature of the subclump prior to the interaction.
3. Photometry
3.1. Centroid of the Galaxy Distribution
For the standard CDM paradigm we expect the dark matter distribution to be coincident with the galaxy distribution if the dark matter particles are collisionless. To test this expectation we employ adaptive kernel smoothing to determine the centroid of the galaxy distribution associated with the lower mass sub-cluster. The method is similar to that described in Gonzalez et al. (2002). An Epanechnikov kernel with is used for the adaptive smoothing and the highest density peak within a radius is identified as the sub-cluster. We restrict the input catalog to objects with mI=18-25, color within 0.5 magnitudes of the brightest cluster galaxy (), and SExtractor stellarity indices less than 0.5 in both bands. We compute the number-weighted and flux-weighted centroids, finding that both weighting schemes yield indistinguishable results. The uncertainty is calculated by recomputing the centroid for 1,000 bootstrap-resampled catalogs.
We find that the peak of the galaxy distribution is coincident with the location of the brightest cluster galaxy. The number-weighted centroid is with a 1.9 1 Gaussian uncertainty, while the flux-weighted centroid is with a 3.0 1 uncertainty. The net separation between the galaxy and weak lensing centroids is , which has a significance of in the 1-D error analysis and in the 2-D error analysis described in the previous section.
3.2. Luminosity
The luminosity is determined using two approaches. We first derive the luminosity from the galaxy catalog, which is the typical method used in cluster measurements. We then directly compute the luminosity by integrating the total flux within the aperture, which places a hard upper limit on the luminosity. For both techniques we correct the derived luminosities for extinction (Schlegel et al., 1998) and apply corrections to convert to rest-frame passbands. The applied corrections are based upon the Bruzual & Charlot evolutionary models for a passively evolving elliptical galaxy (Bruzual A. & Charlot, 1993; Charlot et al., 1996). The integrated color is consistent with the prediction for passive evolution, indicating that this approximation is reasonable. Absolute magnitudes are converted to units of solar luminosity using the solar absolute magnitudes given in Allen’s Astrophysical Quantities (Allen & Cox, 2000).
For the catalog approach, we first cull the input photometric catalog to minimize contamination from stars and foreground galaxies. We exclude all objects that are brighter than the BCG, more than 1 magnitude redder than the BCG (i.e. ), or have stellarity index 0.8 and . Two foreground spirals are also removed from the input catalog. The flux from the remaining galaxies is then summed, with the resulting luminosity shown in Table 1. We caution that there are two caveats with this approach. First, we lack sufficient spatial coverage to employ background subtraction. The impact of background contamination is expected to be minor because of the large density contrast within our physical apertures, but such contamination will yield a positive bias in the derived luminosity. This effect will be greatest for the largest apertures. Second, incompleteness at the faint end of the luminosity function yields a negative bias in the derived luminosity. Because our data is complete to roughly 5 (6) magnitudes below in (), the magnitude of this effect should be 4.5 (2.5)% for a faint end slope .
Directly integrating the flux within the apertures provides a useful cross-check on the above technique. For this approach we only mask stars with stellarity index 0.8 and m. We then integrate the flux within the aperture, using two additional apertures located 2 north and south of the cluster to quantify the background sky level. The sky level in these apertures were computed after masking detected objects in the region, and thus the detected background level does not include flux associated with resolved galaxies (except that scattered onto the extreme wings of the PSF). Background galaxy contamination is expected to yield a slight positive bias in the derived luminosity, as with the catalog approach. The results are shown in Table 1. The luminosities derived via this method typically agree the catalog results to within 15%.
3.3. Mass-to-Light Ratios
We determine the mass-to-light ratios of both the main cluster and the sub-cluster in rest-frame and . If the sub-cluster has suffered significant mass loss during passage through the core of the main cluster, this should be reflected by a decreased mass-to-light ratio. We find no evidence for such mass loss, with the ratios for both components consistent with one another to within the uncertainties. This result implies, under the assumption that the initial ratio for the two structures were similar, that the dark matter interaction cross-section must be small, a topic that is explored in greater detail in an accompanying paper (Markevitch et al., 2003a). We further note that the derived values are consistent with other recent lensing-derived mass-to-light ratios. Dahle (2000) for instance finds for a sample of 40 low-redshift clusters. The low dispersion of the ratios in the Dahle (2000) sample also suggests that the assumption of similar intrinsic ratios for the two components in this cluster is not unreasonable.
For these mass-to-light ratio calculations for the subclump we use an aperture centered on the centroid of the galaxy light distribution, assuming that the offset in the mass peak seen in Fig. 1 is a result of noise in the shearfield. If instead we use an aperture centered on the observed mass peak for the subclump, the mass-to-light ratio of the subclump increases by . Also, the mass estimates for the subclump were created by subtracting the mean surface density in a kpc annulus from the mean surface density within the 150 kpc disc, and since no similar subtraction was performed on the light or the cluster mass, the mass-to-light ratio of the subclump must be considered a minimum value in making comparisons with the main cluster.
| Region | ||||||
|---|---|---|---|---|---|---|
| (kpc) | () | () | () | |||
| Integrated Flux Technique | ||||||
| Sub-cluster | 150 | .66.19 | 2.1 | 4.9 | 31490 | 13539 |
| Main | 150 | .95.15 | 3.5 | 7.8 | 27143 | 12219 |
| Main | 250 | 2.00.3 | 8.5 | 15.8 | 23535 | 12719 |
| Main | 500 | 4.40.7 | 17.4 | 32.5 | 25340 | 13522 |
| Catalog Technique | ||||||
| Sub-cluster | 150 | 2.4 | 3.8 | 27579 | 17450 | |
| Main | 150 | 3.2 | 6.3 | 29747 | 15119 | |
| Main | 250 | 8.1 | 12.9 | 24737 | 15523 | |
| Main | 500 | 21.4 | 28.8 | 20632 | 15224 | |
Note. — Due to the different method in which the main cluster and subclump masses were measured, the subclump ratios must be considered a lower bound when comparing with the main cluster.
4. Discussion and Conclusions
In a CDM universe, one would expect that the mass peaks for the cluster and subclump would agree with the centroid of the galaxy distributions, as both galaxies and dark matter particles are collisionless in such an interaction (Tormen et al., 2003). One would also expect that the mass-to-light ratios would decrease by as compared to relaxed systems due to the baryonic X-ray halo mass being removed from the structures. Such a scenario is, within errors, in good agreement with the data.
In a purely baryonic MOND universe the X-ray and galaxy centroids would still be separated as the galaxies are still collisionless particles in the interaction. However, because the X-ray halo is the dominant mass component of the visible baryons in the cluster, in the absence of a dark mass component the vast majority, , of the mass of the subclump would be with the X-ray gas. Thus, any direct method to measure the mass of the system would detect a higher mass about the stripped X-ray halo than around the galaxies. This is not what is observed in this system. In order to quantify how much these observations disagree with MOND, however, we first need to determine a method to measure the masses of the clusters in a MOND cosmology.
Unfortunately, because there is not a derivation of MOND from general relativity, there is not a definitive way to measure a mass with weak lensing from a measured shear field. If one assumes that the relation from general relativity between the deflection of a photon and of a massive particle moving at the speed of light by a static gravitational field is unchanged by MOND, then it can be shown that the shear field caused by a point mass is
| (5) |
where is the distance from the point mass, is the Einstein radius for the lens, is the distance at which the gravitational acceleration changes from Newtonian to MOND, and is the distance at which the gravitational acceleration changes back to a law (Mortlock & Turner, 2001; Hoekstra et al., 2002). As both and scale as the square root of the point mass, the resulting shear profile scales linearly with the mass for and , as the square root of the mass for , and somewhere between the two extremes for the transitional regions and .
Calculating the expected shear profile for an extended source in the MOND regime is complicated by the lack of a thin lens approximation, which is used to simplify the equations with Newtonian gravity (Mortlock & Turner, 2001). However, it is reasonable to assume that the same general relation between the gravitational shear field and overall mass of a halo exists as per the point mass relation. As such, the level of weak shear produced by a cluster of galaxies at a radii of a few hundred kpc from the cluster core (which would be between and for to clusters) should scale with the mass of the cluster, probably somewhere between a linear scale and a scale with the square root of the mass.
From observations, we know that the shear fields produced by individual galaxies (Hoekstra et al., 2003; McKay et al., 2002) are an order of magnitude lower than those produced by galaxy groups (Hoekstra et al., 2001), which are an order of magnitude lower than those produced by poor clusters (Wittman et al., 2000), which are in turn significantly lower than those produced by rich clusters (Dahle et al., 2002; Clowe et al., 2000; Clowe & Schneider, 2001, 2002). As the amount of visible baryons in these structures scale in a similar manner, then from these observations we have support for the above assumptions. Thus, in a MOND universe, one should still observe a change in the shear field of a structure with a change in the mass of the structure.
As a result, if the mass of clusters of galaxies is limited solely to visible baryons, then by removing the X-ray halo from the cluster one should reduce the gravitational shear centered on the galaxies by at least a factor of three, if the shear scales as the square root of the mass, and up to a factor of ten if the shear scales linearly with the mass. In this system, however, we find that the ratio of the gravitational shear to visible light for two components which have the X-ray halo stripped from the galaxies is consistent with that found in normal clusters, which have the X-ray halo and galaxies spatially coincident. This is inconsistent with the shear scaling as the square root of the mass MOND model at roughly a confidence level and with the shear scaling linear with the mass at roughly a confidence level.
In order to reduce the inconsistency with the data to a confidence level, one would need to add a non-luminous mass component to the clusters which is equal to the mass of luminous matter for the shear scaling as square root of mass case, and which is 2.5 times the mass of luminous matter for shear scaling linearly with mass case. This extra mass component would also reduce the problem with the detected mass peak for the subclump being closer to the galaxies than the X-ray halo as the detected signal would be a blend of the two components due to the required smoothing of the mass map.
The more significant offset between the cluster mass peak and X-ray halo would require a greater amount of dark mass to explain if the two components were cleanly separated. The X-ray halo, however, is extended over the cluster galaxies which may indicate some fraction of the X-ray gas has already been drawn back to the galaxy position.
Any dark mass component of the system must be relatively collisionless, so it can undergo the pass-through without loss of velocity or mass, and able to clump on scales smaller than 100 kpc (the smallest aperture for which we can reliably measure the shear about the subclump). Adopting big-bang nucleosynthesis limits on the mean baryonic mass of the universe excludes most of this mass from being baryons in cold, condensed structures. The clumpiness limit excludes the matter from being massive neutrinos with masses less than 4.5 eV (Sanders, 2003; Tremaine & Gunn, 1979). Since neutrinos more massive than 2.2 eV have been ruled out experimentally (Bonn et al., 2002; Lobashev et al., 2001), neutrinos thus cannot explain this mass.
4.1. Summary
We have shown above that the cluster 1E0657558 has a lower-mass subclump visible in X-ray and optical observations as well as in a weak lensing mass reconstruction. The X-ray and optically luminous components are spatially separated at high significance, as one would expect for a system which has just undergone an initial infall and transit of a larger mass system (e.g. Tormen et al., 2003). The observed mass peak in the weak lensing reconstruction lies between X-ray and optical components, but is closer to, and consistent with, the optical component. The centroid of the subclump mass peak has a fairly large error resulting in the offset of mass peak from the centroid of the galaxy distribution having a confidence level and the offset of the mass peak from the X-ray peak having a confidence level.
The primary cluster has also been detected in the weak lensing mass reconstruction, and has a mass peak which is spatially coincident with the cluster galaxies. The X-ray gas from the main cluster is offset from the mass peak at a significance.
We have also measured the mass-to-light ratio for the subclump at a 150 kpc radius and for the main cluster at 150, 250, and 500 kpc radii. We find that the subclump has a mass-to-light ratio which is consistent with the mass-to-light ratio of the main cluster, and that both are consistent with mass-to-light ratios for relaxed clusters. The dominant source of error in the mass-to-light ratios and the mass–X-ray gas offsets is the weak lensing mass reconstructions, which can be improved by obtaining shear information on a wider field than the VLT field and/or by obtaining deeper imaging on the same field with a smaller PSF in order to greatly increase the number density of background galaxies usable for the measurement of the shear field.
Finally, we have argued that even in a MOND universe, a significant fraction of the original mass of the subclump must exist in the form of dark matter which, furthermore, should be non-baryonic and non-neutrino. The exact amount of extra mass cannot be calculated due to the lack of a MOND derivation from general relativity, but phenomenological arguments suggest that it is at least equal to the baryonic mass of the cluster. While these observations cannot disprove MOND, or alternatively prove that gravity is Newtonian on small acceleration scales, they remove its primary motivation of avoiding the notion of dark matter.
References
- Allen & Cox (2000) Allen, C. & Cox, A. 2000, Allen’s Astrophysical Quantities, 4th edition (Springer Verlag)
- Allen et al. (2002) Allen, S. W., Schmidt, R. W., & Fabian, A. C. 2002, MNRAS, 334, L11
- Barrena et al. (2002) Barrena, R., Biviano, A., Ramella, M., Falco, E. E., & Seitz, S. 2002, A&A, 386, 816
- Bartelmann (1996) Bartelmann, M. 1996, A&A, 313, 697
- Bertin & Arnouts (1996) Bertin, E. & Arnouts, S. 1996, A&AS, 117, 393
- Bevington & Robinson (1992) Bevington, P. R. & Robinson, D. K. 1992, Data Reduction and Error Analysis for the Physical Sciences (WCB/McGraw-Hill, Boston)
- Bonn et al. (2002) Bonn, J., Bornschein, B., Bornschein, L., et al. 2002, Nuclear Physics B Proceedings Supplements, 110, 395
- Bruzual A. & Charlot (1993) Bruzual A., G. & Charlot, S. 1993, ApJ, 405, 538
- Charlot et al. (1996) Charlot, S., Worthey, G., & Bressan, A. 1996, ApJ, 457, 625
- Clowe et al. (2000) Clowe, D., Luppino, G. A., Kaiser, N., & Gioia, I. M. 2000, ApJ, 539, 540
- Clowe & Schneider (2001) Clowe, D. & Schneider, P. 2001, A&A, 379, 384
- Clowe & Schneider (2002) —. 2002, A&A, 395, 385
- Dahle (2000) Dahle, H. 2000, in The NOT in the 2000’s. Proceedings of the workshop held on La Palma, April 12-15, 2000. Edited by Nils Bergvall, Leo O. Takalo, and Vilppu Piirola. Published by the University of Turku, Tuorla Observatory, FIN - 21500 Piikkiö, Finland, ISBN 951-29-1827-7, p.45, 45
- Dahle et al. (2002) Dahle, H., Kaiser, N., Irgens, R. J., Lilje, P. B., & Maddox, S. J. 2002, ApJS, 139, 313
- Fahlman et al. (1994) Fahlman, G., Kaiser, N., Squires, G., & Woods, D. 1994, ApJ, 437, 56
- Fontana et al. (1999) Fontana, A., D’Odorico, S., Fosbury, R., et al. 1999, A&A, 343, L19
- Gavazzi (2002) Gavazzi, R. 2002, New Astronomy Review, 46, 783
- Gonzalez et al. (2002) Gonzalez, A. H., Zaritsky, D., Simard, L., Clowe, D., & White, S. D. M. 2002, ApJ, 579, 577
- Hoekstra et al. (2000) Hoekstra, H., Franx, M., & Kuijken, K. 2000, ApJ, 532, 88
- Hoekstra et al. (2003) Hoekstra, H., Franx, M., Kuijken, K., Carlberg, R. G., & Yee, H. K. C. 2003, MNRAS, 340, 609
- Hoekstra et al. (2001) Hoekstra, H., Franx, M., Kuijken, K., et al. 2001, ApJ, 548, L5
- Hoekstra et al. (2002) Hoekstra, H., Yee, H. K. C., & Gladders, M. D. 2002, New Astronomy Review, 46, 767
- Jeltema et al. (2001) Jeltema, T. E., Canizares, C. R., Bautz, M. W., Malm, M. R., Donahue, M., & Garmire, G. P. 2001, ApJ, 562, 124
- Kaiser & Squires (1993) Kaiser, N. & Squires, G. 1993, ApJ, 404, 441
- Kaiser et al. (1995) Kaiser, N., Squires, G., & Broadhurst, T. 1995, ApJ, 449, 460
- Lobashev et al. (2001) Lobashev, V. M., Aseev, V. N., Belesev, A. I., et al. 2001, Nuclear Physics B Proceedings Supplements, 91, 280
- Markevitch et al. (2003a) Markevitch, M., Gonzalez, A. H., Clowe, D., et al. 2003a, ApJ, submitted
- Markevitch et al. (2002) Markevitch, M., Gonzalez, A. H., David, L., et al. 2002, ApJ, 567, L27
- Markevitch et al. (2003b) Markevitch, M. et al. 2003b, in prep
- Marshall et al. (2002) Marshall, P. J., Hobson, M. P., Gull, S. F., & Bridle, S. L. 2002, MNRAS, 335, 1037
- McGaugh & de Blok (1998) McGaugh, S. S. & de Blok, W. J. G. 1998, ApJ, 499, 66
- McKay et al. (2002) McKay, T. A., Sheldon, E. S., Johnston, D., et al. 2002, ApJ, 571, L85
- Milgrom (1983) Milgrom, M. 1983, ApJ, 270, 365
- Mortlock & Turner (2001) Mortlock, D. J. & Turner, E. L. 2001, MNRAS, 327, 557
- Navarro et al. (1996) Navarro, J. F., Frenk, C. S., & White, S. D. M. 1996, ApJ, 462, 563
- Sanders (2003) Sanders, R. H. 2003, MNRAS, 342, 901
- Sanders & McGaugh (2002) Sanders, R. H. & McGaugh, S. S. 2002, ARA&A, 40, 263
- Schlegel et al. (1998) Schlegel, D. J., Finkbeiner, D. P., & Davis, M. 1998, ApJ, 500, 525
- Seitz & Schneider (1995) Seitz, C. & Schneider, P. 1995, A&A, 297, 287
- Tormen et al. (2003) Tormen, G., Moscardini, L., & Yoshida, N. 2003, MNRAS, in press
- Tremaine & Gunn (1979) Tremaine, S. & Gunn, J. E. 1979, Physical Review Letters, 42, 407
- Tucker et al. (1998) Tucker, W., Blanco, P., Rappoport, S., et al. 1998, ApJ, 496, L5
- Tucker et al. (1995) Tucker, W. H., Tananbaum, H., & Remillard, R. A. 1995, ApJ, 444, 532
- Wittman et al. (2000) Wittman, D., dell’Antonio, I., Tyson, T., et al. 2000, in Constructing the Universe with Clusters of Galaxies