11email: lorenzo@rm.iasf.cnr.it 22institutetext: SRON National Institute for Space Research, Sorbonnelaan 2, NL-3584 CA Utrecht, the Netherlands
33institutetext: Astronomical Institute, Utrecht University, P.O.Box 80000, NL-3508 TA Utrecht, the Netherlands
44institutetext: Dept. of Physics and Astronomy, University of Southampton, Hampshire SO17 1BJ, U.K.
Two spectral states of the transient X-ray burster SAX J1747.0-2853
The neutron star binary SAX J1747.0-2853, located in the Galactic Center region at about 0.5 deg from Sgr A* and at a distance of kpc, has been observed in outburst four times (1998, 1999, 2000 and 2001) by BeppoSAX and RossiXTE. At the time of its discovery in 1998 the source was observed in a low/hard state, showing a hard tail with a high energy cutoff of keV. About two years later the source reappeared about one order of magnitude brighter in the X-rays (0.5-10 keV) and with a significantly steeper spectrum. As was the case for the low state, the data could be fitted by an input model based on two continuum primary components: a) a soft thermal excess, which is times more luminous than the one found in hard state; b) a non-thermal component which is compatible with either a power-law or a comptonization spectrum. The soft component is equally well described by pure blackbody or multi-color disk emission, with significantly higher temperature than observed in low state ( vs. the keV assuming pure blackbody). For this model, the flux of the non-thermal component below keV is a significant fraction of the total X-ray flux, i.e. greater than % in the 2-10 keV band.
Key Words.:
binaries: close, individual (SAX J1747.0-2853) — X-rays: bursts1 Introduction
X-ray bursters are an important and rich subclass of low-mass X-ray binaries (LMXB), consisting of weakly magnetized neutron stars accreting from a low mass companion and experiencing thermonuclear flashes. These flashes, normally lasting a few seconds to minutes, are known in the literature as type I bursts (see reviews in Lewin, van Paradijs & Taam (1993); Strohmayer & Bildsten (2003)) and produce mainly X-rays by unstable burning of (a fraction of) the material accreted on the surface of the neutron star (NS). Sometimes very energetic X-ray bursts are observed, characterized by an expansion of the neutron star atmosphere, due to an energy release above the Eddington limit. These can be easily identified as the expansion of the photosphere and the subsequent cooling strongly modify the spectrum and the temporal profile of the burst. The determination of the maximum intensity can be used to estimate the distance to the source on the assumption of burst emission isotropy, of given object mass (usually the standard 1.4 for a NS) and helium abundance (e.g., Kuulkers et al. (2003)).
The transient source SAX J1747.0-2853, discovered in March 1998 by the Wide Field Cameras on board BeppoSAX (in ’t Zand et al. (1998)) has been seen to emit many X-ray bursts, including a radius expansion event which allowed an estimate of the source distance as kpc (Natalucci et al. (2000); hereafter, Paper I). As the source has a small angular distance to the Galactic Center (GC), at 0.5 deg from Sgr A*, it is very likely that it is located deep in the GC region, probably at a distance of no more than a few hundred parsecs from Sgr A*. During the discovery outburst lasting weeks (see Paper I), a wide band spectrum was obtained by observation with the BeppoSAX Narrow Field Instruments (NFI), and was found to be dominated by a hard tail extending at least up to keV. The source showed a slow rise, low intensity outburst, and reached a luminosity of erg s-1 (2-10 keV) at its maximum. The continuum emission was well fitted by a Comptonization spectrum (Titarchuck (1994)) plus a soft component which could be well described by a blackbody spectrum with temperature =() keV. Two years later, in the spring of 2000 a new, brighter outburst was detected with the source intensity reaching about 140 mCrab (Markwardt et al. (2000); Murakami et al. (2000)). This is the most luminous outburst detected so far from this source. A RXTE/PCA light curve was published by in ’t Zand et al. (2001) showing a fast rise, exponential decay light curve with multiple peaks. The BeppoSAX/NFI were pointed again in the direction of SAX J1747.0-2853 on 2000 March 13, when the source intensity was mCrab in the 2-10 keV band ( erg s-1), and the source had just started to decline from its maximum. The results of this observation will be described in the present paper.

After the March 2000 outburst, SAX J1747.0-2853 showed activity for more than one year, with detection of more bursts by the BeppoSAX/WFC and occurrence of minor outbursts (Werner et al. (2003)). A significant, brighter flare took place on Sept 2001 with a peak intensity of mCrab. as shown by the RXTE/ASM light curve published by Wijnands, Miller & Wang (2002). During this activity period, the source was observed by Chandra in its Galactic Center Survey on July 8th, 2001. It was detected with an unabsorbed flux of mCrab in the X-ray band (Wijnands, Miller & Wang, 2002), i.e. a 0.5-10 keV luminosity of erg s-1. The Chandra observation allowed to determine with high accuracy the source position: and ’ ” (equinox 2000, 1 error radius ). A new determination of the source distance is available by the detection of a radius expansion burst by the GRANAT/ART-P telescope on October 20, 1991 (Grebenev et al. (2002)). The authors reported a distance of kpc assuming a 1.4 NS. This is fully consistent with the value of kpc reported in Paper I, obtained from spectral analysis of the 1998 radius expansion burst.
The detection of the early burst by ART-P is intriguing. An upper limit to the source luminosity at the epoch of the burst is set by Grebenev et al. (2002) at erg s-1 in the 4-26 keV band. This suggests that the source was active more than ten years ago, and that the occurrence of regular, frequent outbursts is a characteristic of SAX J. This is also supported by the possibility of earlier detections with error boxes consistent with the position of the source, namely, the transient GX 0.2-0.2 observed by Ariel 5 (Proctor, Skinner & Willmore 1978).
2 Observations and data analysis
The BeppoSAX/NFI were pointed towards SAX J1747.0-2853 on 2000 March 13, for a single observation with a total elapsed time of s. An image obtained with one of the units of the Medium Energy Concentrator Spectrometer (MECS, Boella et al. (1997)) is shown in Fig 1. The MECS active detectors for this observations were the two units MECS2 and MECS3, for a total exposure time of s.
Parameters description and units: , Wisconsin absorption parameter in units of cm-2; , photon index of power law component; , temperature of the comptonized soft seed photons, in keV; , temperature of the blackbody component, in keV; , normalization expressed as , where r is the blackbody radius in km and d is the distance to the source in units of 10 kpc; , where is the disk inclination angle and is the disk inner radius in km, for a source at 10 kpc; , centroid energy of gaussian line profile, in keV.
| Model | Parameter values and errors | [dof] | |
| ( cm-2) | |||
| BB+Diskbb+Gaussian | =, =, =, =, | 1.08 [110] | |
| = | |||
| BB+Powerlaw+Gaussian | =, =, , = | 1.05 [110] | |
| Diskbb+Powerlaw+Gaussian | =, =, =, = | 1.03 [110] | |
| BB+Comptt+Gaussian | =, =, =, = | 1.03 [108] | |
| Diskbb+Comptt+Gaussian | =, =, =, = | 1.05 [108] |

Being very close to GC, the observed field is complex. In the MECS images, two other sources are visible in the field-of view: 1E1743.1-2843 (Cremonesi et al., 1999; Pourquet et al., 2003) and the X-ray source associated with Sgr A*. At the epoch of the observation, HPGSPC was no more operational, so the energy bands available were: the 0.2-10.5 keV range, covered by the Low Energy Concentrator Spectrometer (LECS, Parmar et al. 1997) and MECS; and 15-200 keV, covered by the Phoswich Detector System (PDS, Frontera et al. 1997a ). The LECS exposure time for this observation was s. For LECS and MECS we used the following energy bands for analysis: 0.2-4.0 keV for LECS and 1.8-10.5 keV for MECS. At high energies, problems of source contamination led us to exclude the PDS data from the spectral fitting: in particular, the high energy source 1E 1740.7-2942 is at from the pointing position, resulting in a () % illumination of the detector area, as estimated from the PDS collimator response (Frontera et al. 1997b ). This contamination was much less important for the 1998 observation, due to both the strenght of the hard X-ray emission from SAX J1747.0-2853 and its hard spectral shape (see discussion in Paper I). The same considerations, however, are not true for our March 2000 observation, because the total high energy flux detected by the PDS was lower by a factor and also, the measured spectrum is much steeper (see discussion below).
We then decided to use only low energy data for spectral analysis. To subtract the background from the concentrator’s data, we used the procedure described in Paper I, with the same background extraction regions. We carefully checked the MECS light curve to verify that no X-ray bursts were present. In Table 1 are listed the results of the spectral fitting. All the best fit models include a weak iron emission line, which is detected above the continuum with an equivalent width of ( eV (see also Fig. 2). The agreement between data and models is high ( for all the fits, without including any systematic errors). The line is narrow and its centroid is keV. Without this narrow feature, the quality of the fit degrades to a for dof, so we consider its detection significant. An iron line of similar strenght and energy was also observed in March 1998, in the low/hard state, together with an absorption edge at keV. No indication of an absorption edge is present in the 2000 data, when adding this component in all model fits. There are basically two classes of models that can adequately describe the observed spectrum. The first one is a completely thermal spectrum, for which we have found an acceptable fit by adding two components: a pure blackbody spectrum, characterized by keV and an emission radius compatible with the NS size, and a multi-color disk (MCD) blackbody (Mitsuda et al. (1984)) with an inner disk temperature keV. The second class of models include a power-law or comptonized component, plus a blackbody (yielding keV) or MCD blackbody.
In both model classes, the maximum of the emitted power is found in the band 2-10 keV (see Fig. 3). However, if the comptonized component is present (as for the case of the 1998 low state) there would be significant hard X-ray emission. In the case of thermal Comptonization (i.e., comptt in XSPEC v.11) the shape of the hard X-ray spectrum depends on the Comptonization parameter (Titarchuck (1994)): for a spherical cloud geometry, / . The spectral fits below 10.5 keV cannot constrain the plasma temperature and the optical depth , but only the seed photon temperature keV (corresponding to the original energy spectrum of the scattered photons) which is not relevant to determine the high energy tail. The best fit Comptonization spectra reported in Table 1 converge at keV. These yield, in the energy band 2-10 keV, an overall (unabsorbed) flux of erg cm-2 s-1 of the comptonized component against a corresponding value of erg cm-2 s-1 of the blackbody flux.
In order to investigate the presence of hard X-ray emission above keV we have analyzed the PDS spectrum measured during the observation. Indeed, all the models listed in Table 1 are significantly below the spectral points of the PDS. Fitting the latter with a power-law, yields a photon index ( for 9 d.o.f.) in the energy range 30-200 keV, for a total measured intensity of mCrab. The spectral index is too high to be totally ascribed to illumination by 1E 1740.7-2942 (see e.g. Main et al. (1999)). The model flux at keV is about 10 times lower than the spectrum obtained by Sidoli et al. (1999) for 1E 1740.7-2942, which is compatible with the expected factor in exposed area for the two spectra. However, this ratio reduces to about a factor 3 at keV. This suggests that additional high energy flux is present at keV. Later observations of the same field have detected significant variability of the PDS flux (Werner et al. (2003)) proving that most of the high energy flux comes from point sources. Besides 1E 1740.7-2942, the only known high energy source located close to our transient (at ) is the persistent X-ray burster A1742-294. So far, the latter has been detected above keV only once, with an intensity of mCrab in the 35-100 keV band (Churazov et al. (1995)). For these reasons, it is very likely that a significant fraction of the high energy flux in the range 30-100 keV is originated from SAX J1747.0-2853. In this case, the first class of models based on thermal only (NS and disk) origin would be ruled out for this observation.
3 Conclusions
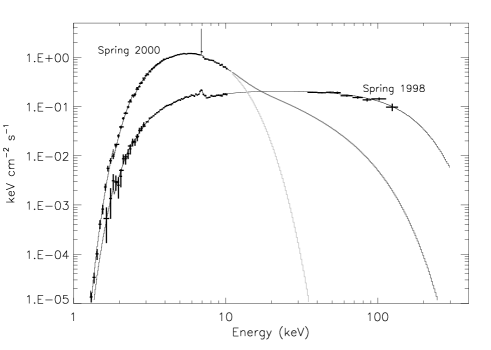
The two observations performed by BeppoSAX in 1998 and 2000 show the existence of two different spectral states for the transient burster SAX J1747.0-2853 (see Fig. 3). In March 2000, the prominent hard tail observed in the 1998 low/hard state outburst is absent or significantly reduced, whereas the X-ray emission is characterized by a soft component with temperature keV. This is a factor higher than the one detected in the low/hard state, with a significant change in temperature ( keV in the low state spectrum). The emission region of the thermal component, determined from the observed colour temperature, has a size corresponding to a blackbody radius km. i.e. coincident or very close to the NS surface. This component, when modelled by MCD, has an inner disk temperature of keV and a normalization corresponding to an inner radius / km, where is the angle of inclination. We remark that, for both models, the measured radii are most probably underestimated by a factor , due to the expected hardening of the original thermal spectrum induced by electron scattering (Ebisawa et al. (1994), Shimura & Takahara (1995)).
The X-ray spectrum seems to be characterized by a significant non-thermal component which could be responsible for a substantial fraction of the total X-ray flux. Using as reference the 2-10 keV range, the detected intensity of this component is greater than erg cm-2 s-1, i.e. % of the total. The production of hard X-rays during the rise and close to the maximum of an outburst is a feature commonly observed in transient Black Hole Candidates (BHC). This is the so-called very high state (see e.g., Chen & Taam (1996)), to distinguish it from the high state which occurs later, and is characterized by the luminosity of the non-thermal component being comparable to the disk luminosity. The spectrum of SAX J1747.0-2853 seems highly reminiscent of this behaviour. Nevertheless, we could not firmly establish the characteristics of the non-thermal component by direct spectral measurements at keV, due to a high source confusion being present in this region.
As for the 1998 observation, the X-ray spectrum measured in the spring of 2000 presents evidence for a weak (equivalent width eV), narrow emission line near keV. The energy of both lines suggests a ionization stage compatible with Fe XXVI. An iron absorption edge has been detected only in the 1998 spectrum at () keV. Its energy indicates a significantly lower ionization. It is then possible that the iron line originates from a fully ionized portion of the accretion disk (probably the inner region) or in the NS boundary layer, whilst the edge observed in 1998 is produced in a different, mildly ionized absorbing region of the disk. The Fe edge is not detected in the high/soft state.
Acknowledgements.
The BeppoSAX satellite is a joint Italian and Dutch programme. We thank ASI for continuous support of the mission and operations.References
- Boella et al. (1997) Boella, G. et al. 1997, A&AS, 122, 327
- Chen & Taam (1996) Chen, X., & Taam, R.E., 1996, ApJ, 466, 404
- Churazov et al. (1995) Churazov, E., Gilfanov, M., Sunyaev, R., et al., 1995, ApJ, 443, 341
- Cremonesi et al. (1999) Cremonesi, D., Mereghetti, S., Sidoli, L. & Israel, G.L., 1999, A&A, 345, 826
- Ebisawa et al. (1994) Ebisawa, K., Ogawa, M., Aoki, T., et al., 1994, PASJ, 46, 375
- (6) Frontera, F. et al. 1997a, Astron. Astrophys. Suppl. 122, 357
- (7) Frontera, F. et al. 1997b, SPIE Proceedings, vol. 3114, p. 206
- Grebenev et al. (2002) Grebenev, S.A. et al. 2002, Astronomy Letters Vol.28, No.12, 799
- Hua & Titarchuck (1995) Hua, X., & Titarchuck L., 1995, ApJ, 449, 188
- Kuulkers et al. (2003) Kuulkers, E., Den Hartog, P.R., in’t Zand, J.J.M., et al., 2003 A&A, 399, 663
- in ’t Zand et al. (1998) in ’t Zand, J.J.M et al. 1998, IAU Circ. 6846
- in ’t Zand (2001) in ’t Zand, J.J.M 2001, in ”Exploring the Gamma-Ray Universe”, Proc. 4th INTEGRAL Workshop, ESA-SP 459, p.463
- Lewin, van Paradijs & Taam (1993) Lewin, W.H.G., van Paradijs, J., & Taam, R.E. 1993, Space Sci. Rev., 62, 223
- Main et al. (1999) Main, D.S., et al., 1999, ApJ, 525, 901
- Markwardt et al. (2000) Markwardt, C.B. et al. 2000, IAU Circ. 7377
- Mitsuda et al. (1984) Mitsuda, K., et al. 1984 PASJ, 36, 741
- Morrison & McCammon (1983) Morrison, R., & McCammon, D. 1983, ApJ, 270, 119
- Murakami et al. (2000) Murakami, H. et al. 2000, IAU Circ. 7378
- Natalucci et al. (2000) Natalucci et al. 2000, ApJ, 543, L73
- Pourquet et al. (2003) Pourquet, D. et al. 2003, A&A, submitted (astro-ph 0305489)
- Proctor, Skinner & Willmore (1978) Proctor, R.J., Skinner. G & Willmore, A.P. 1978, MNRAS, 185, 745
- Shimura & Takahara (1995) Shimura, T., & Takahara, F., 1995, ApJ, 445, 780
- Sidoli et al. (1999) Sidoli, L. et al. 1999, ApJ, 525, 215
- Strohmayer & Bildsten (2003) Strohmayer, T.E., & Bildsten, L. 2003, in Compact Stellar X-Ray Sources, eds. W.H.G. Lewin and M. van der Klis, Cambridge University Press, in press (astro-ph/0301544)
- Titarchuck (1994) Titarchuck L., 1994, ApJ, 434, 570
- Werner et al. (2003) Werner, N., int’Zand, J.J.M., Natalucci, L., et al., in preparation (to be submitted to A&A)
- Wijnands, Miller & Wang (2002) Wijnands, R., Miller, J.M. & Wang, Q.D. 2002, ApJ579, 422