L1157: Interaction of the molecular outflow with the Class 0 environment
We present high angular resolution interferometric observations [††thanks: Based on observations carried out with the IRAM Plateau de Bure Interferometer. IRAM is supported by INSU/CNRS (France), MPG (Germany) and IGN (Spain).] of the dust continuum at 2.7 and 1.3 mm, and of the HC3N (=1211) and C18O (=21) emission around L1157-mm, a Class 0 object that drives a spectacular molecular outflow. The millimeter dust emission is clearly resolved into two components, a flattened compact source of 450250 AU at 1.3 mm, and mass 0.1 , plus an extended envelope of 3000 AU at 1.3 mm, and mass 1.1 . The millimeter spectral index varies throughout the region, with the lower value found toward the compact protostar, possibly indicating grain growth in the denser regions. A strong interaction between the molecular outflow and the close protostellar environment is taking place and affects the structure of the innermost parts of the envelope. This is shown by the spatial coincidence between the molecular outflow and the dust (1.3 mm continuum) and HC3N emission: both tracers show structures associated to the edges of the outflow lobes. Basically, the global picture sketched for the Class 0 object L1157-mm by Gueth et al. (1997) is supported. We find possible evidence of infall, but we do not detect any velocity gradient indicative of a rotating circumstellar disk.
Key Words.:
individual: L1157 — stars: formation — stars: circumstellar matter — ISM: dust — ISM: molecules radio lines: molecular1 Introduction
Class 0 low-mass young stellar objects are deeply embedded in circumstellar dust and gas material, and are found associated with very energetic molecular bipolar outflows. Theory outlines a scenario where a central object is surrounded by an infalling envelope that contains most of the mass (e.g. Larson 1969; Adams, Lada, & Shu 1987). This infalling material is accreted onto the central protostar funneled through a circumstellar disk that grows as the system evolves (e.g. Cassen & Moosman 1981; Terebey, Shu, & Cassen 1984; Shu, Adams, & Lizano 1987). On the other hand, a powerful outflow is accelerated and collimated via a magnetohydrodynamic mechanism from the surface of the accretion disk (Pudritz & Norman 1983; Heyvaerts & Norman 1989; Shu et al. 1994; Königl & Pudritz 2000). Infalling, outflowing and rotational motions are, thus, simultaneously taking place in extremely young protostar environments, making the morphology and kinematics of such regions very complex. Observations of the millimeter thermal dust continuum and high-density molecular tracers can, in principle, reveal the phenomena taking place in the innermost parts of dense cores (e.g. Saito et al. 1996; Ohashi et al. 1997, 1999; Lai & Crutcher 2000; Hogerheijde 2001). However, the strong interaction between the outflow and the surrounding dense material, which has been actually observed near the driving source in a few cases (e.g. L1551-IRS5: Fuller et al. 1995, Ladd et al. 1995; L1157: Gueth et al. 1997; L1527: Ohashi et al. 1997, Hogerheijde et al. 1998, Motte & André 2001), complicates this portrait. In order to get an accurate picture of the complex environment of Class 0 objects and to interpret the gas kinematics in these sources, high angular resolution interferometric observations of different tracers are definitely required.
L1157-mm is a Class 0 object located at 440 pc with a . It is associated with IRAS 20386+6751 and drives a spectacular outflow. The L1157 outflow has been studied in details through many molecular lines, such as CO (Umemoto et al. 1992; Gueth, Guilloteau, & Bachiller 1996; Bachiller & Pérez Gutiérrez 1997; Hirano & Taniguchi 2001), SiO (Zhang et al. 1995, 2000; Gueth, Guilloteau, & Bachiller 1998; Bachiller et al. 2001), H2 (Hodapp 1994; Davis & Eislöffel 1995), NH3 (Bachiller, Martín-Pintado, & Fuente 1993; Tafalla & Bachiller 1995), or CH3OH (Bachiller et al. 1995, 2001; Avery & Chiao 1996). Many other lines have been detected (Bachiller & Pérez Gutiérrez 1997; Bachiller et al. 2001), making L1157 the prototype of chemically active outflows. Regarding the protostar itself, dust continuum observations have been carried out at 2.7 mm (Gueth et al. 1996, 1997), 1.3 mm (Shirley et al. 2000; Motte & André 2001; Chini et al. 2001; Gueth et al. 2003), 850 m (Shirley et al. 2000; Chini et al. 2001), and 450 m (Chini et al. 2001).
In a first attempt to understand the morphology of this young object, Gueth et al. (1997) carried out 13CO (=10), C18O (=10), and 2.7 mm continuum IRAM Plateau de Bure interferometric observations of the region around L1157-mm, with a 25 angular resolution. The continuum emission clearly shows two components: a marginally resolved compact, flattened core, perpendicular to the outflow direction, and a low-level extended emission that seems to delineate the heated edges of the cavity excavated by the CO outflow. The 13CO emission also originates from the limb-brightened edges of the outflow, whereas the C18O emission is more directly associated with the compact continuum source, and shows marginal evidence of rotation. In addition, redshifted self-absorption is present in the 13CO spectrum, which suggests infall motions. However, in order to confirm the picture described by Gueth et al. (1997), higher angular resolution and higher frequency continuum observations, together with different, higher density, tracers were necessary. In this work we present these new interferometric observations of the dust continuum at 2.7 and 1.3 mm, and of the HC3N (=1211) and C18O (=21) emission around L1157-mm. These new maps reveal important details of the structure of the central source, and of the interaction between the outflow and the high-density core.
2 Observations
2.1 Interferometric data
Observations were carried out with the IRAM Plateau de Bure Interferometer (Guilloteau et al. 1992) between November 1995 and April 1996. Five different configurations of the four-antennas array were used. The longest baseline was 288 m (B2) and the shortest 24 m (B2, D). The phase center was set to the position J, J, which is the L1157-mm position reported by Gueth et al. (1997). The source was observed simultaneously at 109.2 GHz (HC3N =1211) in USB and 219.6 GHz (C18O =21) in LSB band. The spectra were analyzed using a correlator with one band of 10 MHz centered on the HC3N (=1211) line, one band of 20 MHz centered on the C18O (=21) line, and two bands of 160 MHz for the 2.7 and 1.3 mm continuum. The spectral resolution was 0.11 km s-1 in both narrow bands. The bandpass of the receivers was calibrated by observations of the strong quasars 3C273, 3C454.3, 0923+392, or 1823+568. Amplitude and phase calibrations were achieved by monitoring 1823+568, whose flux density was determined relative to 3C273 and 3C454.3.
However, the emission of 1823+568 turned out to be linearly polarized, and therefore presented a sinusoidal dependence of the amplitude with time i.e. with parallactic angle. Special considerations had thus to be taken during the calibration process. Since the polarization of the two receivers (2.7 and 1.3 mm) is orthogonal, the amplitude curve A() of a linearly polarized source has an opposite behavior on both receivers. This effect is only noticeable in tracks of several hours. To fix this polarization problem, we first ran a procedure to fit the calibrator amplitude curve with a sinusoidal function of the parallactic angle , for each scan. The functions were proportional to 1+C1, for the 2.7 mm receiver, and to 1+C2 for the 1.3 mm receiver, where C1 and C2 give an estimate of the percentage of polarized flux, and gives an idea of the polarization angle. Then, we calibrated the amplitude curve against one of the well-known calibrators also used in the observations (e.g. 3C273), in order to obtain the real value of the flux for each scan. Thus, instead of a constant value for the flux of the amplitude calibrator, we obtained a function of the parallactic angle , and this function is the one we used in the calibration process.
We estimate that the uncertainties on the absolute flux density calibration are 20% at 2.7 mm, and 40% at 1.3 mm, due to the difficulties encountered to calibrate the amplitude. Typical rms phase noise was better than at 2.7 mm, and better than at 1.3 mm. The data were calibrated and analyzed with the GILDAS software package developed at IRAM and Observatoire de Grenoble. The synthesized CLEANed beam for maps made using natural weighting was at P.A. at 2.7 mm, and at P.A. at 1.3 mm. Unless explicitly mentioned, we subtracted the continuum from the line emission. This was performed directly in the plane in order to avoid non linearity effects in the deconvolution, and thus any amplification of errors induced in this process.
2.2 Bolometer data
Gueth et al. (2003) presented 1.3 mm bolometer measurements obtained with the MPIfR 19-channel bolometer array (MAMBO) on the IRAM 30-m telescope. We used this map to extract short-spacings information and thus complement the interferometric data set. The interferometer and 30-m data at 1.3 mm were merged in the plane using the procedure available in the GILDAS package. The relative weights of the interferometer and single-dish data were adjusted so that the weight density of the single-dish data matches that of the shortest interferometric baselines. A multiplicative scaling factor of 0.8 was applied to the single-dish data amplitudes, in order to compensate for the fact that the single-dish observations were carried out at a central wavelength of 1.25 mm, whereas the interferometric observations were indeed done at 1.4 mm. Hereafter, we will refer to the combined interferometer plus single-dish 1.3 mm continuum data simply as 1.3 mm continuum data. The synthesized (natural weight) CLEANed beam for the resulting map, at , is very similar to the beam without the bolometer data.
3 Continuum emission
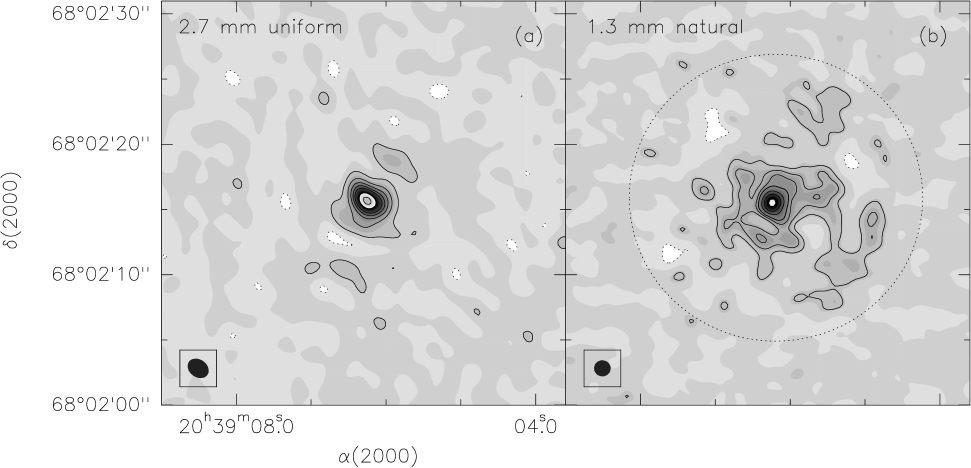
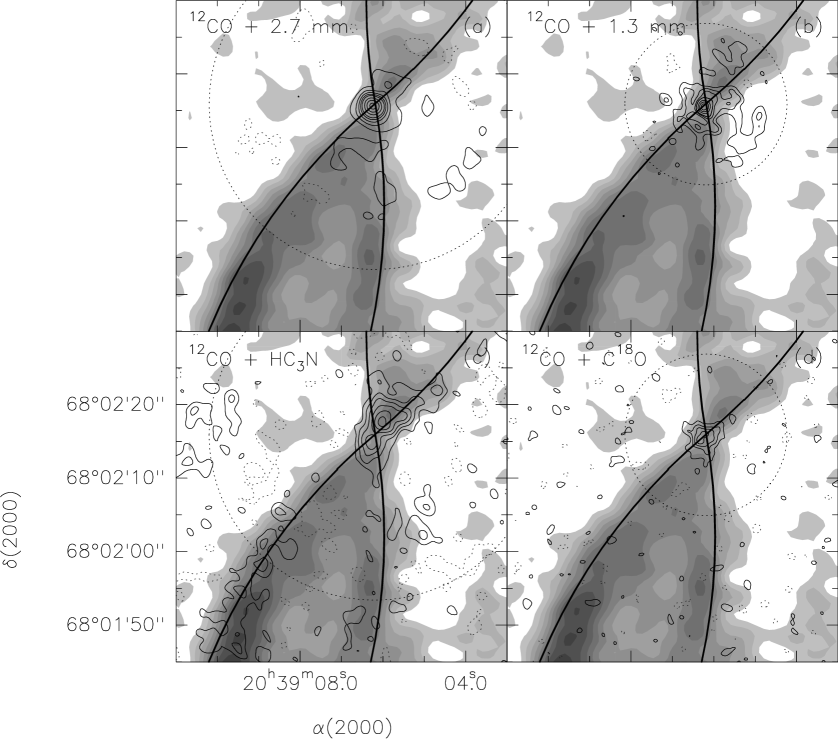
The millimeter continuum emission towards the core of L1157 was mapped at 2.7 and 1.3 mm. Figure 1 shows the uniform-weight map of the 2.7 mm emission, and the natural-weight map of the 1.3 mm emission. Figure 2 shows the superposition of the integrated 12CO (=10) emission (adapted from Gueth et al. 1996), which is tracing the molecular outflow, with the 2.7 mm and 1.3 mm natural-weight maps (as well as with the HC3N and C18O integrated emission). The continuum dust emission is resolved at both wavelengths and clearly shows two components, a compact source plus an extended envelope. In Table 1, we summarize the observed properties of these two components. The position found for the compact source L1157-mm at both wavelengths is J, J. Position accuracy is about . This is in agreement with the position found by Gueth et al. (1996) through previous 115 GHz observations. The position obtained by Gueth et al. (1997) is slightly different, but this was traced back to to an incorrect value for the coordinates of the phase calibrator 2013+370.
| Integrated fluxes | Source sizec | Spectral indexes | Masses | ||||||
| Component | 2.7 mma | 2.7 mmb | 1.3 mmb | ||||||
| (mJy) | (mJy) | (mJy) | () | (AU) | P.A. | () | |||
| COMPACT | 35 | 450250 | 12 | 2.1 | 0.1 | 0.12 | |||
| EXTENDED | 60 | 31 | 680 | 87 | 35003100 | 155 | 4–5 | 2–3 | 1.08 |
| TOTALg | 95 | 56 | 760 | 1.2 | |||||
Peak coordinates of the compact core: (J2000) =
20h39m06.24s (J2000)
= 6802′15.6′′. Position accuracy is .
(a) Integrated flux density measured by Gueth et al. (1997).
(b) Integrated flux density measured in this paper, corrected for
primary beam response.
(c) Measured at 1.3 mm.
(d) Integrated flux density measured by fitting an elliptical
Gaussian directly to the
visibility data for baselines m.
(e) Integrated flux density measured by fitting an elliptical
Gaussian directly to the
visibility data for baselines m.
(f) Size obtained by fitting an elliptical Gaussian directly to the
visibility data. The
uncertainty in the size values is 004.
(g) Compact + extended components.
3.1 2.7 mm continuum
The 2.7 mm uniform-weight map (Fig. 1) marginally resolves the compact component: the central source is slightly elongated perpendicular to the outflow direction, but this elongation is however dominated by the beam. The deconvolved size we found after fitting an elliptical Gaussian to the uniform-weight map is 1 at P.A. , which is different from the position angle of the uniform-weight synthesized beam (P.A. ). Fitting an elliptical Gaussian directly to the visibility data, for baselines longer than 80 m, we found a total flux of 25 mJy and a size of at P.A. . This size, which corresponds to a linear size of 500400 AU at the distance of the source, is consistent with the previous determination from Gueth et al. (1997). However, the flux density value that we have found is slightly lower than the value of 35 mJy measured by these authors.
Extended emission at a low 1 to 3 mJy beam-1 level is also visible along the outflow axis at P.A. of 155. This emission has a flux density of 31 mJy integrated over an area of 200 arcsec2. It is less extended and weaker than the emission detected by Gueth et al. (1997) with a similar synthesized beam. Adding the compact component, the total continuum flux at 2.7 mm is 56 mJy. This is lower than the flux of 90 mJy measured by Gueth et al. (1997). These discrepancies reflect the difficulty of absolute flux calibration in the mm domain, as well as that of low-level extended structures deconvolution – which may crucially depend on the actual coverage.
3.2 1.3 mm continuum
At 1.3 mm, the compact component has a peak intensity of 60 mJy beam-1, and is marginally resolved, with a size of 1. By fitting an elliptical Gaussian to the visibility data for baselines longer than 40 m (which is consistent with using 80 m at 2.7 mm in order to select the same physical scales), we obtained a total flux of 78 mJy, and a size of (450250 AU) at P.A. . Note that both the size and orientation of the compact source are slightly different at 2.7 and 1.3 mm, which is probably related to the source not having a perfect Gaussian shape structure. In particular, at 1.3 mm the compact component is slightly elongated along the outflow cavity.
Figures 1 and 2 show that the centrally peaked compact source is surrounded by a structure extended roughly along the flow axis. The flux density is 5 to 15 mJy beam-1 in this component, well above the rms noise, mJy beam-1 (estimated over an empty area of the map). We measured a total flux density of 760 mJy (corrected for primary beam attenuation). This is consistent with the flux of 630 mJy measured at 1.1 mm by Motte & André (2001) with MAMBO on the IRAM 30-m telescope. The circumstellar dust emission around L1157-mm is clearly dominated by the extended component. This envelope does not have spherical symmetry, but it is spread over a region of 8′′ (3500 AU) along the outflow direction.
The 1.3 mm map also shows an emission extended in the direction perpendicular to the outflow, on a 20′′ scale. This structure is obviously much too large to be a circumstellar disk. It might be due to a flattened envelope remnant of the molecular cloud in which the protostar was formed. This extended material has also been detected, but at a much larger spatial scale, through 850 m and 1.3 mm single-dish observations (Shirley et al. 2000; Chini et al. 2001; Gueth et al. 2003).
4 Molecular line emission
4.1 HC3N maps
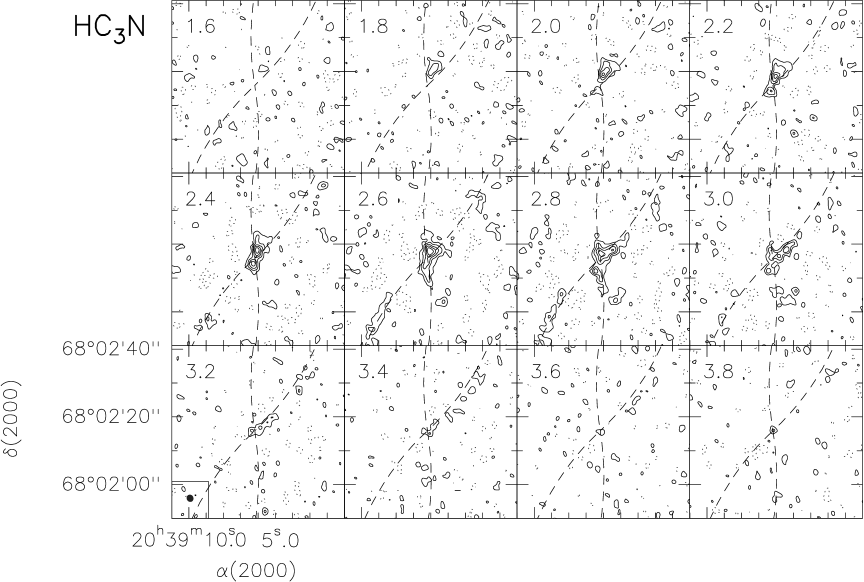
The HC3N (=1211) transition has a high critical density ( cm-3, Chung, Osamu, & Masaki 1991), which makes it an even better tracer of high density regions than e.g. CS (=10) and CS (=21). Figure 3 shows the velocity channel maps for the HC3N (=1211) emission toward the core of L1157, around the systemic velocity channel ( km s-1). The gas emission around L1157-mm is not compact, but extended and elongated along the outflow edges. The outflow is blueshifted toward the south and redshifted toward the north and is almost in the plane of the sky (Gueth et al. 1996). As a consequence, there is blueshifted and redshifted HC3N emission in both lobes. The integrated HC3N emission (Fig. 2) has a flux density 670 mJy km s-1.
At a distance of 30′′ from the central source, the southern lobe reveals an elongated filament at velocity 2.6 and 2.8 km s-1 (Fig. 3). It is outlining very clearly the eastern flank of the outflow CO lobe. This emission is already significantly affected by the primary beam attenuation. Interestingly, this feature coincides with a SiO shock (S3 shock from Gueth et al. 1998; Zhang et al. 2000), traced also by H2 (Davis & Eislöffel 1995), NH3 (Tafalla & Bachiller 1995), H2CO, CS, CH3OH, and SO (Bachiller et al. 2001). Gueth et al. (1996, 1998) and Zhang et al. (2000) describe a precessing episodic jet scenario that can explain the different orientations and velocities of the cavities of the outflow. According to this scenario, the jet has precessed toward the SE–NW direction, and the region discussed here would thus correspond to an event of enhanced ejection, which is impacting the flank of the existing CO cavity. The resulting shock explains the increased abundances of some species at that location, including HC3N (Bachiller & Pérez-Gutiérrez 1997). The velocity of the HC3N gas is significantly lower than that of the CO emission at the same location (e.g. Gueth et al. 1996). This suggests that high velocity material has a lower density, and would thus not be seen in HC3N, although we cannot rule out an opacity effect. No HC3N emission has been detected inside the cavity, but an extended emission could possibly have been filtered out by the interferometer.
4.2 C18O maps
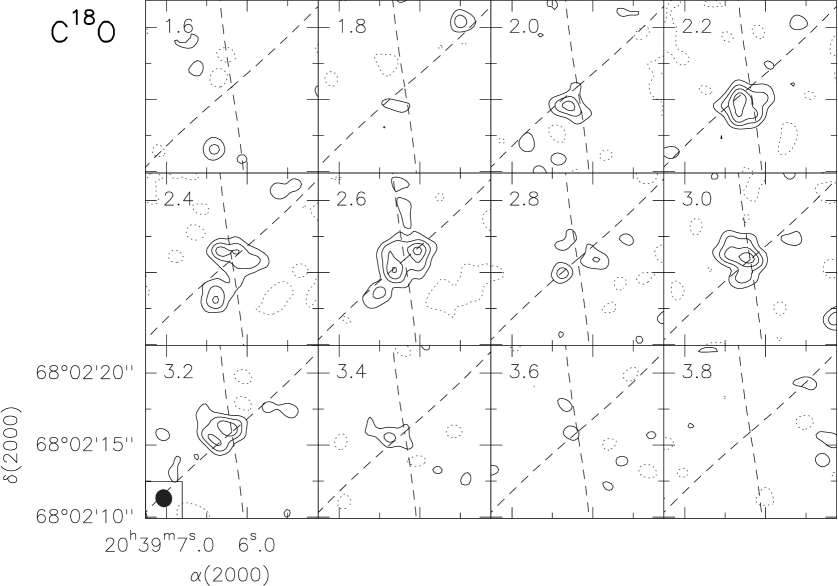
Figure 4 presents the velocity channel maps for the C18O (=21) emission. The integrated emission (Fig. 2) appears more compact than the HC3N emission: it is dominated by the central compact component, and is thus associated to the innermost part of the protostellar envelope. The total integrated intensity is 3 Jy km s-1. The C18O emission is also tracing gas associated to the outflow, as can be seen at the systemic velocity channel map ( km s-1, see Fig. 4). A striking feature visible in Fig. 4 is that the C18O emission at 2.8 km s-1 is weaker than in the previous and following velocity channels. This effect is clearly seen as a narrow deep self-absorption in the spectrum taken at the position of L1157-mm (see below, section 6.2.1 and Fig. 6).
5 Analysis
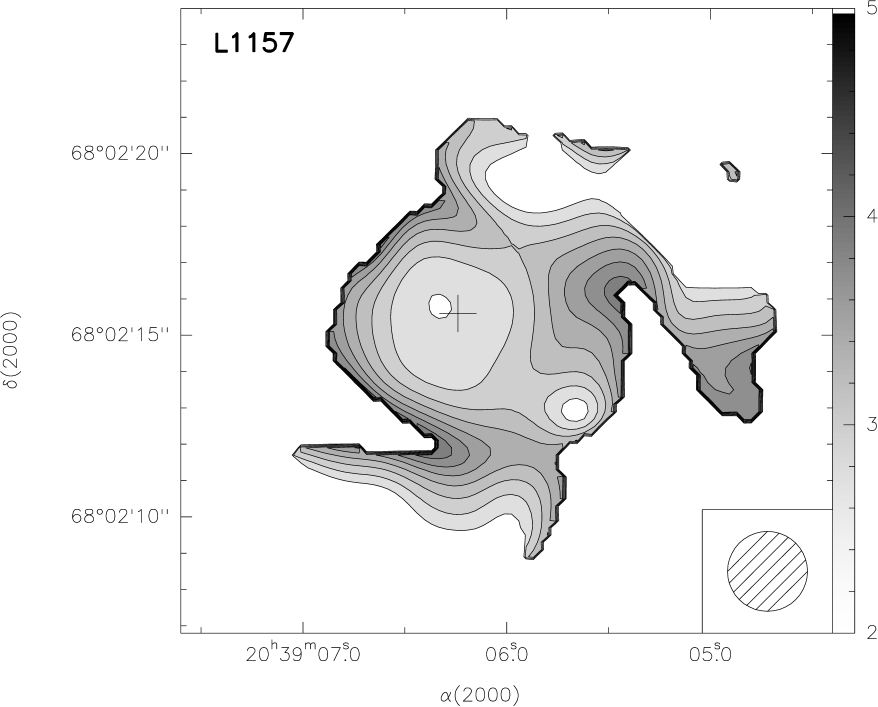
5.1 Spectral index map
Figure 5 presents a map of the spectral index , where , computed using the 2.7 and 1.3 mm continuum interferometric images restored with the same resolution, (or 900 AU). The spectral index varies from a value 2.1, at the position of the compact source to a value of 4–5 at larger distance111Gueth et al. (2003) have analyzed the spectral index around L1157-mm from bolometric observations at 1.2 and 0.85 mm. They obtained an intermediate value of in the central 20′′ beam which includes all our interferometric map.. Instrumental effects such as missing flux and/or a wrong flux scale would affect the absolute level of the spectral index map, but can hardly introduce a spatial variation. Line contamination can be excluded, since it does not affect the interferometer data and was found to be absent in the bolometer measurement (Gueth et al. 2003). The observed variation accross the L 1157-mm region may thus be indicative of physical differences between the properties of the material toward the embedded source and those of the more extended region. This effect was already observed in other young embedded sources (Visser et al. 1998; Johnstone & Bally 1999; Smith et al. 2000; Beltrán et al. 2002).
A low value of , as observed at the central position, can be due to optically thick dust emission. In such a case, the dust temperature is equal to the brightness temperature (in the Rayleigh-Jeans approximation), which can be derived from the observed flux density:
| (1) |
where is the solid angle subtended by the source. An upper limit on can be computed when assuming that the whole flux of the compact core (78 mJy, see Table 1) is coming from the optically thick contribution. Assuming that the size of the optically thick emitting region is around 150 AU, we derive a value of K for the dust temperature (note that the larger the optically thick core, the lower ). This value is very low and suggests that a significant fraction of the compact core has an optically thin emission.
Assuming that the dust emission at mm wavelengths is optically thin and in the Rayleigh-Jeans regime, is related to the power-law index of the dust emissivity , through . For the more extended material, would thus be larger than , the typical value for interstellar dust grains (see e.g. Draine & Lee 1984), while the value of for the compact source would be 0.1. Interestingly, this decrease of could be due to larger grains (e.g. Mannings & Emerson 1994), hence suggesting grain growth in the denser inner regions. Grain shape evolution or chemical evolution are also possible (see, e.g. Ossenkopf & Henning 1994; Pollack et al. 1994).
5.2 Envelope mass – from continuum emission
Assuming optically thin dust thermal emission, the mass of the emitting material can be derived from the 1.3 mm continuum flux density by:
| (2) |
Using a dust temperature of 40 K (following Gueth et al. 1997), and a dust mass opacity of 0.01 cm2 g-1, as recommended by Henning, Michel, & Stognienko (1995) for a gas-to-dust ratio of 100, we obtain a mass of the central compact source of 0.12 , while the mass of the envelope is 1.08 . Thus, the total (compact + extended) circumstellar mass is 1.2 . This is a factor 3 below the value of 3 derived by Gueth et al. (1997) at 2.7 mm. The absolute flux density of the 1.3 mm data may be significantly underestimated. These calculations are also dependent on the dust opacity law used, the mass being lower in case of higher dust opacity. In any case, the large ratio between the mass of the extended component and that of the compact one indicates that there is an important reservoir of material that can be incorporated into the central protostar. This is in agreement with the conceptual definition of a Class 0 object.
5.3 Envelope mass – from gas emission
The gas mass of the protostellar condensation can be better estimated from the C18O data, since the HC3N emission is partly associated to the outflow. Following the derivation of Scoville et al. (1986), and assuming optically thin emission, the C18O beam averaged column density is given by
| (3) |
where is the excitation temperature, and is the integrated brightness temperature of the C18O (=21) emission. Assuming K, a C18O abundance relative to molecular hydrogen of , and a mean molecular weight of , we obtain a mass of 9 in the inner 2 area (roughly corresponding to the central source). It should be mentioned that the excitation temperature value adopted does not affect significantly the estimated molecular mass; the mass is 7 for K, and 11 for K. Our derived value is certainly a lower limit since the C18O is affected by self-absorption (see 6.2.1), and hence partly optically thick. Indeed, Gueth et al. (1997) derived a mass of from C18O (=10). Comparing the molecular mass, a few , to that derived from the continuum data, , it suggests that CO in L1157-mm could be depleted by a factor around 3–10, although this result has to be taken with caution in case the gas is optically thick and/or clumpy. Using the same assumptions as above, the mass of the whole C18O envelope (8 area) is 4, again significantly below the mass derived from the continuum emission (1.08 ). However, the C18O emission is less extended that the continuum emission, and the comparison between the two masses may therefore not be relevant. It is also possible that we miss some C18O (=21) emission because of the lack of short spacings in our measurement.
6 Discussion

6.1 Interaction between the outflow and the envelope
Both our continuum and lines observations reveal structures or filaments that seem to be associated with the edges of the L 1157 outflow.
The 1.3 mm continuum map (Fig. 2) reveals a low-level extended emission whose conical shape matches that of the outflow lobes. Gueth et al. (1997) reported a similar feature from 2.7 mm observations: the dust emission was observed and modelled as a “cross-like” structure coincident with the outflow edges. Note however that these observations indicated opening angles slightly smaller than those shown by our maps. The morphological association between the outflow edges and dense protostellar material in L 1157 is even better shown by the the HC3N observations. The channel maps presented in Fig. 3 (see the 2.6 to 3.2 km s-1 channels) reveal extensions that outline quite accurately the beginning of the outflow conical lobes. The southeastern arm of this “cross-like” pattern is missing, as in the 2.7 mm continuum from Gueth et al. (1997), which suggests different temperature and/or density than in the other arms. The C18O emission, while much more compact than the HC3N emission, exhibits marginal indications of a similar morphology.
Following Gueth et al. (1997), we suggest that these morphological coincidences indicate that a strong interaction between the outflow and the protostellar envelope is taking place in L 1157: the outflow sweeps up envelope material, thereby creating heated/compressed regions at its edges, which, observationaly, mimic a “cross-like” structure (see Gueth et al. 1997, their Fig. 10). Circumstellar dust and gas material around young stellar objects outlining the edges of the molecular outflow have also been mapped in other sources (e.g. B5-IRS1: Langer, Velusamy, & Xie 1996; L1527: Ohashi et al. 1997, Hogerheijde et al. 1998, Motte & André 2001; L1551-IRS5: Fuller et al. 1995, Ladd et al. 1995).
Interestingly, the HC3N emission also revels two peaks located on both sides of the central protostar. They are clearly visible in the integrated emission map (Fig. 2) as well as in the individual channel maps (Fig. 3). Their positions coincide with the apparent base of the outflow conical cavities as traced by the 12CO (see Fig. 2), suggesting that these emission peaks could be produced when the dense gas is shock-heated and compressed by the flow. Hence, we conclude that, at the resolution of our observations, the structure of the dust+gas protostellar envelope is strongly affected by the presence of the outflow.
6.2 Kinematics of the Gas
6.2.1 C18O Self-absorption
Figure 6 presents the HC3N (=1211) and C18O (=21) spectra obtained at the position of L1157-mm. As already mentioned, the C18O emission shows a narrow ( km s-1) deep absorption feature in the spectra, at a velocity of 2.8 km s-1. A similar feature of 0.3 km s-1 was also reported at the same velocity in the interferometric 13CO (=10) map and spectra by Gueth et al. (1997). This suggests that the C18O (=21) line is self-absorbed. However, missing short-spacings information could cause a fake absorption, but spatially extended (see Gueth et al. 1997, their Fig.7). In Fig. 7 we plot the C18O (=21) spectra around L1157-mm, by offsets of , roughly the size of our synthesized beam. This figure shows that the absorption feature is only detected at a few positions, close to the compact source and not at larger distance of L1157-mm. Hence, the self-absorption, confined in a small region ( or 2000 AU) around L1157-mm, appears real. Note that Fig. 7 also shows line broadening localized toward the center.
A redshifted self-absorption is naturally explained in a scenario where an optically thick line is observed in an infalling core with temperature decreasing outward (e.g. Leung & Brown 1977). Fig. 6 shows that the brightness temperature (in scale) of the self-absorbed feature is 2.2 K. Assuming optically thick emission, it corresponds to an excitation temperature of K, in excellent agreement with the excitation temperature found by Gueth et al. (1997) from the 13CO spectra. This low indicates that the self-absorption features are most probably sub-thermally excited, and should thus be produced in a medium whose density is low enough to prevent thermalization of the lines. No self-absorption was detected in the C18O (=10) interferometric maps obtained by Gueth et al. (1997). This suggests that the (=10) line is optically thin while the (=21) is significantly thicker. For K, the ratio of optical depths between the two transitions is (=21) (=10). Note also that the C18O (=10) spectra from Gueth et al. (1997) has a narrow profile, making it difficult to detect a possible asymetry.

6.2.2 Other absorption features?
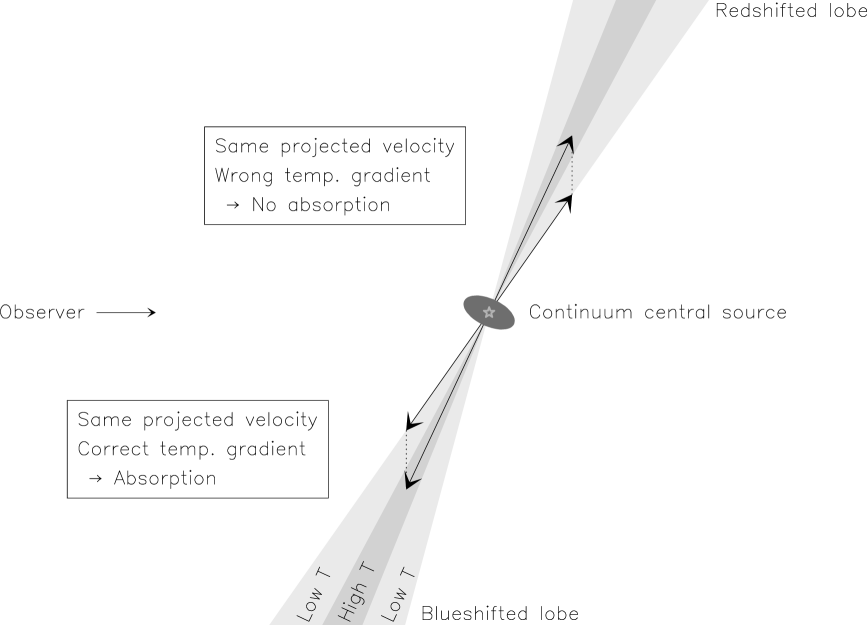
In addition to the self-absorption feature discussed in the previous paragraph, Fig. 6 reveals that both the HC3N and C18O spectra at the position of L 1157-mm have weaker emission in the 1–2 km s-1 (blueshifted) and the 4–5 km s-1 (redhifted) velocity intervals. This suggests that the actual line profile may be triangular-shaped, with two strong absorption features. In both lines, each of the “absorbed” channels is at a few below the un-affected emission, but the whole absorption feature is significant because it extends over 3 to 6 adjacent channels. The redshifted feature in the C18O even shows an aborption of the continuum emission.
To explain such absorptions in the spectra, one has to invoke the presence of cold absorbing gas in front of a warm emitting region. Concerning the blueshifted feature, it could arise from self-absorption in the blueshifted southern outflow lobe (see Fig. 8): cold gas at the cavity edge is located in front of warmer material present along the flow axis; the latter gas is expected to have larger velocities, but since it is closer to the plane of the sky, projection effects may produce the same line-of-sight velocity for both components. As for the redshifted absorption feature, a similar mechanism in the redshifted, northern lobe cannot be proposed because the cold material would be located behind the warm gas (Fig. 8). Moreover, any phenomenum in the redshifted outflow lobe could not explain the absorption of the continuum, since this lobe is behind the central source (which is at the origin of the compact continuum emission). Instead, one could invoke absorption by the infalling envelope, whose redshifted part is in front of the continuum source.
This latter scenario can drive interesting constrains on the size of the continuum emitting region. The velocity at which the redshifted continuum absorption is observed is higher than the self-absorption feature: this means than the absorbing gas is located closer to the center, and thus should be hotter. The excitation temperature should thus be higher than 6.3 K. On another hand, the excitation temperature must be significantly smaller than the continuum brightness temperature (1 K), in order to create an absorption. These constrains can be reconciled if we assume that the continuum emission is dominated by a strongly peaked central component, which is affected by beam dillution effects. Let’s assume that the C18O absorbing material has an excitation temperature of 10 K. Judging from the absorption feature (Fig. 6), the continuum true brightness temperature must be typically 5 times larger, i.e. 50 K. This can be explained by a beam dilution of 50 in area, hence 7 in size. This in turn would imply a continuum source size of 75 AU (beamsize/7). Interestingly, this value is of the order of the expected typical size of a circumstellar disk in a Class 0 object (e.g. Pudritz et al. 1996).
Clearly, these absorption features have to be confirmed and would deserve further, more detailed, observations in order to derive a clear understanding of the complex kinematics of the L1157 protostellar envelope.
6.2.3 Rotation ?
It should be mentioned that we did not find any evidence of velocity gradient for the C18O (=21) transition (see Fig. 4), indicative of rotation, as suggested by Gueth et al. (1997) for the C18O (=10) line.
7 Summary
We have studied with the IRAM Plateau de Bure millimeter interferometer the dust and gas emission toward the core of the Class 0 object L1157-mm. Our main conclusions are:
-
•
The continuum emission at 2.7 and 1.3 mm show a compact component which is resolved at 1.3 mm into a flattened compact core of 450 AU, and mass 0.12 and is surrounded by an extended envelope of 3000 AU, and mass 1.1 .
-
•
The millimeter spectral index varies across the region. A lower value is found toward the position of the compact protostar, while the spectral index is for the extended surrounding material. These values imply a dust emissivity index and , respectively. This variation could possibly indicate grain growth toward the compact component.
-
•
A strong interaction between the molecular outflow and the close protostellar environment is taking place and affects the structure of the innermost parts of the envelope. This is shown by the spatial correlation between the molecular outflow and the dust continuum (1.3 mm map) and the HC3N emission: both maps show structures associated to the edges of the outflow lobes, as traced by the 12CO emission.
-
•
HC3N emission is also detected at a distance of 13000 AU from the central object, at the position of a shock associated to the impact of the precessing jet against the walls of the main cavity of the southern lobe.
-
•
Evidence of infall has been detected through the C18O (=21) observations, in agreement with the indications of infall detected through 13CO by Gueth et al. (1997).
-
•
We did not detect any velocity gradient indicative of a rotating circumstellar disk.
Finally, when observing Class 0 environment such as that of L 1157-mm, multiple velocity components and temperature gradients along the line of sight do confuse the interpretation of spectral line emission. In particular, they make it difficult to disentangle the various components (disk, envelope, outflow) and determine their velocity distributions. Our results show that even the highest density gas tracers such as HC3N are affected by the ejection phenemena, tracing also ambient material compressed by the outflow. When deriving results from low angular resolution observations of Class 0 objects one should be aware of these problems. High angular resolution observations of different dust and gas tracers are absolutely necessary to get a detailed and accurate picture of such young objects environment.
Acknowledgements.
We would like to thank Paul Ho for his valuable comments on this work. We acknowledge the IRAM staff from the Plateau de Bure for carrying the observations. M. T. B. acknowledges support from a SAO predoctoral fellowship.References
- Adams, Lada, & Shu (1987) Adams, F. C., Lada, C. J., & Shu, F. H. 1987, ApJ, 312, 788
- André, Ward-Thompson, & Barsony (1993) André, P., Ward-Thompson, D., & Barsony, M. 1993, ApJ, 406, 122
- Avery & Chiao (1996) Avery, L. W., & Chiao, M. 1996, ApJ, 463, 642
- Bachiller et al. (1995) Bachiller, R., Liechti, S., Walmsley, C. M., & Colomer, F. 1995, A&A, 295, L51
- Bachiller, Martín-Pintado, & Fuente (1993) Bachiller, R., Martín-Pintado, J., & Fuente, A. 1993, ApJ, 417, L45
- Bachiller & Pérez Gutiérrez (1997) Bachiller, R., & Pérez Gutiérrez, M. 1997, ApJ, 487, L93
- Bachiller et al. (2001) Bachiller, R., Pérez Gutiérrez, M., Kumar, M. S. N., & Tafalla, M. 2001, A&A, 372, 899
- Beltrán et al. (2002) Beltrán, M. T., Estalella, R., Ho, P. T. P., Calvet, N., Anglada, G., Sepúlveda, I. 2002, ApJ, 565, 1069
- Cassen & Moosman (1981) Cassen, P., & Moosman, A. 1981, Icarus, 48, 353
- Chini et al. (2001) Chini, R., Ward-Thompson, D., Kirk, J. M., Nielbock, M., Reipurth, B., & Sievers, A. 2001, A&A, 369, 155
- Chung, Osamu, & Masaki (1991) Chung, H. S., Osamu, K., & Masaki, M. 1991, JKAS, 24, 217
- Davis & Eislöffel (1995) Davis, C. J., & Eislöffel, J. 1995, A&A, 330, 851
- Draine, & Lee (1984) Draine, B. T., & Lee, H. M. 1984, ApJ, 285, 89
- Fuller et al. (1995) Fuller, G. A., Ladd, E. F., Padman, R., Myers, P. C., Adams, F. C. 1995, ApJ, 454, 862
- Gueth, Guilloteau, & Bachiller (1996) Gueth, F., Guilloteau, S., & Bachiller, R. 1996, A&A, 307, 891
- Gueth, Guilloteau, & Bachiller (1998) Gueth, F., Guilloteau, S., & Bachiller, R. 1998, A&A, 333, 287
- Gueth et al. (1997) Gueth, F., Guilloteau, S., Dutrey, A., & Bachiller, R. 1997, A&A, 323, 943
- Gueth et al. (2003) Gueth, F., Bachiller, R., & Tafalla, M. 2003, A&A, 401, L5
- Guilloteau et al. (1992) Guilloteau, S., Delannoy, J., Downes, D., et al. 1992, A&A, 262, 624
- Henning, Michel, & Stognienko (1995) Henning, Th., Michel, B., & Stognienko, R. 1995, P&SS, 43, 1333
- Heyvaerts, J., & Norman, C. (1989) Heyvaerts, J., & Norman, C. 1989, ApJ, 347, 1055
- Hirano, & Taniguchi (2001) Hirano, N., & Taniguchi, Y. 2001, ApJ, 550, L219
- Hodapp (1994) Hodapp, K.-W. 1994, ApJSS, 94, 615
- Hogerheijde (2001) Hogerheijde, M. R. 2001, ApJ, 553, 618
- Hogerheijde et al. (1998) Hogerheijde, M. R., van Dishoeck, E. F., Blake, G. A., & van Langevelde, H. J. 1998, ApJ, 502, 315
- Johnstone, & Bally (1999) Johnstone, D., & Bally, J. 1999, ApJ, 510, L49
- Königl & Pudritz (2000) Königl, A., & Pudritz R. E. 2000, in Protostars and Planets IV, eds. V. Mannings, A, P. Boss, & S. S. Russell, (Tucson: University of Arizona Press), 759
- Ladd et al. (1995) Ladd, E. F., Fuller, G. A., Padman, R., Myers, P. C., & Adams, F. C. 1995, ApJ, 439, 771
- Lai & Crutcher (2000) Lai, S.-P., & Crutcher, R. M. 2000, ApJSS, 128, 271
- Langer, Velusamy, & Xie (1996) Langer, W. D., Velusamy, T., & Xie, T. 1996, ApJ, 468, L41
- Larson (1969) Larson, R. B. 1969, MNRAS, 145, 271
- Leung & Brown (1977) Leung, C., & Brown, R. 1977, ApJ, 214, L73
- Mannings & Emerson (1994) Mannings, V., & Emerson, J. P. 1994, MNRAS, 267, 361
- Motte & André (2001) Motte, F., & André, P. 2001, A&A, 365, 440
- Ohashi et el. (1997) Ohashi, N., Hayashi, M., Ho, P. T. P., & Momose, M. 1997, ApJ, 475, 211
- Ohashi et al. (1999) Ohashi, N., Lee, S. W., Wilner, D. J., & Hayashi, M. 1999, ApJ, 518, L41
- Ossenkopf & Henning (1994) Ossenkopf, V., & Henning, T. 1994, A&A, 291, 943
- Pollack et al. (1994) Pollack, J. B., Hollenback, D., Beckwith, S. W. V., Simonelli, D. P., Roush, T., & Fong, W. 1994, ApJ, 421, 615
- Pudritz & Norman (1983) Pudritz, R. E., & Norman, C. A. 1983, ApJ, 274, 677
- Pudritz et al. (1996) Pudritz, R. E., Wilson, C. D., Carlstrom J. E, et al., 1996, ApJ, 470, L123
- Saito et al. (1996) Saito, M., Kawabe, R., Kitamura, Y., & Sunada, K. 1996, ApJ, 473, 464
- Scoville et al. (1986) Scoville, N. Z., Sargent, A. I., Sanders, D. B., Claussen, M. J., Masson, C. R., Lo, K. Y., & Phillips, T. G. 1986, ApJ, 303, 416
- Shirley et al. (2000) Shirley, Y. L., Evans, N. J., Rawlings, J. M. C., & Gregersen, E. M. 2000, ApJSS, 131, 249
- Shu, Adams, & Lizano (1987) Shu, F. H., Adams, F. C. & Lizano, S. 1987, ARAA, 25, 23
- Shu et al. (1994) Shu, F., Najita, J., Ostriker, E., Wilkin, F., Ruden, S., & Lizano, S. 1994, ApJ, 429, 781
- Smith et al. (2000) Smith, K. W., Bonnell, I. A., Emerson, J. P., & Jenness, T. 2000, MNRAS, 319, 991
- Tafalla & Bachiller (1995) Tafalla, M., & Bachiller, R. 1995, ApJ, 443, L37
- Terebey, Shu, & Cassen (1984) Terebey, S., Shu, F. H., & Cassen, P. 1984, ApJ, 286, 529
- Umemoto et al. (1992) Umemoto, T., Iwata, T., Fukui, Y., Mikami, H., Yamamoto, S., Kameya, O., & Hirano, N. 1992, ApJ, 392, L83
- Visser et al. (1998) Visser, A. E., Richer, J. S., Chandler, C. J., & Padman, R. 1998, MNRAS, 301, 585
- Zhang, Ho, & Wright (2000) Zhang, Q., Ho, P. T. P., & Wright, M. C. H. 2000, AJ, 119, 1345
- Zhang et al. (1995) Zhang, Q., Ho, P. T. P., Wright, M. C. H., & Wilner, D. J. 1995, ApJ, 451, L71