Starbursts in barred spiral galaxies
This paper is primarily a study of the effect of a bar on the neutral hydrogen (HI) content of starburst and Seyfert galaxies. We also make comparisons with a sample of “normal” galaxies and investigate how well starburst and Seyfert galaxies follow the fundamental scaling Tully-Fisher (TF) relation defined for normal galaxies. 111 Markarian (Mrk) IRAS galaxies were observed at the Nançay radiotelescope, and HI data were obtained for 80 galaxies, of which 64 are new detections. We determined the (20 and 50%) linewidths, the maximum velocity of rotation and total HI flux for each galaxy. These measurements are complemented by data from the literature to form a sample of Mrk IRAS (74% starburst, 23% Seyfert and 3% unknown) galaxies containing 105 unbarred and 113 barred ones. Barred galaxies have lower total and bias-corrected HI masses than unbarred galaxies, and this is true for both Mrk IRAS and normal galaxies. This robust result suggests that bars funnel the HI gas toward the center of the galaxy where it becomes molecular before forming new stars. The Mrk IRAS galaxies have higher bias-corrected HI masses than normal galaxies. They also show significant departures from the TF relation, both in the and bands. The most deviant points from the TF relation tend to have a strong far-infrared luminosity and a low oxygen abundance. These results suggest that a fraction of our Mrk IRAS galaxies are still in the process of formation, and that their neutral HI gas, partly of external origin, has not yet reached a stationary state.
Key Words.:
Galaxies: starburst – Galaxies: active – Galaxies: evolution – Galaxies: ISM – Galaxies: kinematics and dynamics – Radio lines: galaxies1 Introduction
The neutral hydrogen (HI) content of galaxies is a key parameter for the study of their evolution, because the HI gas is both the reservoir for future star formation and an excellent tracer of the large-scale galaxy dynamics.
It has often been suggested that the nuclear activity in galaxies is fuelled by accretion of gas toward the central regions, and that the mechanism for this radial infall is either a gravitational interaction or the presence of a bar (e.g., Noguchi 1988; Shlosman et al. 1989; Mihos & Hernquist 1994; Friedli & Benz 1993, 1995). The effect of a bar on nuclear activity has been the main motivation behind the present series of papers, and the first objective of this paper is to determine whether there is a difference in HI content between barred and unbarred galaxies.
The presence of nuclear activity should also be related to the overall gaseous content of the host galaxies, since the availability of interstellar matter is expected to affect the fueling rate of the nuclear regions. So far, only loose correlations have been found between the HI gas content and the level of star formation in various samples of galaxies (e.g., Jackson et al. 1987; Mirabel & Sanders 1988; Martin et al. 1991; Eskridge & Pogge 1991; Andreani, Casoli & Gérin 1995; Contini 1996). A much tighter correlation has been found between the star formation rate (SFR) per unit area and the HI surface density in galaxies, extending over several orders of magnitudes in SFR and gas density (Kennicutt 1998). Our second objective is to investigate whether starburst and Seyfert galaxies have an abnormal neutral hydrogen content with respect to normal ones.
Another important use of HI data is for exploring the Tully-Fisher relation (Tully & Fisher 1977; hereafter TF) for active galaxies. The TF relation is an empirical correlation which predicts that the absolute magnitude of a disk galaxy is proportional to its maximum rotational velocity . In spite of the frequent use of the TF relation as a distance indicator, the physical origin of this relationship is still relatively poorly understood, and it remains unclear whether all rotationally supported disk galaxies obey a single TF relation. As the fundamental scaling relation for spiral galaxies, the TF relation provides constraints on galaxy formation, because it is deeply connected to the processes by which disk galaxies form (e.g., Burstein & Sarazin 1983; Cole et al. 1994; Eisenstein & Loeb 1996; Steinmetz & Navarro 1999; Koda, Sofue & Wada 2000; Navarro & Steinmetz 2000; van den Bosch 2000; Mo & Mao 2000).
Until now, the primary goal of detailed TF studies has been to establish the tightest relation possible for use as a distance indicator. Thus, most local TF studies are limited to normal isolated galaxies, excluding galaxies with nuclear activity (starburst or AGN) and with signs of interactions and/or tidal distorsion (e.g., Rubin et al. 1985; Pierce & Tully 1992; Courteau 1997; Tully & Pierce 2000). The TF relation has not yet been extensively used to probe galaxy evolution. Coziol et al. (2000) have recently shown that a significant fraction of the Markarian (Mrk) starburst galaxies strongly deviate from the -band TF relation defined for normal galaxies, suggesting that the disks of these galaxies are not in a state of dynamical equilibrium.
The third goal of this paper is to investigate whether starburst and Seyfert galaxies deviate systematically from the TF relation using -band photometry, which is a better probe of galaxy masses than the band. Our study complements searches for TF deviations in low-mass galaxies (Courteau & Rix 1999; O’Neil, Bothun & Schombert 2000; Hunter, Hunsberger & Roye 2000; McGaugh et al. 2000), extreme late-type galaxies (Matthews, van Driel & Gallagher 1998), asymmetric galaxies (Zaritsky & Rix 1997) and galaxies in close pairs (Barton et al. 2001).
To address the goals outlined above, we have culled a sample of galaxies from the catalogue of Markarian galaxies, retaining only those galaxies which had been detected by IRAS (in other words, those with a measured far-infrared flux).
The outline of the paper is as follows. The samples of barred and unbarred Mrk FIR-bright galaxies are described in Sect. 2. The HI observations and data reduction are presented in Sect. 3 and the results in Sect. 4. A comparative analysis of the HI content in Mrk IRAS vs. normal, and of barred vs. unbarred galaxies is given in Sect. 5.1. The behavior of Mrk IRAS galaxies in the TF plane is investigated in Sect. 5.2. Our principal conclusions are summarized and interpreted in terms of evolutionary stage of starburst galaxies in Sect. 6. Throughout this paper, all calculations assume an and km s-1 Mpc-1 cosmology.


2 The two subsamples
The sample of Mrk IRAS galaxies was broken into two subsamples, barred and unbarred galaxies, according to the morphological type listed in LEDA111LEDA (http://leda.univ-lyon1.fr).
The subsample of 144 barred galaxies contains 80% of starbursts and 20% of Seyfert galaxies. It has been the subject of detailed multi-wavelength studies (Contini 1996; Contini et al. 1995, 1997a,b, 1998; Chapelon et al. 1999; Coziol et al. 1997, 1999) and is described in more details by Contini et al. (1998).
The subsample of unbarred galaxies contains 110 Mrk IRAS galaxies with nearly the same relative proportion of starburst and Seyfert galaxies as in the barred sample. It is smaller than the barred subsample, but inspection of high-resolution images of the latter subsample (Contini 1996) revealed that 15 galaxies were in fact of unbarred type, so that the two groups are in fact of comparable sizes.
3 Observations and data reduction
When a literature search for HI observations of our sample turned out a rather small number of galaxies, we decided to obtain HI observations of the Mrk IRAS galaxies that had not yet been observed.
The observations were obtained at the large decimetric radiotelescope of Nançay Observatory222http://www.obs-nancay.fr/html_an/a_tecrt.htm. The half power beam width of the telescope at 21cm is 3.6’(EW)x22’(NS) at zero declination. The spectrometer is a 1024-channel autocorrelator of 6.4 MHz bandwidth, with 512 channels in each polarization. The channel resolution is 2.64 km s-1 at 21cm. Three runs (a total of 281 hours) were allocated for the barred subsample in 1993-94, and six runs (214 hours) for the unbarred subsample in 1996-99. We observed a total of 111 galaxies, and detected 80 (+ one companion), of which 64 are new detections.
The data were reduced at Nançay Observatory with the DAC and SIR softwares, operating on a microVax. The horizontally and vertically polarized signals were reduced separately and added after baseline subtraction. The latter operation was generally done using a polynomial of order 3. All spectra were then boxcar smoothed to a final resolution of 7.92 km s-1.
There was no independent check of the absolute flux calibration; we relied on the results of Theureau et al. (1998, their Fig.4) and applied a correction of 1.12 to the fluxes obtained in the first series of runs, and of 1.32 for the second, to make up for successive changes in overall gain at zero declination and redshift. A chromatic correction was likewise applied using a series of calibrations provided by Gilles Theureau, where the temperature of the noise diode is seen to increase with decreasing frequency (increasing redshift); this correction is similar to that adopted by Thuan et al. (1999), but extends further in frequency. The gain of the antenna is 1.1 K/Jy at zero declination. A correction for loss of sensitivity with declination was done using graphs provided by the telescope staff.
The observations at a recession velocity of about 12500 km s-1 were considerably perturbed by radar signals, and some of the galaxy profiles around that velocity might not be reliable. In particular, we had to discard the spectra of Mrk 126, 413, 726, 1231. We also discarded the spectra of Mrk 572 and 904, because of obvious artefacts in the profiles or baselines. This leaves 106 galaxies, out of which 24 were not detected, and three (Mrk 333, 445, and UGCA 304) are not part of the sample. Mrk 445 was observed by mistake (instead of Mrk 446), Mrk 333 turned out to be undetected by IRAS, and UGCA 304 is a companion to Mrk 1337. UGCA 304 was probably not completely in the beam of the telescope, and the corresponding Nançay HI flux is thus underestimated. In summary, the total number of Mrk IRAS galaxies detected by us is 80.
In order to determine the total HI fluxes and linewidths we converted the line profiles into MIDAS tables and images and applied custom-made procedures to derive these astrophysical quantities. The total HI fluxes were corrected for beam-filling using the precepts of Theureau et al. (1998) and taking galaxy position angles and diameters in LEDA; they amount to a factor of 1.02 or less in most cases. The systemic velocity is given in the radio convention (namely c()/). At this stage, the linewidths are corrected for cosmological stretching, but not for instrumental resolution or internal velocity dispersion. These corrections (e.g. Fouqué et al. 1990) will be applied before computing the maximum velocity of rotation.
For undetected galaxies, we determined an upper limit to the flux by measuring the rms noise and estimating the linewidth from the absolute magnitude and inclination of the galaxy via the TF relation. The HI profiles are displayed in Figs. 1 to 3.
The uncertainties in the velocities and fluxes were estimated following the method outlined in Fouqué et al. (1990).
| (1) |
and
| (2) |
where is the channel resolution (identical to the channel spacing), is the steepness of the profile (i.e. ( – )/2), is the peak intensity in the profile (in Jy), is the measured area under the profile (in Jy km s-1) and the signal-to-noise ratio (defined as the ratio of to the rms noise). The uncertainties on the linewidths and are simply 2 and 3 times respectively.
4 Results
The results are presented in Table 5. The Mrk number is in col. 1, the morphological type in col. 2, the inclination in col. 3, the radial heliocentric HI velocity (in brackets when from LEDA) and its error (in km s-1) in cols. 4 and 5, the rms noise in the profile (in mJy) in col. 6, the signal-to-noise ratio (SNR) in col. 7, the measured linewidths at 20 and 50% of maximum intensity (in km s-1) in cols. 8 and 9. When no line was detected, the listed W50 was estimated from the TF relation and is given in brackets. The HI flux (or an upper limit) and its uncertainty (in Jy km s-1) are given in cols. 10 and 11. The last galaxy of that Table is UGCA 304, the companion of Mrk 1337.
The mean value of (col.7) is 5.5 0.3, while the mean signal-to-noise ratio for the fluxes (col. 10) is 4.4 0.3. The uncertainty estimate for the HI fluxes is thus rather conservative.
HI data for 21 of the galaxies selected for observation appeared in the LEDA database after our observing runs were initiated. A comparison with our own data is given in Table 1. The Mrk number is in col. 1, the radial heliocentric HI velocity (in brackets when from LEDA) and its uncertainty (in km s-1) in cols. 2 and 3, the measured linewidths at 20 and 50% of maximum intensity and their uncertainty (in km s-1) in cols. 4 to 7. An asterisk (*) following means that this is in fact . The maximum velocity of rotation and its uncertainty in log(km s-1) are given in col. 8 and 9, the HI flux (or an upper limit) and its uncertainty (in Jy km s-1) are given in cols. 10 and 11. The signal-to-noise in col. 12 and the reference to the measurement in col 13. The references are coded as follows. 1 : this paper; 2 : Theureau et al., 1998; 3 : Giovanelli & Haynes, 1993; 4 : Haynes & Giovanelli, 1991; 5 : Henning, 1992; 6 : Davis & Seaquist, 1983; 7 : Bushouse, 1987; 8 : Giovanelli & Haynes, 1985; 9: Andreani et al., 1995 10: Thuan et al., 1999; 11: Smoker et al., 2000; 12: Garcia et al., 1994; 13: Heckman et al., 1978; 14: Haynes et al., 1997.
The maximum velocity of rotation is defined as (Theureau et al. 1998) :
| (3) |
where and are the linewidths corrected for instrumental resolution and internal velocity dispersion. The upper limits to the two HI fluxes taken from the literature were rederived using the linewidths determined by us.
The overall agreement between our data and the literature is satisfactory. The only discrepancy in the linewidths and concerns Mrk 1199. (Note that the discrepancy in the of Mrk 1200 is obviously due to the choice of inclination, which is not specified in ref. 2). The agreement among total HI fluxes is not as good, but when 3 sets of independent observations are available it appears that the fluxes of ref. 2 (Theureau et al. 1998) tend to be significantly lower than the other two. In the case of Mrk 860, the accuracy of the flux and error-bar quoted in the literature are questionable, in view of the rather short integration time. We are thus confident in the quality of our data and adopt them in all conflicting cases.
| Mrk | SNR | ref. | ||||||||||
|---|---|---|---|---|---|---|---|---|---|---|---|---|
| (1) | (2) | (3) | (4) | (5) | (6) | (7) | (8) | (9) | (10) | (11) | (12) | (13) |
| 84 | 6098 | 18 | 310 | 54 | 158 | 36 | 2.119 | 0.120 | 4.30 | 0.99 | 5.0 | 1 |
| 84 | 6108 | 11 | 247 | 32 | 231 | 21 | 2.058 | 0.066 | 2.7 | 0.7 | 4.3 | 2 |
| 90 | 4253 | 13 | 264 | 39 | 221 | 26 | 2.390 | 0.044 | 2.74 | 0.78 | 4.0 | 1 |
| 90 | 4252 | 7 | 249 | 21 | 234 | 14 | 2.369 | 0.025 | 1.8 | 0.4 | 6.6 | 2 |
| 271 | 7541 | 23 | 340 | 69 | 243 | 46 | 2.339 | 0.088 | 2.41 | 0.74 | 3.4 | 1 |
| 271 | 7546 | 282* | 2.323 | 1.71 | 7 | |||||||
| 306 | 5609 | 8 | 257 | 24 | 176 | 16 | 2.106 | 0.052 | 7.89 | 0.96 | 8.9 | 1 |
| 306 | 5605 | 246 | 153 | 2.074 | 5.42 | 30.0 | 3 | |||||
| 306 | 5778 | 594* | 2.554 | 11.90 | 7 | |||||||
| 359 | [5043] | 162 | 2.19 | 1 | ||||||||
| 359 | 5078 | 203 | 68 | 1.933 | 0.114 | 0.66 | 7. | 3 | ||||
| 374 | 12780 | 8 | 121 | 24 | 74 | 16 | 1.673 | 0.142 | 8.54 | 1.94 | 6.9 | 1 |
| 374 | 0.29 | 13 | ||||||||||
| 382 | 10099 | 16 | 189 | 48 | 149 | 32 | 2.285 | 0.069 | 1.15 | 0.59 | 3.2 | 1 |
| 382 | 0.99 | 13 | ||||||||||
| 592 | 7716 | 5 | 181 | 15 | 167 | 10 | 2.022 | 0.040 | 5.73 | 1.39 | 5.1 | 1 |
| 592 | 7735 | 250 | 219 | 2.161 | 4.10 | 7.3 | 4 | |||||
| 592 | 7736 | 8 | 175 | 8 | 1.972 | 2.5 | 0.5 | 11 | ||||
| 860 | 6868 | 10 | 140 | 30 | 104 | 20 | 1.811 | 0.129 | 1.50 | 0.52 | 4.6 | 1 |
| 860 | 6881 | 10 | 100 | 30 | 1.615 | 0.202 | 0.25 | 0.1 | 9 | |||
| 898 | 5072 | 13 | 296 | 39 | 256 | 26 | 2.224 | 0.065 | 1.94 | 0.63 | 4.0 | 1 |
| 898 | 5086 | 10 | 274 | 31 | 267 | 21 | 2.166 | 0.083 | 1.5 | 0.5 | 3.4 | 2 |
| 922 | 6574 | 10 | 145 | 30 | 95 | 20 | 3.18 | 0.99 | 5.4 | 1 | ||
| 922 | 6576 | 143 | 111 | 3.04 | 0.45 | 14.9 | 8 | |||||
| 929 | 5259 | 16 | 296 | 48 | 223 | 32 | 2.232 | 0.078 | 4.43 | 1.04 | 4.3 | 1 |
| 929 | 278 | 2.258 | 3.76 | 8 | ||||||||
| 1026 | 3994 | 8 | 271 | 24 | 205 | 16 | 2.221 | 0.040 | 12.87 | 1.59 | 8.2 | 1 |
| 1026 | 3989 | 6 | 260 | 19 | 212 | 13 | 2.151 | 0.075 | 7.7 | 0.9 | 11.7 | 2 |
| 1026 | 3961 | 15 | 274 | 45 | 201 | 30 | 2.221 | 0.075 | 8.3 | 1.9 | 12 | |
| 1039 | 2111 | 5 | 161 | 15 | 134 | 10 | 1.860 | 0.057 | 6.16 | 0.97 | 8.3 | 1 |
| 1039 | 2098 | 65 | 198 | 17 | 149 | 11 | 1.940 | 0.623 | 6.76 | 0.40 | 10 | |
| 1092 | 3356 | 3 | 338 | 9 | 311 | 6 | 2.215 | 0.015 | 19.90 | 1.22 | 14.7 | 1 |
| 1092 | 3363 | 4 | 336 | 13 | 319 | 9 | 2.174 | 0.020 | 12.2 | 1.3 | 10.8 | 2 |
| 1104 | 1991 | 37 | 155 | 111 | 109 | 74 | 2.139 | 0.224 | 16.85 | 4.99 | 1.4 | 1 |
| 1104 | 1985 | 135 | 107 | 2.095 | 21.12 | 5 | ||||||
| 1104 | 197* | 2.335 | 14.60 | 6 | ||||||||
| 1198 | 7635 | 10 | 509 | 30 | 466 | 20 | 2.414 | 0.032 | 9.63 | 1.79 | 4.9 | 1 |
| 1198 | 7647 | 12 | 511 | 35 | 495 | 23 | 2.391 | 0.031 | 3.4 | 0.8 | 4.0 | 2 |
| 1198 | 7.2 | 0.36 | 14 | |||||||||
| 1199 | 4085 | 17 | 171 | 51 | 60 | 34 | 1.859 | 0.196 | 1.78 | 0.67 | 4.9 | 1 |
| 1199 | 4031 | 14 | 282 | 43 | 170 | 29 | 2.165 | 0.117 | 3.1 | 0.6 | 7.5 | 2 |
| 1200 | 7788 | 8 | 293 | 24 | 253 | 16 | 2.486 | 0.022 | 4.45 | 0.77 | 6.2 | 1 |
| 1200 | 7784 | 14 | 248 | 42 | 242 | 28 | 2.928 | 0.014 | 0.9 | 0.5 | 2.4 | 2 |
| 1270 | 8307 | 14 | 299 | 42 | 196 | 28 | 2.250 | 0.066 | 7.60 | 1.41 | 5.8 | 1 |
| 1270 | 8357 | 18 | 314 | 55 | 187 | 37 | 2.219 | 0.141 | 3.0 | 0.6 | 6.2 | 2 |
| 1363 | 2743 | 3 | 206 | 9 | 197 | 6 | 2.236 | 0.015 | 9.46 | 1.09 | 9.9 | 1 |
| 1363 | 2736 | 3 | 206 | 10 | 200 | 7 | 2.239 | 0.014 | 5.8 | .9 | 10.2 | 2 |
We next examine the individual profiles, taking into account the morphological type and inclinations given in Table 5. Only a few of the galaxies of our sample have the standard saddle-shaped profile: Mrk 1092, 1337, 1363, 1425 and, to a lesser extent, Mrk 90, 382, 592, 827, 898, 905, 966, 968, 997, 1200, 1270. Only one narrow profile corresponds to a nearly face-on galaxy (Mrk 626); the others (Mrk 373, 922, 928, 937, 1064, 1104) suggest that the HI may in some instances be confined to the central parts of the galaxy. Such a behavior has also been noted for the molecular gas of these starburst galaxies (Contini et al. 1997a). Conversely, some nearly face-on galaxies, like Mrk 922 and 1200, have large line widths, suggesting non-planar motions. Most profiles appear perturbed, but, because of the generally low signal-to-noise ratio, it is difficult to draw more information about the dynamics of the neutral gas from these profiles.
Finally, we note that our data on Mrk 237 might be affected by confusion, since the galaxy has a very close companion at about the same recession velocity.
5 Analysis
We complemented the HI data from our 80 galaxies by data from the literature for 138 other galaxies, to form a large sample of 218 Mrk IRAS galaxies, 105 unbarred and 113 barred ones, which is given in Table 7. The Mrk number is in col. 1, the morphological type (SA = unbarred, SB = barred) in col. 2, the spectral type (stb = nuclear starburst; sy = Seyfert; st? and sy? are classifications from an IRAS color index as explained below) in col. 3, the numerical morphological type (defined in RC3; de Vaucouleurs et al. 1991) in col. 4, the inclination (in degrees) in col. 5, the isophotal diameter and its uncertainty (in log of 0.1′) in cols. 6 and 7, the maximum rotation velocity (in km s-1) and its uncertainty in cols. 8 and 9, the distance (in Mpc) in col. 10, the -band magnitude in col. 11, the oxygen abundance (O/H) with respect to solar in col. 12, the total HI mass and its uncertainty in M⊙ in cols. 13 and 14, the total far-infrared (FIR) luminosity (in L⊙ ) in col. 15 and the absolute blue magnitude in col. 16.
The spectral type (starburst or Seyfert) was taken from Contini et al. (1998), Mazzarella & Balzano (1986) or Mazzarella & Boroson (1993). When no classification was available, we estimated it from the IRAS color index (60,25) = / , where and are the IRAS fluxes at 60 and 25 m respectively. According to Coziol et al. (1998), (60,25) is larger than for Seyferts and between and for starburst galaxies; this last spectral classification is of course to be taken with caution. The maximum rotation velocity was computed from the linewidths (given in Table 5) corrected for resolution and internal velocity dispersion (eq. 3), or taken from LEDA when not in Table 5.
The distance was estimated from the recession velocity corrected for Virgocentric flow (given in LEDA) and a Hubble constant of 75 km s-1 Mpc-1. The -band magnitude was taken from NED333NED (http://nedwww.ipac.caltech.edu) or from Bergougnan et al. (paper VII, in preparation). The oxygen abundance was taken from Contini (1996) for the barred (SB) galaxies and from the literature, mainly Balzano (1983) and Dahari & De Robertis (1988), for the unbarred (SA) ones. The O/H for the SA are generally based on photographic work and thus more uncertain than that for the SB. The total HI mass was derived from the corrected total fluxes (given in Table 1) according to the following equation (Haynes & Giovanelli 1984):
| (4) |
For galaxies not observed at Nançay, it was estimated from the parameter in LEDA using the equation :
| (5) |
The morphological type, inclination, isophotal diameter, FIR luminosity and absolute magnitude were taken from LEDA.
5.1 Neutral hydrogen content
| Sample | ||||||||
| [Mpc] | [kpc] | [log(M⊙)] | [log(M⊙L⊙-1)] | [log(M⊙kpc-2)] | [log(M⊙kpc-2)] | |||
| Mrk IRAS Galaxies | ||||||||
| All | 218 | 3.080.17 | 76.62.8 | 23.30.7 | 9.690.03 | -0.630.03 | 7.040.03 | 0.240.03 (=199) |
| Barred | 113 | 3.040.21 | 71.93.7 | 23.51.0 | 9.650.04 | -0.650.03 | 6.990.04 | 0.200.03 (=106) |
| Unbarred | 105 | 3.130.27 | 81.74.0 | 23.11.0 | 9.730.04 | -0.600.03 | 7.090.04 | 0.290.04 (=93) |
| Normal Galaxies (Mathewson & Ford 1996) | ||||||||
| All | 1197 | 4.920.05 | 46.50.7 | 27.00.4 | 9.700.01 | -0.520.01 | 6.930.01 | 0.100.01 (=1194) |
| Barred | 678 | 5.310.07 | 40.50.9 | 25.30.5 | 9.620.02 | -0.540.01 | 6.910.01 | 0.070.01 (=677) |
| Unbarred | 519 | 4.410.06 | 54.21.2 | 29.20.6 | 9.800.02 | -0.500.02 | 6.950.01 | 0.130.01 (=517) |
The first questions to address are i) whether Mrk IRAS galaxies have an abnormal neutral hydrogen content with respect to normal galaxies, and ii) whether the HI content of barred and unbarred galaxies differ. As comparison sample of “normal” galaxies, we used the the sample of Mathewson & Ford (1996). In order to compare homogeneous sets of data, we only selected the 1197 normal galaxies for which the maximum velocity and HI flux were available in LEDA.
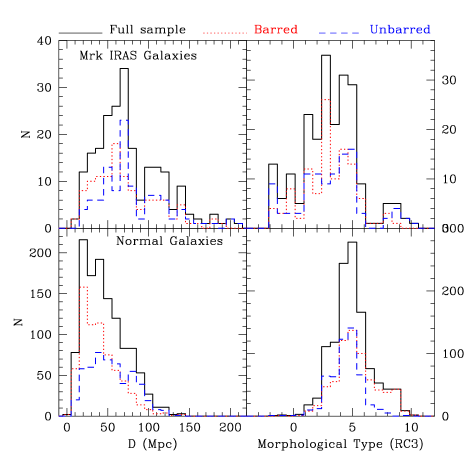
The Mrk IRAS galaxies have on average the same quantity of HI mass as the normal galaxies (see Table 2). However, this result is probably affected by selection effects. Indeed, our sample of Mrk IRAS galaxies and that of normal galaxies do not have the same distributions in distance, nor in morphological type (see Fig. 4); the Mrk IRAS galaxies are further away and of earlier type than the normal galaxies. Galaxies observed further away tend to have higher masses because of the Malmquist bias, and later-type galaxies tend to be richer in HI.
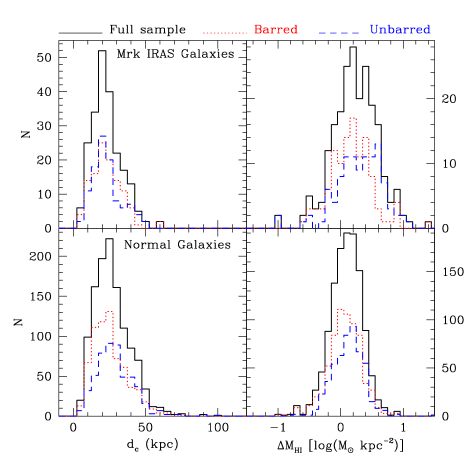
In order to circumvent the distance bias, we normalize the HI mass by (the corrected linear diameter at the isophote 25 blue mag arcsec-2) squared, which is free of Malmquist bias. This has the dimension of an HI surface density; but one has to keep in mind that the blue isophotal diameter does not necessarily measure the radial extent of the HI distribution. The distribution of isophotal diameters is shown in Fig. 5, for the sample of Mrk IRAS galaxies and for the comparison sample of normal galaxies. Mean values of isophotal diameters and HI surface densities, , with uncertainties are listed in Table 2, where a distinction is made between barred and unbarred galaxies.
We find that, on average, the Mrk IRAS have a higher surface density than the normal galaxies. But, as noted above, the two samples do not have the same distributions in morphological types, which introduces another bias. To take these differences into account, we calculate the excess HI mass over that predicted for a given morphological type and diameter (, in kpc), using the following equation :
| (6) |
where the constants and are given in Table V of Haynes & Giovanelli (1984) for the different morphological types, except those earlier than S0 (). The values of excess HI mass for the different subsamples are listed in Table 2, together with the number of objects (since types earlier than S0 were not included). As a check, we corrected the HI surface densities in another way, using as reference the mean HI surface densities given by Giovanelli & Haynes (1988; their Table 12.1); this method leads to results that are in qualitative agreement with those obtained by the method of Haynes & Giovanelli (1984).
We find that Mrk IRAS galaxies have a larger excess () of HI mass than normal galaxies. The fact that most galaxies have a positive excess of HI mass is due to the definition of the diameter: Haynes & Giovanelli (1984) use the uncorrected diameter from UGC, whereas we use the corrected diameter from LEDA, and the LEDA uncorrected angular diameters are on average 9% smaller than the UGC diameters (Paturel et al. 1991).
We also computed the HI mass to blue light ratio for the two samples, and find that the Mrk IRAS galaxies have a lower ratio than the normal galaxies. This is contrary to expectations, and probably due to the fact that the two samples have different distributions in type (see Fig. 4) : the Mrk IRAS are of earlier type, thus of brighter absolute magnitude (see Roberts & Haynes 1994) than the other sample. There is in fact a small magnitude dependence in the HI mass to blue luminosity ratio expressed as (see Smoker et al. 2000 and references therein). We find that = – 0.33 for both our samples. Computing reduces, but does not reverse the trend. But this is perhaps not a very good HI mass indicator, since the exponent depends on the sample, and ranges from – 0.1 to – 0.33.
We finally computed the excess HI mass over that predicted for a given morphological type and luminosity, using the constants given in Table V of Haynes & Giovanelli (1984). For this type of bias correction we find the expected trend, that the Mrk IRAS galaxies have on average a larger HI mass excess than the normal galaxies, and that the normal barred galaxies have less excess than the normal unbarred galaxies (there is no significant difference between the barred and unbarred Mrk IRAS galaxies in that respect).
These last results weaken our claim that the Mrk IRAS galaxies have more HI than normal galaxies. However, as stated by Haynes & Giovanelli (1984), normalizing the HI mass by the luminosity leads to HI mass indicators of inferior quality compared to .
The answer to the second question, whether barred and unbarred galaxies have different HI content, is perhaps easier to give, since the detection of a bar is less likely to be biased. One could argue that bars are less conspicuous in more distant galaxies (and, indeed, the unbarred galaxies tend to be further away than the barred ones in Table 2), but our classification (in the Mrk IRAS sample) is based on high resolution images (Contini, 1996), thus less affected by the Malmquist effect.
| Sample | Parameter | |||
|---|---|---|---|---|
| Mrk vs Normal | 46.8 | 99.9 | 99.9 | 99.8 |
| Mrk : SA vs SB | 90.7 | 69.6 | 95.5 | 99.1 |
| Normal : SA vs SB | 99.9 | 97.0 | 98.0 | 99.9 |
We find that barred galaxies have on average a lower HI mass, lower HI mass to blue luminosity, lower HI surface density and lower HI mass excess than unbarred ones (see Table 2), and this is true for both Mrk IRAS and normal galaxies.
We performed Kolmogorov-Smirnov tests to quantify the statistical significance of the differences found between samples. The results are summarized in Table 3, which gives the confidence level (in percent) at which the two samples are drawn for different populations. The difference in the parameters and is significant at a confidence level of at least 95%, and mostly of 98-99%. As stated above, the significance of the differences in is probably illusory in view of possible Malmquist bias.
In summary, the two main results of this subsection are that i) Mrk IRAS galaxies have a larger excess of HI mass than normal galaxies, and ii), within each category (Mrk IRAS or normal), unbarred galaxies have a larger HI mass, mass density and mass excess than barred ones. This is a clear indication that activity (starbursts or Seyfert) and the presence of a bar are both related to the HI content of galaxies.
Finally, we must point out that we did not find any dependence of the HI mass excess on the global star formation rate of galaxies, measured by the FIR luminosity. This also holds for barred and unbarred galaxies considered separately, and by excluding Seyferts and uncertain types of nuclear activity (st?, sy?; see Table 7). On the other hand, we do find the correlation between star formation rate and HI surface density which has been established for different samples of nearby galaxies (e.g. Kennicutt 1989; Donas et al. 1990; Deharveng et al. 1994; Boselli 1994; Kennicutt 1998).
5.2 Tully-Fisher relation


| Mrk | Spe | O/H | Envir. | |||
| (1) | (2) | (3) | (4) | (5) | (6) | (7) |
| Barred Galaxies | ||||||
| 52 | stb | 0.78 | 9.72 | -0.14 | -0.431 | isolated |
| 300 | stb | 0.74 | 10.45 | 0.25 | -0.350 | satellite |
| 307 | stb | 1.00 | 10.26 | 0.22 | -0.287 | isolated |
| 313 | sy2 | 9.55 | 0.87 | -0.261 | in group | |
| 319 | stb | 0.44 | 10.88 | 0.13 | -0.295 | pair (1.5′) |
| 353 | stb | 0.55 | 10.35 | 0.11 | -0.342 | isolated |
| 471 | sy2 | 10.40 | 0.02 | -0.269 | isolated | |
| 489 | stb | 0.57 | 10.74 | 0.91 | -0.332 | isolated |
| 592 | stb | 10.36 | 0.38 | -0.233 | isolated | |
| 691 | stb | 1.50 | 10.12 | 0.45 | -0.244 | satellite |
| 1157 | sy2 | 10.05 | -0.07 | -0.203 | isolated | |
| 1302 | stb | 0.90 | 9.68 | 0.41 | -0.535 | isolated |
| mean | 10.21 | 0.30 | ||||
| Unbarred Galaxies | ||||||
| 201 | stb | 0.44 | 10.59 | -0.11 | -0.458 | merger? |
| 331 | st? | 11.08 | 0.65 | -0.239 | pair (2.0′) | |
| 685 | st? | 0.22 | 9.65 | 0.55 | -0.265 | isolated |
| 905 | st? | 9.95 | 0.69 | -0.442 | pair (1.7′) | |
| 1003 | sy? | 9.36 | -0.12 | -0.218 | isolated | |
| mean | 10.13 | 0.33 | ||||
The Tully-Fisher relation is one of the most basic relations among spiral galaxies and provides a critical constraint on galaxy formation theories. The third objective of this analysis is to examine whether the Mrk IRAS galaxies follow the TF relation.
We determined a TF relation for normal galaxies in the and bands using the sample of Mathewson & Ford (1996), extracting the relevant parameters from LEDA and NED, and restricting our analysis to galaxies with an uncertainty smaller than 0.1 on and an inclination larger than 30∘. There were 1162 such galaxies for calibrating the -band TF relation, and 682 for the band. The advantage of determining our own relations, rather than relying on relations from the literature, is that we are comparing homogeneous sets of data, affected in the same way by systematic effects and errors.
In the band, the relation is :
| (7) |
In the band, it is :
| (8) |
The -band TF relation for our sample of Mrk IRAS galaxies is shown in Fig. 6, together with the linear relation for normal galaxies. This Figure is limited to data with an uncertainty in smaller than 0.1 and inclinations larger than 30∘. This plot shows that there is no difference between the barred and unbarred galaxies. More remarquably, it also shows that the Mrk IRAS galaxies do not follow the local -band TF relation, as already stated in Coziol et al. (2000), showing a large scatter.
One could argue that the luminosity in the -band is dominated by young OB stars in starbursts or by the non-thermal nucleus in Seyferts and thus is not a good tracer of the total virial mass. A starburst generally brightens the galaxy by up to 2 mag in , and only 0.5 mag in (Mouhcine & Lançon 2003). However, there is admittedly no significant excess of galaxies with low compared to high-ones, which is surprizing. One could perhaps argue that the B-band TF relation estimated from normal galaxies is affected by unidentified starburst galaxies in the sample, or that OB stars and dust play in opposite senses in starburst galaxies, contributing to the observed scatter. At any rate, to avoid potential problems of the band, we use the -band absolute magnitude as mass indicator.
The -band TF relation for our sample of starburst and Seyfert galaxies is shown in Fig. 6, together with the linear relation for normal galaxies. This Figure is limited to data with an uncertainty in smaller than 0.1 and an inclination larger than 30∘. Like the TF relation in the band, we find no difference between the barred and unbarred galaxies, and a significant proportion of galaxies with very low .
The fact that the barred and unbarred galaxies show no difference in the TF plane is not specific to Mrk IRAS galaxies. We have verified that this is also true for the normal galaxies of Mathewson & Ford (1996). Courteau et al. (2003) reach a similar conclusion, but based on optical kinematics. This simply means that the presence of a bar does not affect the proportion of luminous to dark matter at a given radius.
We believe that the excess of galaxies with low in Fig. 6 is real, and tells us something about the physical properties of Mrk IRAS galaxies. We next try to identify the origin of this effect, by investigating the 17 most deviant galaxies in the -band TF diagram. They are indicated by a triangular symbol in both panels of Fig. 6; one can see that most of them are also deviant in the -band TF relation. Their properties are listed in Table 4.
The HI distribution has been mapped in only two galaxies (Mrk 52 and 313) among those listed in Table 4. The HI distribution of Mrk 52 is well resolved, revealing a centrally peaked column density structure (Taylor et al. 1995). The velocity map of this galaxy indicates differential rotation, though it lacks spatial and velocity resolution to detect any asymmetries that might exist. High-resolution HI observations in the Mrk 313 group of galaxies reveal that the HI morphology of almost all the member galaxies are affected by the environment and four galaxies show tidally distorted HI morphology and kinematics (Li & Seaquist 1994). The HI emission of the pair NGC 7464/Mrk 313 is dominated by a ring around Mrk 313. The orientation of Mrk 313 and the ring suggest that it represents a polar ring around Mrk 313 and could be material pulled out of NGC 7464 during a close encounter with Mrk 313.
For the other galaxies, we have to rely on the HI profiles. Four of them are in Fig. 1, the others can be found in the literature. Only a few galaxies have a classical double-horned profile : Mrk 52, 307, 489, 592, and possibly Mrk 300 and 319. The others have a sloping profile, either gaussian or centrally peaked (Mrk 201, 331, 353, 691, 905, 1064, 1302) or a lopsided profile (Mrk 313, 471, 685, 1003, 1157). The gaussian/centrally peaked profiles suggest that the HI is centrally concentrated and does not extend to the flat part of the rotation curve, the lopsided profiles indicate uneven distribution of HI in the disk of the galaxy. In summary, such profiles indicate that the HI gas has not reached equilibrium in these galaxies.


Peculiar HI kinematics does not seem to be limited to active galaxies. We have examined the properties of the 7 galaxies which have an abnormally low in the -band TF relation for the 682 normal galaxies (Mathewson & Ford 1996). Five of these galaxies (ESO 34-3, 446-2, 512-12, 563-13, 576-1) become “normal” again if one uses the maximum rotation velocity of the ionized gas instead of that of the HI gas. For the two other ones (ESO 384-32 and UGC 645) optical kinematics are not available. Thus peculiar HI kinematics in an otherwise normally rotating galaxy can also be found among normal galaxies, unless these objects are misclassified in terms of nuclear activity.
In order to better understand the cause of the slow rotation of the neutral HI gas in part of our sample, we have looked for correlations with other properties of the galaxies. Their environment, as determined from CCD and sky survey images, gives no indication to explain the perturbed kinematics : only one galaxy (Mrk 201) appears strongly disturbed, and another one (Mrk 313) is in a group, while the others are isolated or in rather distant pairs and fairly symmetric in shape (Table 4). The 17 deviant galaxies have on average a much higher HI mass excess ( and for the barred and unbarred galaxies respectively, see Table 4) than the whole sample of Mrk IRAS galaxies (Table 2). As pointed out by the referee, applying the baryonic correction advocated by McGaugh et al. (2000) to these gas-rich galaxies makes them even more deviant, and thus even more peculiar.
The deviant galaxies also have a stronger FIR luminosity and a lower oxygen abundance. This is shown in Fig. 7, which give the difference between the observed and that given by Eq. 8 as a function of FIR luminosity ( in L⊙) and oxygen abundance (O/H) respectively. Only the data with an accuracy in better than 0.1 and an inclination larger than 30∘ are plotted. The same holds true for the departure from the TF relation in the band. These trends are reinforced if one plots data with an accuracy in better than 0.2 (instead of 0.1). It thus appears that the most deviant galaxies are the youngest ones and those with the highest star formation rates, which is proportional to .
6 Conclusions
The first objective of this paper was to search for differences in HI content between Mrk IRAS and “normal” galaxies, and between barred and unbarred galaxies. We compared the HI properties of two homogeneous samples of Mrk IRAS (mainly starburst) and normal galaxies, with a further distinction between barred and unbarred objects. The main results of this comparative study can be summarized as follows.
Taking into account selection effects due to different distributions in distances and morphological type between normal and Mrk IRAS galaxies, we find that unbarred galaxies have more HI gas than barred ones. This is probably the most important result of this paper. Our interpretation is that the bar contributes efficiently to transforming the neutral hydrogen into molecular form, by funneling it into denser and dust-rich regions where most CO is detected : the leading edge of the bar (Sheth et al. 2002) and subsequently the central regions of the galaxy, where most star formation takes place. Note, however, that the bars of the Mrk IRAS galaxies are too young to have contributed to the actual central starburst (Coziol et al. 2000; Considère et al. 2000).
We also find that the Mrk IRAS galaxies have more neutral gas than normal galaxies. Although less robust, this result suggests that these galaxies have transformed less HI into stars because they are young, as testified by their metallicity (e.g. Coziol et al. 1997).
The other objective of this study was to investigate how the Mrk IRAS galaxies behave with respect to the TF relation, which is a fundamental scaling relation between the galaxy mass and its large-scale dynamics. We found that a significant fraction of Mrk IRAS galaxies strongly deviate from the TF relation defined for normal galaxies, both in the and the bands. This is the other striking result of this study and, as already pointed out by Coziol et al. (2000), an important property of starburst galaxies. However, the interpretation of these deviations is not straightforward, because we have no detailed kinematic information on these galaxies.
Peculiar HI distribution and kinematics seem to be quite common among star-forming galaxies (e.g., Taramopoulos, Payne & Briggs 2001; Meurer, Staveley-Smith & Killeen 1998; Swaters, Sancisi & van der Hulst 1997; Hurt, Turner & Ho 1996; Kobulnicky & Skillman 1995). The motion of HI gas in the vertical direction has been studied in several nearby spiral galaxies. The general interpretation of these vertical motions is that they are the result of the formation and expansion of supershells around starburst nuclei due to stellar winds from massive OB stars and/or supernova explosions (e.g. Sancisi et al. 2001). Finally, Barton et al. (2001) have recently shown that a significant fraction of star-forming galaxies in close pairs deviate from the TF relation, with lower values of . Although most of these outliers show signs of recent star formation, Barton et al. (2001) suggest that gas dynamical effects are probably the dominant cause of their anomalous TF properties, some of them showing signs of recent gas infall after a close galaxy-galaxy pass.
Most of the deviant galaxies in Table 4 are isolated, suggesting that strong gravitational interactions are not at the origin of the peculiar HI kinematics, except perhaps for Mrk 201 and 313. We assume that the HI gas has been recently accreted by these galaxies in minor merger events, and has not settled to dynamical equilibrium (lopsided profiles), or is partly in non-planar motion induced by superwinds (gaussian/centrally peaked profiles). A single minor merger is not sufficient to raise the HI mass excess by 0.15, since it would require that the typical merging dwarf contribute 40% of the HI mass of the galaxy. We thus have to assume either that our galaxies frequently suffered minor mergers (say 4 to 7 in their lifetime), which seems unprobable in view of their generally low metallicity (and thus age), or that they were initially gas-rich; a combination of the two possibilities is probably the correct scenario, since, as pointed out by the referee, gas-rich disks are likely to respond to mergers by more vigorous starburst.
How can we interpret these results in terms of the evolutionary stage of starburst galaxies?
In the framework of the hierarchical formation of galaxies, gravitational interactions play a fundamental role in galaxy evolution, primarily through minor galaxy-galaxy encounters. In the local universe, starburst nucleus galaxies are certainly the best examples of such processes. They frequently show signatures of recent interactions (e.g., Contini 1996) and have systematically lower metallicities than normal galaxies of similar masses and morphological types (Coziol et al. 1997), suggesting a particularly early evolutionary stage. Moreover, recent studies have shown that their bar structures were formed recently (age Gyr; Considère et al. 2000) mainly because these galaxies are still forming their disks (Coziol et al. 2000). A detailed and exhaustive study of their chemical abundances further revealed that the star formation history of starburst nucleus galaxies is probably dominated by a succession of starbursts extending over a few Gyr (Coziol 1996; Coziol et al. 1999; Mouhcine & Contini 2002). The most natural explanation for such a star formation scenario involves the trigger of starbursts by gravitational interactions, mainly through minor mergers.
The results of this paper, which concerns both the global gas content and the large-scale HI dynamics in starburst galaxies, further support this evolutionary scenario. Starburst galaxies contain more neutral gas than normal ones because they recently underwent several minor mergers which increased their reservoir of HI gas and triggered nuclear starbursts. A significant fraction of these galaxies show strong deviations from the TF relations because the recently accreted HI gas has not had time to become stable in a regularly rotating disk and reach dynamical equilibrium. The fact that the most deviant galaxies are those with the highest star formation rates and the lowest metallicities is not surprizing. The level of dynamical perturbations in the HI kinematics (measured by the departure from the TF relation), as well as the level of induced star formation (measured by ) should scale in principle with the intensity of the latest gravitational interaction undergone by the galaxy. Following the well-known scaling relation between metallicity and mass, metal-poor galaxies have small masses and are thus more affected by interactions than massive ones, explaining the observed trend in Fig. 7.
As predicted by numerical simulations, low-level gravitational interactions are the best way to initiate instabilities in the stellar galactic disk and thus to form a bar. This could explain why bars are so “young” in starburst galaxies: their disks are still forming and they suffered recent minor interactions. The difference in HI content between barred and unbarred galaxies – the latter being richer – could be explained by the efficiency of bars in driving gas toward denser and dust-richer regions of galaxies, where it is transformed into molecular clouds on its way to forming stars. Following this scenario, barred galaxies should contain more molecular gas than unbarred ones. We are investigating this prediction thanks to new CO observations of Mrk starburst galaxies (Contini et al., in preparation).
Over the past few years, considerable progress have been achieved in our understanding of galaxy formation and evolution. In particular, deep photometric and spectroscopic surveys performed on the largest telescopes revelead populations of luminous star-forming galaxies up to redshifts 3 – 4. Even if it remains unclear whether these objects are representative of the whole galaxy population that exists in the distant universe, the starburst phenomenon appears now as a key process in galaxy evolution.
Acknowledgements.
We thank the technical staff of Observatoire de Nançay for their help in acquiring the data, and Gilles Theureau for help with the absolute calibration. We acknowledge with thanks detailed constructive comments from an anonymous referee, which considerably improved the paper. This research has made use of LEDA (the Lyon-Meudon Extragalactic Database; http://leda.univ-lyon1.fr), and of NED (the NASA/IPAC Extragalactic Database; http://nedwww.ipac.caltech.edu) which is operated by the Jet Propulsion Laboratory, California Institute of Technology, under contract with the National Aeronautics and Space Administration.References
- Andreani et al. (1995) Andreani P., Casoli F., Gerin M., 1995, A&A, 300, 43
- Balzano (1983) Balzano V.A., 1983, ApJ, 268, 602
- Barton et al. (2001) Barton E. J., Geller M. J., Bromley B. C., van Zee L., Kenyon S. J., 2001, AJ, 121, 625
- Boselli (1994) Boselli A., 1994, A&A, 292, 1
- Burstein & Sarazin (1983) Burstein D., Sarazin C. L., 1983, ApJ, 264, 427
- Bushouse (1987) Bushouse, H. A., 1987, ApJ 320, 49
- Chapelon et al. (1999) Chapelon S., Contini T., Davoust E., 1999, A&A, 345, 81 (paper V)
- Cole et al. (1994) Cole S., Aragon-Salamanca A., Frenk C. S., Navarro J. F., Zepf S. E., 1994, MNRAS, 271, 781
- Considère et al. (2000) Considère S., Coziol R., Contini T., Davoust E., 2000, A&A, 356, 89 (paper IV)
- Contini (1996) Contini T., 1996, Ph. D. thesis, Université Pau. Sabatier, Toulouse, France
- Contini et al. (1998) Contini T., Considère S., Davoust E., 1998, A&AS, 130, 285 (paper III)
- Contini et al. (1995) Contini T., Davoust E., Considère S., 1995, A&A, 303, 440 (paper I)
- Contini et al. (1997a) Contini T., Wozniak H., Considère S., Davoust E., 1997a, A&A, 324, 41 (paper II)
- Contini et al. (1997b) Contini T., Wozniak H., Considère S., Davoust E., 1997b, A&A, 318, L51
- Courteau (1997) Courteau S., 1997, AJ, 114, 2402
- Courteau et al. (2003) Courteau S., Andersen D.R., Bershady M.A., MacArthur L.A., Rix H.-W., 2003, ApJ, 594, 208
- Courteau & Rix (1999) Courteau S., Rix H., 1999, ApJ, 513, 561
- Coziol et al. (1996) Coziol R., 1996, A&A, 309, 345
- Coziol et al. (1998) Coziol R., Torres C.A.O., Quast G.R., Contini T., Davoust E., 1998, ApJS, 119, 239
- Coziol et al. (1997) Coziol R., Contini T., Davoust E., Considère S., 1997, ApJ, 481, L67
- Coziol et al. (2000) Coziol R., Considère S., Davoust E., Contini T., 2000, A&A, 356, 102
- Dahari & De Robertis (1988) Dahari O., De Robertis M.M., 1988, ApJS 67, 249
- Davis & Seaquist (1983) Davis, L. E., Seaquist, E. R, 1983, ApJS 53, 269
- Deharveng et al. (1994) Deharveng J-M., Sasseen T. P., Buat V., Bowyer S., Lampton M., Wu X., 1994, A&A, 289, 715
- de Vaucouleurs et al. (1991) de Vaucouleurs, G.de Vaucouleurs, A., Corwin, H.G., et al., 1991, Third Reference Catalogue of Bright Galaxies Springer Verlag.
- Donas et al. (1990) Donas J., Milliard B., Laget M., Buat V., 1990, A&A, 235, 60
- Eisenstein & Loeb (1996) Eisenstein D. J., Loeb A., 1996, ApJ, 459, 432
- Eskridge & Pogge (1991) Eskridge P. B., Pogge R. W., 1991, AJ, 101, 2056
- Faber & Jackson (1976) Faber S. M., Jackson R. E., 1976, ApJ, 204, 668
- Fouqué et al. (1990) Fouqué P., Bottinelli L., Durand N., et al. 1990, A&AS 86, 473
- Friedli & Benz (1993) Friedli D., Benz W., 1993, A&A, 268, 65
- Friedli & Benz (1995) Friedli D., Benz W., 1995, A&A, 301, 649
- Garcia et al. (1994) Garcia, A. M.; Bottinelli, L.; Garnier, R, et al. 1994, A&AS 107, 265
- Giovanelli & Haynes (1985) Giovanelli, R., Haynes, M. P., 1985, AJ 90, 2445
- Giovanelli & Haynes (1988) Giovanelli R., Haynes M.P., 1988, in “Galactic and Extragalactic Radio Astronomy”, G. L. Verschuur & K. I. Kellermann (eds.), Springer-Verlag, p. 522
- Giovanelli & Haynes (1993) Giovanelli, R., Haynes, M. P., 1993, AJ 105, 1271
- Haynes & Giovanelli (1984) Haynes M.P., Giovanelli R., 1984, AJ, 89, 758
- Haynes & Giovanelli (1991) Haynes, M. P., Giovanelli, R., 1991, ApJS 77, 331
- Haynes et al. (1997) Haynes, M. P., Giovanelli, R., Herter, T., 1997, AJ 113, 1197
- Heckman et al. (1978) Heckman,T. M.; Balick, B.; Sullivan, W. T. III, 1978, ApJ 224, 745
- Henning (1992) Henning, P. A., 1992, ApJS 78, 365
- Hunter et al. (2000) Hunter D. A., Hunsberger S. D., Roye E. W., 2000, ApJ, 542, 137
- Hurt et al. (1996) Hurt R. L., Turner J. L., Ho P. T. P., 1996, ApJ, 466, 135
- Jackson et al. (1987) Jackson J. M., Barrett A. H., Armstrong J. T., Ho P. T. P., 1987, AJ, 93, 531
- Keel & van Soest (1992) Keel W. C., van Soest E. T. M., 1992, A&AS, 94, 553
- Kennicutt (1989) Kennicutt R. C., 1989, ApJ, 344, 685
- Kennicutt (1998) Kennicutt R. C., 1998, ApJ, 498, 541
- Kobulnicky & Skillman (1995) Kobulnicky H. A., Skillman E. D., 1995, ApJ, 454, L121
- Koda et al. (2000) Koda J., Sofue Y., Wada K., 2000, ApJ, 532, 214
- Li & Seaquist (1994) Li J. G., Seaquist E. R., 1994, AJ, 107, 1953
- Martin et al. (1991) Martin J.-M., Bottinelli L., Dennefeld M., Gougenheim L., 1991, A&A 245, 393
- Mathewson & Ford (1996) Mathewson D.S., Ford V.L., 1996, ApJS 107, 97
- Matthews et al. (1998) Matthews L. D., van Driel W., Gallagher J. S., 1998, AJ 116, 2196
- Mazzarella & Balzano (1986) Mazzarella J.M., Balzano V.A., 1986, ApJS 62, 751
- Mazzarella & Boroson (1993) Mazzarella J.M., Boroson T.A., 1993, ApJS 85, 27
- McGaugh et al. (2000) McGaugh S. S., Schombert J. M., Bothun G. D., de Blok W. J. G., 2000, ApJ, 533, L99
- Meurer et al. (1998) Meurer G. R., Staveley-Smith L., Killeen N. E. B., 1998, MNRAS, 300, 705
- Mihos & Hernquist (1994) Mihos J. C., Hernquist L., 1994, ApJ, 425, L13
- irabel & Sanders (1988) Mirabel I. F., Sanders D. B., 1988, ApJ, 335, 104
- Mo & Mao (2000) Mo H. J., Mao S., 2000, MNRAS, 318, 163
- Mouhcine & Contini (2002) Mouhcine M., Contini T., 2002, A&A 389, 106
- Mouhcine & Lançon (2002) Mouhcine M., Lançon., 2003, A&A 402,425
- Navarro & Steinmetz (2000) Navarro J. F., Steinmetz M., 2000, ApJ, 538, 477
- Noguchi (1988) Noguchi, M. 1988, A&A, 203, 259
- O’Neil et al. (2000) O’Neil K., Bothun G. D., Schombert J., 2000, AJ, 119, 136
- Paturel et al. (1991) Paturel G., Fouqué P., Buta R., Garcia A.M., 1991, A&A 243, 319
- Pierce & Tully (1992) Pierce M. J., Tully R. B., 1992, ApJ, 387, 47
- Sheth et al. (2002) Sheth, K., Vogel, S.N., Regan, M.W. et al., 2002, AJ 124, 2581
- Rubin et al. (1985) Rubin V. C., Burstein D., Ford W. K., Thonnard N., 1985, ApJ, 289, 81
- Sancisi et al. (2001) Sancisi R., Fraternali F., Oosterloo T., van Moorsel G., 2001, in “Galaxy disks & disk galaxies”, ASP Conf. Series, J.G. Funes & E.M. Corsini (eds.), p.111
- Shlosman et al. (1989) Shlosman I., Frank J., Begelman M. C., 1989, Nature, 338, 45
- Smoker et al. (2000) Smoker, J. V.; Davies, R. D.; Axon, D. J.; Hummel, E., 2000, A&A 361, 19
- Steinmetz & Navarro (1999) Steinmetz M., Navarro J. F., 1999, ApJ, 513, 555
- Swaters et al. (1997) Swaters R. A., Sancisi R., van der Hulst J. M., 1997, ApJ, 491, 140
- Taramopoulos et al. (2001) Taramopoulos A., Payne H., Briggs F. H., 2001, A&A, 365, 360
- Taylor et al. (1995) Taylor C. L., Brinks E., Grashuis R. M., Skillman E. D., 1995, ApJS, 99, 427
- Theureau et al. (1998) Theureau G., Bottinelli L., Coudreau-Durand N., et al. 1998, A&AS 130, 333
- Thuan et al. (1999) Thuan T.X., Lipovetsky V.A., Martin J.-M. et al., 1999, A&AS 139, 1
- Tully & Fisher (1977) Tully R.B., Fisher J.R., 1977, A&A 54, 661
- Tully & Pierce (2000) Tully R. B., Pierce M. J., 2000, ApJ, 533, 744
- van den Bosch (2000) van den Bosch F. C., 2000, ApJ, 530, 177
- Zaritsky & Rix (1997) Zaritsky D., Rix H., 1997, ApJ, 477, 118
| Mrk | t | incl | rms | SNR | ||||||
|---|---|---|---|---|---|---|---|---|---|---|
| [deg] | [km s-1] | [km s-1] | [mJy] | [km s-1] | [km s-1] | [Jy km s-1] | [Jy km s-1] | |||
| (1) | (2) | (3) | (4) | (5) | (6) | (7) | (8) | (9) | (10) | (11) |
| 21 | 3.6 | 58 | 8433 | 18 | 7.1 | 3.4 | 301 | 236 | 1.37 | 0.80 |
| 38 | 3.4 | 70 | 10813 | 28 | 6.7 | 3.2 | 287 | 148 | 1.70 | 0.82 |
| 42 | 2.7 | 38 | [7200] | 10.1 | [132] | 3.98 | ||||
| 54 | 5.1 | 69 | 13450 | 16 | 4.8 | 3.2 | 225 | 185 | 1.64 | 0.68 |
| 78 | 50 | [11194] | 9.1 | [236] | 6.45 | |||||
| 84 | 3.6 | 62 | 6098 | 19 | 5.7 | 5.0 | 310 | 158 | 4.30 | 0.99 |
| 90 | 3.8 | 29 | 4253 | 13 | 4.5 | 4.0 | 264 | 221 | 2.74 | 0.78 |
| 103 | 4.8 | 29 | [9353] | 8.8 | [167] | 4.40 | ||||
| 109 | 8.0 | 50 | 9054 | 7 | 5.6 | 8.0 | 308 | 251 | 7.47 | 1.01 |
| 122 | 2.0 | 63 | [6538] | 10.1 | [289] | 8.78 | ||||
| 141 | -4.9 | [12265] | 12.1 | [141] | 5.11 | |||||
| 144 | 4.8 | 25 | [8253] | 9.6 | [118] | 3.39 | ||||
| 152 | 2.7 | 68 | [6896] | 7.6 | [277] | 6.28 | ||||
| 236 | 2.7 | 47 | 14895 | 19 | 10.4 | 4.4 | 259 | 142 | 3.77 | 1.32 |
| 237 | 3.4 | 38 | 8937 | 13 | 3.9 | 3.3 | 186 | 160 | 2.13 | 0.70 |
| 238 | 4.9 | 27 | 14884 | 31 | 6.3 | 3.3 | 283 | 110 | 1.90 | 0.84 |
| 262 | 71 | 8918 | 25 | 8.1 | 2.8 | 208 | 129 | 2.44 | 1.11 | |
| 264 | [18746] | 10.6 | [154] | 4.87 | ||||||
| 271 | 3.1 | 42 | 7541 | 6.2 | 3.4 | 340 | 243 | 2.41 | 0.74 | |
| 288 | 4.9 | 74 | [7500] | 9.2 | [227] | 6.25 | ||||
| 291 | 1.1 | 47 | [10552] | 6.1 | [198] | 3.61 | ||||
| 306 | 4.0 | 57 | 5609 | 8 | 5.4 | 8.9 | 257 | 176 | 7.89 | 0.96 |
| 311 | 4.8 | 19 | 9190 | 15 | 4.4 | 3.7 | 310 | 261 | 1.37 | 0.55 |
| 333 | -1.8 | 37 | 4811 | 7 | 5.1 | 2.6 | 117 | 111 | 1.15 | 0.66 |
| 359 | 2.7 | 38 | [5043] | 4.5 | [162] | 2.19 | ||||
| 373 | 53 | 5903 | 26 | 5.1 | 3.1 | 229 | 121 | 1.91 | 0.78 | |
| 374 | 2.7 | 69 | 12780 | 8 | 15.5 | 6.9 | 121 | 74 | 8.54 | 1.94 |
| 382 | 4.6 | 25 | 10099 | 16 | 5.1 | 3.2 | 189 | 149 | 1.15 | 0.59 |
| 412 | 7.5 | 71 | 4479 | 6 | 4.9 | 7.4 | 166 | 127 | 4.09 | 0.73 |
| 414 | 1.7 | 57 | 11350 | 7 | 4.0 | 4.7 | 461 | 443 | 2.36 | 0.62 |
| 445 | 4.2 | 61 | [4600] | 6.4 | [182] | 3.49 | ||||
| 455 | 9.7 | 61 | 10175 | 37 | 4.7 | 2.9 | 375 | 180 | 1.75 | 0.74 |
| 474 | 38 | [10732] | 2.6 | [222] | 1.71 | |||||
| 551 | 3.6 | 44 | [15061] | 17.8 | [228] | 12.20 | ||||
| 552 | -0.3 | 32 | 4349 | 8 | 17.2 | 7.3 | 299 | 237 | 23.81 | 3.32 |
| 558 | -1.3 | 43 | [3957] | 14.4 | [160] | 6.92 | ||||
| 592 | 3.1 | 52 | 7716 | 5 | 9.0 | 5.1 | 181 | 167 | 5.73 | 1.39 |
| 596 | 4.2 | 32 | 11594 | 20 | 12.9 | 5.6 | 432 | 222 | 12.19 | 2.35 |
| 607 | 1.1 | 81 | 2663 | 16 | 3.8 | 4.4 | 133 | 51 | 0.74 | 0.35 |
| 618 | 3.0 | 44 | 10684 | 20 | 4.0 | 4.3 | 308 | 192 | 2.84 | 0.71 |
| 623 | 3.8 | 49 | 12617 | 10 | 3.6 | 5.7 | 128 | 74 | 1.04 | 0.37 |
| 626 | 0.3 | 5 | 3933 | 7 | 5.7 | 4.7 | 66 | 47 | 1.02 | 0.49 |
| 661 | 4.8 | 58 | [10606] | 11.1 | [261] | 8.70 | ||||
| 665 | 5.5 | 57 | 7630 | 17 | 6.7 | 3.3 | 228 | 174 | 2.18 | 0.92 |
| 688 | 2.0 | 49 | 11539 | 10 | 4.2 | 6.7 | 260 | 190 | 4.63 | 0.74 |
| 712 | 3.6 | 63 | 4565 | 12 | 7.7 | 7.4 | 323 | 202 | 9.25 | 1.38 |
| 718 | 5.4 | 26 | 8517 | 14 | 4.6 | 4.3 | 241 | 182 | 2.09 | 0.67 |
| 721 | 4.9 | 38 | 9621 | 16 | 3.2 | 5.7 | 243 | 96 | 1.26 | 0.37 |
| 731 | -1.3 | 49 | 1453 | 10 | 3.9 | 4.1 | 212 | 183 | 2.32 | 0.63 |
| 766 | 1.0 | 39 | [3819] | 4.6 | [94] | 1.28 | ||||
| 785 | 1.3 | 42 | 14750 | 23 | 4.8 | 2.9 | 307 | 235 | 1.42 | 0.68 |
| 804 | 4.9 | 33 | 5365 | 16 | 3.7 | 4.3 | 253 | 179 | 1.89 | 0.58 |
| 827 | 4.1 | 74 | 5464 | 8 | 7.3 | 7.7 | 346 | 282 | 11.64 | 1.47 |
| 834 | 2.0 | 27 | 10802 | 20 | 6.4 | 5.2 | 377 | 204 | 3.88 | 0.96 |
| 851 | 1.7 | 18 | 10665 | 13 | 3.8 | 4.1 | 197 | 153 | 0.90 | 0.39 |
| 860 | 3.4 | 62 | 6868 | 10 | 4.1 | 4.6 | 140 | 104 | 1.50 | 0.52 |
| 861 | 4.9 | 21 | 4398 | 14 | 4.7 | 5.0 | 217 | 146 | 2.64 | 0.69 |
| 874 | 3.4 | 48 | 4080 | 7 | 4.7 | 7.2 | 168 | 127 | 4.01 | 0.72 |
| 881 | 5.5 | 49 | 8682 | 13 | 6.4 | 4.7 | 226 | 164 | 3.40 | 0.96 |
| 898 | 3.1 | 54 | 5072 | 13 | 4.2 | 4.0 | 296 | 256 | 1.94 | 0.63 |
| 899 | 3.8 | 27 | 5525 | 13 | 8.2 | 4.8 | 170 | 108 | 4.28 | 1.19 |
| 905 | -1.8 | 53 | 4703 | 5 | 12.9 | 7.8 | 135 | 110 | 9.87 | 1.78 |
| 910 | 1.1 | 38 | 4910 | 16 | 5.6 | 3.5 | 282 | 232 | 1.95 | 0.78 |
| 912 | 0.1 | 63 | [4845] | 15.6 | [238] | 11.13 | ||||
| 922 | 4.9 | 6574 | 10 | 8.2 | 5.4 | 145 | 95 | 3.18 | 0.99 | |
| 928 | -0.9 | 40 | 7250 | 13 | 4.7 | 5.9 | 145 | 57 | 1.73 | 0.51 |
| 929 | 3.4 | 49 | 5259 | 16 | 5.3 | 4.3 | 296 | 223 | 4.43 | 1.04 |
| 936 | 3.1 | 73 | [9059] | 14.8 | [343] | 15.21 | ||||
| 937 | 5.3 | 28 | 8846 | 16 | 5.6 | 5.7 | 205 | 68 | 2.39 | 0.68 |
| 943 | 3.9 | 61 | 5186 | 19 | 3.9 | 4.5 | 245 | 128 | 1.80 | 0.56 |
| Mrk | t | incl | rms | SNR | ||||||
|---|---|---|---|---|---|---|---|---|---|---|
| [deg] | [km s-1] | [km s-1] | [mJy] | [km s-1] | [km s-1] | [Jy km s-1] | [Jy km s-1] | |||
| (1) | (2) | (3) | (4) | (5) | (6) | (7) | (8) | (9) | (10) | (11) |
| 955 | 4.2 | 61 | 10490 | 26 | 6.2 | 3.0 | 246 | 149 | 1.47 | 0.78 |
| 966 | 0.4 | 47 | 5335 | 16 | 5.5 | 2.3 | 156 | 133 | 0.75 | 0.60 |
| 968 | 4.0 | 24 | 4553 | 5 | 10.7 | 8.0 | 170 | 137 | 11.01 | 1.67 |
| 997 | 4.2 | 63 | 5795 | 5 | 6.3 | 11.7 | 320 | 243 | 14.53 | 1.23 |
| 1026 | 2.0 | 45 | 3994 | 8 | 8.3 | 8.2 | 271 | 205 | 12.87 | 1.59 |
| 1039 | 5.0 | 75 | 2111 | 5 | 6.7 | 8.3 | 161 | 134 | 6.16 | 0.97 |
| 1043 | 0.2 | 48 | 2435 | 13 | 4.0 | 4.0 | 172 | 133 | 1.86 | 0.60 |
| 1058 | 4.8 | 66 | [5138] | 4.8 | [215] | 3.07 | ||||
| 1064 | -1.9 | 39 | 4644 | 5 | 6.9 | 12.7 | 173 | 101 | 9.34 | 1.00 |
| 1066 | -1.2 | 68 | 3605 | 30 | 3.9 | 3.5 | 280 | 104 | 1.11 | 0.53 |
| 1076 | 4.0 | 67 | [7232] | 4.1 | [229] | 2.84 | ||||
| 1081 | 1.7 | 20 | 5327 | 10 | 5.0 | 6.4 | 284 | 222 | 5.76 | 0.94 |
| 1085 | 4.2 | 59 | 5127 | 16 | 5.6 | 6.0 | 354 | 217 | 5.22 | 0.97 |
| 1086 | 2.7 | 42 | 9043 | 13 | 5.2 | 5.6 | 287 | 208 | 4.30 | 0.89 |
| 1092 | 3.1 | 76 | 3356 | 3 | 5.9 | 14.7 | 338 | 311 | 19.90 | 1.22 |
| 1104 | 2.1 | 27 | 1991 | 37 | 11.0 | 1.4 | 155 | 109 | 16.85 | 4.99 |
| 1116 | 4.9 | 37 | 7823 | 16 | 11.9 | 3.0 | 283 | 246 | 2.68 | 1.43 |
| 1149 | 5.0 | 63 | 6292 | 5 | 4.4 | 5.8 | 276 | 262 | 4.29 | 0.79 |
| 1180 | 46 | [4534] | 6.0 | [213] | 3.82 | |||||
| 1197 | 4.2 | 57 | 4958 | 18 | 3.4 | 3.5 | 298 | 235 | 2.11 | 0.64 |
| 1198 | 3.5 | 69 | 7635 | 10 | 8.4 | 4.9 | 509 | 466 | 9.63 | 1.79 |
| 1199 | 2.7 | 43 | 4085 | 17 | 6.2 | 4.9 | 171 | 60 | 1.78 | 0.67 |
| 1200 | 2.7 | 26 | 7788 | 8 | 4.3 | 6.2 | 293 | 253 | 4.45 | 0.77 |
| 1270 | 5.0 | 44 | 8307 | 14 | 7.9 | 5.8 | 299 | 196 | 7.60 | 1.41 |
| 1273 | 55 | 8184 | 50 | 6.1 | 2.2 | 382 | 179 | 1.29 | 0.71 | |
| 1302 | 3.0 | 62 | 5588 | 2 | 5.5 | 14.8 | 108 | 92 | 7.00 | 0.71 |
| 1337 | 2.1 | 54 | 2556 | 5 | 5.8 | 8.0 | 251 | 231 | 7.91 | 1.05 |
| 1344 | -2.0 | 31 | 3170 | 7 | 7.2 | 9.5 | 182 | 101 | 6.44 | 0.97 |
| 1356 | 1.7 | 45 | 11872 | 25 | 6.4 | 2.8 | 157 | 83 | 0.80 | 0.60 |
| 1361 | 25 | [6768] | 6.2 | [185] | 3.44 | |||||
| 1363 | 1.1 | 34 | 2743 | 3 | 6.8 | 9.9 | 206 | 197 | 9.46 | 1.09 |
| 1403 | 4.8 | 53 | 8693 | 11 | 5.4 | 5.1 | 191 | 144 | 2.54 | 0.73 |
| 1404 | 4.8 | 27 | [10687] | 9.4 | [168] | 4.75 | ||||
| 1425 | 4.5 | 61 | 7480 | 7 | 5.0 | 5.1 | 280 | 258 | 5.25 | 1.00 |
| 1452 | 4.9 | 41 | 6680 | 12 | 5.6 | 5.5 | 200 | 131 | 4.18 | 0.92 |
| UA 304 | 90 | 2176 | 8 | 5.7 | 12.7 | 245 | 66 | 3.94 | 0.59 |
| Mrk | Bar | Spe | incl. | O/H | |||||||||||
|---|---|---|---|---|---|---|---|---|---|---|---|---|---|---|---|
| [deg] | [0.1′] | [km s-1] | [Mpc] | [mag] | [] | [M⊙] | [L⊙] | [mag] | |||||||
| (1) | (2) | (3) | (4) | (5) | (6) | (7) | (8) | (9) | (10) | (11) | (12) | (13) | (14) | (15) | (16) |
| 1 | SB | sy2 | 3.1 | 56.8 | 0.871 | 0.051 | 2.122 | 0.029 | 65.9 | 11.17 | 0.11 | 9.57 | 0.24 | 10.12 | -19.73 |
| 2 | SB | stb | 0.6 | 27.2 | 0.850 | 0.051 | 2.251 | 0.232 | 75.7 | 10.64 | 1.61 | 9.47 | 0.30 | 10.64 | -20.75 |
| 4 | SB | stb | 6.0 | 63.2 | 1.283 | 0.042 | 2.111 | 0.045 | 73.9 | 10.41 | 9.58 | 0.30 | 10.30 | -20.81 | |
| 8 | SA | stb | 4.1 | 62.7 | 0.943 | 0.044 | 2.067 | 0.044 | 51.3 | 11.88 | 0.22 | 9.73 | 0.27 | 9.96 | -19.94 |
| 10 | SB | sy1 | 3.1 | 68.4 | 1.229 | 0.050 | 2.430 | 0.018 | 119.6 | 10.35 | 0.65 | 10.63 | 0.10 | 10.34 | -22.69 |
| 12 | SA | stb | 5.0 | 38.0 | 1.056 | 0.052 | 2.245 | 0.088 | 56.1 | 10.21 | 0.80 | 10.08 | 0.10 | 10.22 | -21.10 |
| 13 | SB | stb | 3.1 | 31.5 | 1.023 | 0.084 | 2.544 | 0.162 | 21.9 | 11.80 | 0.61 | 9.55 | 0.10 | 8.59 | -17.76 |
| 21 | SB | stb | 3.6 | 58.2 | 0.983 | 0.054 | 2.196 | 0.096 | 115.4 | 11.11 | 1.03 | 9.63 | 0.58 | 10.07 | -21.04 |
| 31 | SB | stb | 2.5 | 35.9 | 0.936 | 0.066 | 2.146 | 0.136 | 107.1 | 11.25 | 1.70 | 9.76 | 0.10 | 10.01 | -20.23 |
| 38 | SB | stb | 3.4 | 70.2 | 0.856 | 0.056 | 2.058 | 0.204 | 147.2 | 12.25 | 0.59 | 9.94 | 0.48 | -20.93 | |
| 52 | SB | stb | -0.7 | 63.5 | 1.327 | 0.046 | 1.734 | 0.058 | 29.0 | 9.78 | 0.78 | 9.00 | 0.24 | 9.72 | -19.37 |
| 54 | SA | stb | 5.1 | 68.9 | 0.881 | 0.063 | 2.029 | 0.125 | 181.3 | 12.84 | 0.25 | 10.10 | 0.41 | 10.68 | -21.83 |
| 58 | SB | stb | 1.3 | 31.0 | 0.761 | 0.048 | 2.471 | 0.112 | 74.0 | 12.28 | 0.97 | 8.69 | 0.30 | 9.48 | -19.36 |
| 79 | SB | sy2 | 3.0 | 28.2 | 1.142 | 0.052 | 2.256 | 0.208 | 91.0 | 9.80 | 9.90 | 0.08 | 10.24 | -21.48 | |
| 84 | SA | st? | 3.6 | 62.2 | 1.001 | 0.073 | 2.119 | 0.120 | 84.1 | 11.14 | 9.86 | 0.23 | 10.18 | -21.25 | |
| 86 | SB | stb | 8.4 | 35.0 | 1.512 | 0.293 | 1.874 | 0.280 | 6.9 | 9.46 | 0.36 | 8.65 | 0.12 | 8.66 | -17.36 |
| 87 | SB | stb | 1.0 | 47.5 | 1.118 | 0.084 | 2.154 | 0.049 | 51.1 | 9.78 | 0.38 | 9.87 | 0.30 | 9.79 | -20.12 |
| 90 | SB | stb | 3.8 | 29.4 | 0.889 | 0.075 | 2.390 | 0.044 | 59.3 | 10.64 | 9.36 | 0.28 | 9.74 | -20.32 | |
| 101 | SA | stb | 4.6 | 17.6 | 0.880 | 0.097 | 2.174 | 0.545 | 66.0 | 10.94 | 0.51 | 9.69 | 0.30 | 9.87 | -20.42 |
| 109 | SB | stb | 8.0 | 49.7 | 0.529 | 0.041 | 2.256 | 0.032 | 123.7 | 12.97 | 0.51 | 10.43 | 0.14 | 10.16 | -19.36 |
| 114 | SB | stb | 3.1 | 28.7 | 1.182 | 0.046 | 2.326 | 0.167 | 103.4 | 10.80 | 0.43 | 10.30 | 0.10 | 10.42 | -20.61 |
| 133 | SB | stb | 4.0 | 12.3 | 1.054 | 0.045 | 2.499 | 1.256 | 31.2 | 9.94 | 1.74 | 9.22 | 0.12 | 9.66 | -19.30 |
| 158 | SA | stb | 1.0 | 67.7 | 1.232 | 0.045 | 2.021 | 0.018 | 31.7 | 9.59 | 9.02 | 0.08 | 10.07 | -19.77 | |
| 161 | SB | stb | 4.1 | 52.6 | 0.883 | 0.071 | 1.861 | 0.103 | 82.5 | 10.75 | 0.74 | 9.99 | 0.30 | 10.39 | -21.14 |
| 179 | SB | stb | 5.3 | 35.9 | 1.163 | 0.072 | 2.110 | 0.081 | 47.7 | 10.09 | 1.44 | 9.36 | 0.14 | 9.59 | -19.98 |
| 185 | SB | stb | 5.9 | 42.6 | 1.353 | 0.042 | 2.270 | 0.061 | 44.2 | 9.70 | 9.95 | 0.13 | 9.91 | -20.80 | |
| 188 | SB | stb | 5.3 | 39.7 | 1.264 | 0.056 | 2.280 | 0.095 | 35.3 | 9.25 | 2.76 | 9.70 | 0.10 | 10.01 | -20.43 |
| 201 | SA | stb | 9.8 | 60.1 | 1.261 | 0.071 | 1.766 | 0.093 | 36.7 | 9.63 | 0.44 | 9.33 | 0.30 | 10.59 | -20.48 |
| 207 | SA | st? | 1.0 | 42.6 | 1.116 | 0.053 | 1.908 | 0.158 | 36.8 | 10.38 | 9.19 | 0.27 | 9.67 | -19.70 | |
| 213 | SB | stb | 1.1 | 49.2 | 1.210 | 0.052 | 2.294 | 0.059 | 45.0 | 9.75 | 0.37 | 9.40 | 0.33 | 10.07 | -20.55 |
| 236 | SA | sy1 | 2.7 | 47.0 | 0.819 | 0.055 | 2.130 | 0.117 | 210.0 | 11.84 | 10.58 | 0.35 | 10.20 | -21.10 | |
| 237 | SA | stb | 3.4 | 38.4 | 0.732 | 0.082 | 2.129 | 0.080 | 123.8 | 12.01 | 0.61 | 9.89 | 0.33 | 10.53 | -19.84 |
| 238 | SA | stb | 4.9 | 26.6 | 0.933 | 0.046 | 2.315 | 0.125 | 201.7 | 11.52 | 0.84 | 10.26 | 0.44 | 10.92 | -21.79 |
| 256 | SA | st? | 5.0 | 42.1 | 1.050 | 0.066 | 2.164 | 0.080 | 45.6 | 11.01 | 9.64 | 0.18 | 9.97 | -20.07 | |
| 262 | SB | stb | 71.3 | 0.620 | 0.050 | 1.937 | 0.241 | 123.8 | 13.15 | 0.41 | 9.95 | 0.45 | -18.88 | ||
| 271 | SB | stb | 3.1 | 41.5 | 0.906 | 0.048 | 2.339 | 0.088 | 104.3 | 10.29 | 0.47 | 9.79 | 0.31 | 10.49 | -21.21 |
| 281 | SB | stb | 3.1 | 40.0 | 1.422 | 0.057 | 2.366 | 0.081 | 32.9 | 8.72 | 9.75 | 0.35 | 10.00 | -20.64 | |
| 286 | SA | stb | 4.2 | 30.3 | 0.951 | 0.044 | 2.355 | 0.156 | 105.1 | 10.58 | 0.44 | 10.29 | 0.10 | 10.84 | -21.39 |
| 297 | SA | stb | 5.0 | 41.9 | 0.932 | 0.059 | 2.481 | 0.084 | 65.2 | 0.56 | 9.93 | 0.29 | 10.62 | -21.34 | |
| 300 | SB | stb | -0.1 | 59.5 | 0.847 | 0.102 | 2.006 | 0.042 | 159.9 | 11.36 | 0.74 | 9.86 | 0.30 | 10.45 | -21.27 |
| 306 | SB | stb | 4.0 | 56.6 | 1.045 | 0.043 | 2.106 | 0.052 | 76.2 | 12.06 | 0.63 | 10.03 | 0.12 | 10.04 | -20.24 |
| 307 | SB | stb | 4.6 | 35.0 | 1.068 | 0.047 | 2.004 | 0.088 | 75.6 | 10.46 | 1.00 | 9.82 | 0.18 | 10.26 | -21.19 |
| 308 | SA | stb | 0.0 | 52.7 | 0.858 | 0.090 | 2.345 | 0.047 | 96.5 | 11.58 | 0.19 | 9.94 | 0.28 | 10.46 | -20.39 |
| 311 | SB | st? | 4.8 | 19.0 | 0.641 | 0.114 | 2.636 | 0.029 | 123.5 | 11.25 | 9.69 | 0.40 | 10.65 | -20.91 | |
| 313 | SB | sy2 | -1.9 | 61.9 | 1.092 | 0.074 | 1.914 | 0.073 | 27.3 | 9.54 | 9.55 | 0.38 | 9.55 | -19.18 | |
| 318 | SA | sy? | 3.8 | 37.1 | 0.910 | 0.038 | 2.218 | 0.097 | 60.0 | 10.92 | 9.74 | 0.25 | 9.94 | -20.14 | |
| 319 | SB | stb | 1.1 | 53.4 | 1.099 | 0.076 | 2.053 | 0.057 | 109.3 | 10.63 | 0.44 | 9.98 | 0.22 | 10.88 | -21.67 |
| 321 | SA | sy? | 5.9 | 15.3 | 1.046 | 0.063 | 2.632 | 0.467 | 129.3 | 10.32 | 10.51 | 0.21 | 10.88 | -22.27 | |
| 323 | SB | stb | 5.9 | 47.0 | 1.097 | 0.079 | 2.275 | 0.042 | 58.6 | 9.88 | 9.48 | 0.20 | 10.29 | -21.01 | |
| 325 | SA | st? | 4.9 | 43.4 | 1.142 | 0.096 | 1.972 | 0.209 | 46.8 | 10.73 | 0.38 | 9.65 | 0.23 | 10.19 | -20.33 |
| 326 | SB | stb | 4.0 | 55.7 | 1.191 | 0.075 | 2.166 | 0.044 | 48.8 | 10.26 | 1.83 | 9.76 | 0.24 | 10.12 | -20.04 |
| 331 | SA | st? | 1.0 | 48.6 | 0.957 | 0.063 | 2.099 | 0.050 | 73.7 | 9.88 | 9.98 | 0.21 | 11.08 | -20.21 | |
| 332 | SB | stb | 4.2 | 24.3 | 1.165 | 0.050 | 1.935 | 0.223 | 33.2 | 9.37 | 0.81 | 9.05 | 0.13 | 9.94 | -20.14 |
| 339 | SB | stb | 21.5 | 0.962 | 0.085 | 2.286 | 0.039 | 71.0 | 11.74 | 9.73 | 0.30 | 9.68 | -20.13 | ||
| 353 | SB | stb | 2.2 | 65.0 | 0.950 | 0.046 | 1.927 | 0.030 | 63.2 | 10.31 | 0.55 | 9.32 | 0.28 | 10.35 | -19.88 |
| 358 | SB | sy1 | 4.0 | 42.2 | 0.896 | 0.081 | 2.396 | 0.051 | 182.1 | 11.27 | 10.16 | 0.24 | 10.37 | -21.51 | |
| 359 | SB | sy1 | 2.7 | 38.0 | 0.889 | 0.068 | 1.933 | 0.114 | 68.3 | 10.46 | 0.30 | 8.85 | 0.30 | 9.91 | -20.43 |
| 363 | SA | stb | -2.0 | 36.5 | 0.793 | 0.115 | 2.063 | 0.074 | 40.1 | 10.93 | 0.41 | 9.39 | 0.32 | 9.75 | -19.23 |
| 373 | SB | stb | 53.1 | 0.890 | 0.050 | 2.026 | 0.204 | 81.3 | 11.29 | 0.64 | 9.47 | 0.41 | 10.23 | -19.77 | |
| 374 | SB | sy1 | 2.7 | 69.1 | 0.824 | 0.127 | 1.673 | 0.142 | 176.8 | 11.11 | 10.80 | 0.23 | -22.38 | ||
| 382 | SB | sy1 | 4.6 | 25.3 | 0.836 | 0.078 | 2.285 | 0.069 | 137.0 | 11.47 | 9.71 | 0.51 | 9.91 | -20.42 | |
| 384 | SB | stb | 3.0 | 54.8 | 1.151 | 0.042 | 2.283 | 0.032 | 63.4 | 9.82 | 9.29 | 0.19 | 10.38 | -20.82 | |
| 386 | SB | stb | 3.8 | 67.2 | 1.275 | 0.047 | 2.337 | 0.027 | 48.5 | 9.39 | 9.90 | 0.19 | 9.51 | -20.84 | |
| 389 | SA | st? | 1.0 | 29.2 | 1.276 | 0.070 | 2.408 | 0.158 | 64.1 | 9.31 | 10.01 | 0.16 | 9.78 | -21.12 | |
| 391 | SA | stb | 1.1 | 53.3 | 1.091 | 0.065 | 2.230 | 0.060 | 55.0 | 10.27 | 9.39 | 0.25 | 9.86 | -20.25 | |
| 401 | SB | stb | 0.5 | 34.9 | 1.031 | 0.045 | 1.978 | 0.156 | 24.1 | 10.31 | 1.47 | 8.83 | 0.27 | 9.32 | -18.15 |
| 412 | SB | stb | 7.5 | 70.5 | 0.764 | 0.074 | 1.869 | 0.068 | 61.7 | 12.67 | 0.26 | 9.56 | 0.18 | 9.52 | -19.22 |
| 414 | SA | sy? | 1.7 | 57.1 | 0.805 | 0.060 | 2.424 | 0.022 | 153.9 | 11.50 | 10.12 | 0.26 | 10.39 | -21.30 | |
| 430 | SA | stb | 0.0 | 59.4 | 1.310 | 0.054 | 2.195 | 0.027 | 81.1 | 9.81 | 9.96 | 0.10 | 9.94 | -21.73 | |
| 432 | SA | stb | 9.9 | 90.0 | 1.223 | 0.096 | 2.146 | 0.030 | 47.0 | 10.74 | 0.56 | 10.30 | 0.15 | 10.09 | -20.26 |
| 446 | SB | stb | 3.1 | 40.8 | 1.148 | 0.083 | 1.948 | 0.132 | 97.0 | 10.35 | 0.80 | 9.92 | 0.17 | 10.31 | -21.40 |
| Mrk | Bar | Spe | incl. | O/H | |||||||||||
|---|---|---|---|---|---|---|---|---|---|---|---|---|---|---|---|
| [deg] | [0.1′] | [km s-1] | [Mpc] | [mag] | [] | [M⊙] | [L⊙] | [mag] | |||||||
| (1) | (2) | (3) | (4) | (5) | (6) | (7) | (8) | (9) | (10) | (11) | (12) | (13) | (14) | (15) | (16) |
| 455 | SA | st? | 9.7 | 61.4 | 0.733 | 0.138 | 2.201 | 0.194 | 138.9 | 12.36 | 9.90 | 0.42 | 10.66 | -20.70 | |
| 471 | SB | sy2 | 1.2 | 53.1 | 0.946 | 0.056 | 2.124 | 0.061 | 139.6 | 10.66 | 9.79 | 0.19 | 10.40 | -21.69 | |
| 479 | SA | stb | 3.9 | 60.8 | 1.013 | 0.062 | 2.219 | 0.039 | 83.0 | 10.98 | 0.50 | 10.05 | 0.19 | 10.27 | -21.17 |
| 489 | SB | stb | 2.3 | 51.3 | 0.915 | 0.092 | 1.991 | 0.058 | 130.9 | 11.30 | 0.57 | 10.58 | 0.10 | 10.74 | -21.55 |
| 493 | SB | sy1 | 3.1 | 42.1 | 1.000 | 0.073 | 1.220 | 0.166 | 128.9 | 10.98 | 9.81 | 0.21 | 10.23 | -20.93 | |
| 496 | SA | stb | 1.7 | 68.7 | 0.796 | 0.223 | 2.150 | 0.022 | 121.8 | 11.02 | 0.45 | 10.07 | 0.30 | 11.14 | -21.66 |
| 527 | SB | stb | 1.1 | 56.9 | 1.153 | 0.083 | 1.541 | 0.105 | 47.6 | 10.07 | 9.22 | 0.12 | 10.17 | -19.90 | |
| 529 | SA | stb | -1.0 | 90.0 | 1.129 | 0.051 | 2.024 | 0.035 | 47.1 | 11.09 | 0.25 | 10.18 | 0.26 | 9.72 | -18.95 |
| 531 | SA | st? | -1.8 | 58.3 | 1.211 | 0.060 | 2.163 | 0.031 | 48.0 | 9.70 | 8.37 | 0.30 | 10.19 | -20.03 | |
| 533 | SB | sy2 | 3.9 | 24.1 | 0.997 | 0.141 | 2.621 | 0.202 | 117.3 | 9.79 | 10.35 | 0.20 | 11.03 | -21.92 | |
| 534 | SA | stb | -1.3 | 59.2 | 1.180 | 0.145 | 2.164 | 0.081 | 68.7 | 10.02 | 0.54 | 9.84 | 0.45 | 10.67 | -21.11 |
| 538 | SB | stb | 3.1 | 50.0 | 1.299 | 0.085 | 2.070 | 0.086 | 37.3 | 9.76 | 0.34 | 9.80 | 0.17 | 10.29 | -20.42 |
| 545 | SB | stb | 1.2 | 42.4 | 1.279 | 0.080 | 2.446 | 0.079 | 62.2 | 8.88 | 0.92 | 9.89 | 0.18 | 10.73 | -21.47 |
| 552 | SB | st? | -0.3 | 32.4 | 0.618 | 0.147 | 2.399 | 0.027 | 58.0 | 11.09 | 10.28 | 0.14 | 10.25 | -19.87 | |
| 554 | SA | sy? | -2.0 | 41.6 | 1.169 | 0.098 | 2.105 | 0.074 | 70.4 | 11.06 | 9.73 | 0.30 | 9.70 | -20.09 | |
| 555 | SA | stb | 3.2 | 29.2 | 1.106 | 0.057 | 2.141 | 0.237 | 53.7 | 9.66 | 9.66 | 0.30 | 10.29 | -21.22 | |
| 565 | SA | sy? | -2.0 | 43.2 | 1.316 | 0.053 | 2.352 | 0.079 | 72.5 | 9.75 | 9.22 | 0.30 | 10.19 | -21.54 | |
| 571 | SB | stb | 3.4 | 50.4 | 1.216 | 0.081 | 2.342 | 0.047 | 68.1 | 10.41 | 1.80 | 9.80 | 0.30 | 10.03 | -20.48 |
| 572 | SA | st? | 7.9 | 83.0 | 1.079 | 0.057 | 2.299 | 0.034 | 65.4 | 10.47 | 9.09 | 0.34 | 10.17 | -20.21 | |
| 575 | SB | stb | 1.0 | 32.4 | 0.991 | 0.051 | 2.077 | 0.121 | 73.3 | 10.25 | 0.82 | 9.69 | 0.21 | 10.39 | -20.48 |
| 592 | SB | stb | 3.1 | 52.0 | 0.994 | 0.142 | 2.022 | 0.040 | 102.3 | 11.52 | 10.15 | 0.24 | 10.36 | -20.47 | |
| 593 | SB | stb | 5.3 | 24.6 | 1.113 | 0.042 | 2.363 | 0.230 | 110.1 | 10.15 | 10.22 | 0.17 | 10.30 | -21.50 | |
| 596 | SA | sy2 | 4.2 | 31.8 | 0.932 | 0.115 | 2.495 | 0.053 | 142.6 | 10.89 | 10.74 | 0.19 | 10.44 | -21.70 | |
| 602 | SB | stb | 4.0 | 34.0 | 1.102 | 0.080 | 2.294 | 0.157 | 37.2 | 10.11 | 1.34 | 9.70 | 0.24 | 9.86 | -19.52 |
| 607 | SA | sy2 | 1.1 | 80.9 | 1.275 | 0.076 | 1.582 | 0.349 | 34.8 | 9.36 | 8.33 | 0.47 | 9.57 | -19.80 | |
| 617 | SB | stb | 4.9 | 35.0 | 1.174 | 0.073 | 62.0 | 9.55 | 0.69 | 9.53 | 0.30 | 11.20 | -21.34 | ||
| 618 | SB | sy1 | 3.0 | 43.9 | 0.964 | 0.076 | 2.255 | 0.093 | 137.8 | 10.45 | 0.81 | 10.10 | 0.25 | 10.87 | -22.44 |
| 620 | SB | sy2 | 1.0 | 52.4 | 1.488 | 0.074 | 2.323 | 0.057 | 27.3 | 8.48 | 0.16 | 9.30 | 0.07 | 9.84 | -20.16 |
| 623 | SA | sy? | 3.8 | 49.2 | 0.924 | 0.051 | 1.781 | 0.138 | 169.4 | 12.53 | 9.85 | 0.36 | 10.63 | -21.24 | |
| 626 | SA | sy? | 0.3 | 5.0 | 0.826 | 0.062 | 2.390 | 0.024 | 53.8 | 10.65 | 8.84 | 0.48 | 9.67 | -19.64 | |
| 665 | SB | stb | 5.5 | 57.2 | 0.998 | 0.118 | 2.069 | 0.121 | 108.3 | 11.26 | 0.41 | 9.78 | 0.42 | 10.16 | -21.13 |
| 685 | SA | st? | 2.8 | 63.3 | 0.816 | 0.043 | 1.783 | 0.071 | 62.1 | 12.73 | 0.22 | 9.66 | 0.34 | 9.65 | -18.96 |
| 686 | SB | sy2 | 1.7 | 58.9 | 1.084 | 0.110 | 2.292 | 0.046 | 59.3 | 9.67 | 0.12 | 9.17 | 0.30 | 9.63 | -20.34 |
| 688 | SA | st? | 2.0 | 49.5 | 0.733 | 0.085 | 2.168 | 0.057 | 144.7 | 12.04 | 0.64 | 10.36 | 0.16 | 10.30 | -20.69 |
| 691 | SB | stb | 5.1 | 59.4 | 1.208 | 0.043 | 1.954 | 0.044 | 46.2 | 10.42 | 1.50 | 9.91 | 0.22 | 10.12 | -20.72 |
| 701 | SA | 1.1 | 39.3 | 1.063 | 0.051 | 2.134 | 0.141 | 70.7 | 11.24 | 9.57 | 0.10 | 9.99 | -19.75 | ||
| 703 | SB | stb | 2.1 | 40.6 | 1.310 | 0.061 | 1.890 | 0.158 | 51.0 | 9.51 | 10.01 | 0.11 | 10.19 | -20.57 | |
| 708 | SB | stb | 4.1 | 74.4 | 1.341 | 0.039 | 2.052 | 0.015 | 27.1 | 9.68 | 1.48 | 9.15 | 0.30 | 9.76 | -18.95 |
| 710 | SB | stb | 2.5 | 55.4 | 1.341 | 0.032 | 2.030 | 0.034 | 20.2 | 9.96 | 1.24 | 9.13 | 0.12 | 9.20 | -18.21 |
| 712 | SB | stb | 3.6 | 62.9 | 1.036 | 0.070 | 2.169 | 0.068 | 61.9 | 11.82 | 0.35 | 9.92 | 0.15 | 9.71 | -20.70 |
| 718 | SA | stb | 5.4 | 26.2 | 0.795 | 0.051 | 2.374 | 0.049 | 112.1 | 10.58 | 2.33 | 9.79 | 0.32 | 10.46 | -20.67 |
| 721 | SA | stb | 4.9 | 38.0 | 0.720 | 0.053 | 2.112 | 0.103 | 128.6 | 11.97 | 1.40 | 9.69 | 0.29 | 10.24 | -20.39 |
| 731 | SB | stb | -1.3 | 49.3 | 1.317 | 0.073 | 2.102 | 0.066 | 19.4 | 9.70 | 1.94 | 8.31 | 0.27 | 9.21 | -17.79 |
| 739 | SA | sy1 | 3.8 | 33.7 | 0.789 | 0.080 | 2.429 | 0.187 | 120.3 | 10.45 | 0.57 | 9.41 | 0.30 | 10.49 | -21.17 |
| 752 | SB | stb | 4.1 | 37.1 | 0.971 | 0.056 | 2.017 | 0.083 | 82.0 | 11.70 | 0.44 | 9.86 | 0.23 | 9.90 | -20.38 |
| 759 | SB | stb | 5.2 | 40.0 | 1.271 | 0.128 | 2.173 | 0.057 | 30.2 | 9.63 | 9.70 | 0.20 | 9.81 | -19.94 | |
| 769 | SA | stb | 1.0 | 65.7 | 1.302 | 0.077 | 1.999 | 0.025 | 24.2 | 9.49 | 0.30 | 9.72 | 0.33 | 9.85 | -19.80 |
| 781 | SB | stb | 4.6 | 41.6 | 1.305 | 0.059 | 2.161 | 0.078 | 38.9 | 9.87 | 0.49 | 9.51 | 0.20 | 9.68 | -20.15 |
| 785 | SA | 1.3 | 42.2 | 0.628 | 0.094 | 2.304 | 0.095 | 198.8 | 11.64 | 10.12 | 0.48 | 10.72 | -22.25 | ||
| 799 | SB | stb | 3.1 | 51.6 | 1.337 | 0.043 | 2.290 | 0.044 | 43.2 | 8.98 | 2.27 | 9.59 | 0.18 | 10.48 | -20.86 |
| 804 | SB | stb | 4.9 | 33.4 | 0.813 | 0.073 | 2.291 | 0.068 | 73.1 | 13.04 | 0.31 | 9.38 | 0.31 | 9.76 | -19.97 |
| 809 | SA | stb | 5.3 | 59.5 | 0.982 | 0.126 | 1.795 | 0.037 | 104.0 | 9.96 | 0.30 | 10.48 | -20.57 | ||
| 814 | SB | stb | 3.2 | 56.9 | 1.018 | 0.288 | 2.279 | 0.076 | 54.7 | 10.38 | 0.38 | 9.76 | 0.19 | 9.84 | -18.75 |
| 827 | SA | st? | 4.1 | 74.0 | 1.042 | 0.040 | 2.210 | 0.041 | 75.9 | 11.21 | 10.20 | 0.13 | 10.01 | -20.57 | |
| 834 | SA | st? | 2.0 | 27.3 | 1.021 | 0.086 | 2.508 | 0.052 | 147.4 | 10.50 | 10.30 | 0.25 | 10.94 | -21.81 | |
| 839 | SA | st? | 1.7 | 48.2 | 1.232 | 0.116 | 1.851 | 0.104 | 55.6 | 10.50 | 9.79 | 0.40 | 10.36 | -21.12 | |
| 851 | SA | sy? | 1.7 | 18.1 | 0.969 | 0.050 | 2.438 | 0.040 | 144.7 | 11.82 | 9.65 | 0.43 | 10.46 | -20.90 | |
| 853 | SA | st? | 4.9 | 0.0 | 0.954 | 0.107 | 84.4 | 11.62 | 9.76 | 0.30 | 10.08 | -20.62 | |||
| 860 | SB | stb | 3.4 | 61.8 | 0.645 | 0.165 | 1.811 | 0.129 | 94.3 | 0.25 | 9.50 | 0.35 | 10.43 | -20.28 | |
| 861 | SB | stb | 4.9 | 20.8 | 0.756 | 0.118 | 2.393 | 0.047 | 60.9 | 10.63 | 9.36 | 0.26 | 9.85 | -19.91 | |
| 871 | SB | sy1 | 5.2 | 60.3 | 0.816 | 0.072 | 2.424 | 0.025 | 137.1 | 10.90 | 9.88 | 0.30 | 10.31 | -21.72 | |
| 874 | SB | stb | 3.4 | 48.4 | 0.745 | 0.057 | 1.977 | 0.062 | 59.0 | 13.20 | 0.34 | 9.52 | 0.18 | 9.33 | -18.69 |
| 881 | SA | st? | 5.5 | 48.6 | 0.624 | 0.094 | 2.102 | 0.086 | 118.9 | 11.80 | 1.75 | 10.05 | 0.28 | 10.52 | -20.71 |
| 898 | SB | stb | 3.1 | 54.1 | 0.987 | 0.059 | 2.224 | 0.065 | 69.1 | 10.89 | 1.78 | 9.34 | 0.32 | 9.78 | -19.66 |
| 899 | SA | sy? | 3.8 | 27.2 | 0.977 | 0.046 | 2.164 | 0.074 | 72.7 | 11.28 | 9.73 | 0.28 | 9.82 | -20.47 | |
| 905 | SA | st? | -1.8 | 53.5 | 1.071 | 0.056 | 1.855 | 0.058 | 65.3 | 10.07 | 10.00 | 0.18 | 9.95 | -20.06 | |
| 906 | SA | st? | -0.1 | 41.3 | 1.261 | 0.066 | 2.264 | 0.071 | 86.5 | 10.07 | 10.03 | 0.30 | 10.32 | -20.58 | |
| 907 | SA | st? | 7.7 | 78.8 | 1.289 | 0.125 | 1.891 | 0.032 | 18.1 | 10.25 | 0.54 | 8.81 | 0.16 | 9.16 | -19.54 |
| 908 | SA | sy? | 2.7 | 61.6 | 1.177 | 0.067 | 1.978 | 0.034 | 19.0 | 10.83 | 8.87 | 0.18 | 8.72 | -18.94 | |
| 910 | SA | st? | 1.1 | 38.4 | 0.916 | 0.140 | 2.313 | 0.065 | 65.2 | 10.39 | 9.29 | 0.40 | 9.90 | -20.38 | |
| 917 | SB | sy2 | 1.0 | 21.5 | 0.998 | 0.085 | 2.458 | 0.410 | 99.7 | 10.54 | 9.38 | 0.30 | 10.74 | -21.05 | |
| 922 | SA | st? | 4.9 | 0.0 | 0.659 | 0.165 | 78.4 | 11.32 | 9.66 | 0.31 | 9.98 | -20.30 | |||
| 928 | SA | sy2 | -0.9 | 40.0 | 1.133 | 0.122 | 1.823 | 0.163 | 97.2 | 10.75 | 9.59 | 0.29 | 11.01 | -20.93 | |
| 929 | SA | st? | 3.4 | 49.5 | 0.766 | 0.095 | 2.232 | 0.078 | 72.6 | 11.26 | 9.74 | 0.23 | 10.04 | -20.75 | |
| 937 | SA | sy2 | 5.3 | 27.5 | 0.826 | 0.048 | 2.105 | 0.105 | 118.0 | 11.19 | 9.89 | 0.28 | 10.15 | -21.06 | |
| 943 | SA | sy? | 3.9 | 60.8 | 0.693 | 0.128 | 2.017 | 0.152 | 69.1 | 11.78 | 9.31 | 0.31 | 9.82 | -19.67 | |
| Mrk | Bar | Spe | incl. | O/H | |||||||||||
|---|---|---|---|---|---|---|---|---|---|---|---|---|---|---|---|
| [deg] | [0.1′] | [km s-1] | [Mpc] | [mag] | [] | [M⊙] | [L⊙] | [mag] | |||||||
| (1) | (2) | (3) | (4) | (5) | (6) | (7) | (8) | (9) | (10) | (11) | (12) | (13) | (14) | (15) | (16) |
| 955 | SB | sy2 | 4.2 | 60.6 | 0.935 | 0.064 | 2.046 | 0.195 | 139.0 | 10.76 | 9.83 | 0.53 | 10.49 | -21.21 | |
| 958 | SA | 4.0 | 86.1 | 1.079 | 0.046 | 2.140 | 0.012 | 84.8 | 11.43 | 9.84 | 0.30 | 9.91 | -20.64 | ||
| 960 | SA | stb | -1.9 | 71.9 | 0.900 | 0.050 | 1.981 | 0.060 | 84.1 | 11.93 | 0.30 | 9.75 | 0.10 | 10.14 | -20.20 |
| 966 | SA | st? | 0.4 | 46.9 | 0.952 | 0.065 | 1.971 | 0.143 | 70.4 | 10.83 | 8.94 | 0.80 | 10.09 | -19.62 | |
| 968 | SB | stb | 4.0 | 24.1 | 1.094 | 0.048 | 2.256 | 0.023 | 58.8 | 10.17 | 9.96 | 0.15 | 9.65 | -20.47 | |
| 984 | SB | lin | 7.9 | 69.8 | 1.049 | 0.072 | 2.284 | 0.037 | 190.4 | 10.59 | 10.03 | 0.21 | 10.58 | -22.04 | |
| 987 | SA | st? | 4.6 | 65.9 | 1.131 | 0.077 | 2.281 | 0.024 | 66.5 | 10.39 | 9.08 | 0.30 | 10.15 | -20.80 | |
| 997 | SA | sy? | 4.2 | 63.3 | 1.024 | 0.040 | 2.197 | 0.026 | 76.3 | 11.22 | 10.30 | 0.08 | 10.09 | -20.41 | |
| 1002 | SA | stb | -1.5 | 38.6 | 1.078 | 0.117 | 2.183 | 0.088 | 41.9 | 10.10 | 0.73 | 9.21 | 0.23 | 10.07 | -19.47 |
| 1003 | SA | sy? | 2.7 | 53.1 | 0.911 | 0.074 | 1.946 | 0.046 | 48.4 | 10.90 | 8.97 | 0.30 | 9.36 | -19.56 | |
| 1009 | SB | stb | 3.1 | 63.0 | 1.297 | 0.188 | 2.264 | 0.038 | 56.8 | 10.25 | 0.78 | 9.86 | 0.19 | 9.82 | -20.85 |
| 1026 | SB | stb | 2.0 | 44.8 | 1.152 | 0.049 | 2.221 | 0.040 | 51.5 | 10.46 | 0.65 | 9.91 | 0.12 | 9.79 | -20.29 |
| 1027 | SA | stb | 8.8 | 45.6 | 0.844 | 0.099 | 2.457 | 0.056 | 120.6 | 0.59 | 10.03 | 0.26 | 11.05 | -20.73 | |
| 1039 | SA | stb | 5.0 | 75.2 | 1.181 | 0.069 | 1.860 | 0.057 | 26.4 | 11.84 | 0.18 | 9.01 | 0.16 | 9.12 | -18.64 |
| 1043 | SA | stb | 0.3 | 48.3 | 1.143 | 0.053 | 1.992 | 0.110 | 31.7 | 10.22 | 0.91 | 8.65 | 0.32 | 9.39 | -19.10 |
| 1050 | SB | stb | 1.1 | 67.5 | 1.085 | 0.073 | 2.099 | 0.047 | 67.0 | 10.12 | 9.59 | 0.11 | 10.52 | -20.54 | |
| 1063 | SA | stb | 9.1 | 70.6 | 1.265 | 0.046 | 1.977 | 0.032 | 18.5 | 10.51 | 0.27 | 9.53 | 0.29 | 9.18 | -19.09 |
| 1064 | SA | st? | -1.9 | 38.8 | 1.060 | 0.049 | 2.014 | 0.040 | 59.5 | 10.83 | 9.89 | 0.11 | 10.15 | -20.07 | |
| 1066 | SB | sy2 | -1.2 | 68.2 | 1.214 | 0.107 | 1.991 | 0.255 | 49.7 | 9.79 | 0.25 | 8.81 | 0.48 | 10.53 | -19.78 |
| 1067 | SB | stb | 1.7 | 40.2 | 1.152 | 0.058 | 2.356 | 0.064 | 57.5 | 9.87 | 9.66 | 0.10 | 10.07 | -19.98 | |
| 1068 | SA | 9.1 | 90.0 | 1.123 | 0.043 | 2.035 | 0.027 | 68.3 | 11.13 | 10.26 | 0.30 | 9.96 | -20.21 | ||
| 1073 | SB | sy2 | 3.1 | 32.8 | 1.047 | 0.049 | 2.474 | 0.134 | 94.9 | 10.11 | 0.62 | 9.60 | 0.30 | 11.01 | -21.16 |
| 1080 | SB | 8.2 | 90.0 | 1.560 | 0.092 | 1.879 | 0.031 | 10.2 | 10.37 | 9.32 | 0.06 | 8.43 | -19.03 | ||
| 1081 | SA | sy? | 1.7 | 20.4 | 0.976 | 0.047 | 2.563 | 0.023 | 70.3 | 10.64 | 9.83 | 0.16 | 9.89 | -20.35 | |
| 1085 | SA | st? | 4.2 | 59.2 | 1.058 | 0.045 | 2.224 | 0.080 | 65.2 | 10.45 | 9.72 | 0.19 | 9.89 | -20.89 | |
| 1086 | SB | stb | 2.7 | 42.1 | 0.953 | 0.045 | 2.264 | 0.059 | 113.2 | 11.58 | 0.79 | 10.11 | 0.21 | 10.21 | -20.49 |
| 1087 | SA | stb | -1.8 | 47.8 | 1.009 | 0.066 | 2.193 | 0.067 | 110.2 | 11.86 | 0.34 | 10.22 | 0.18 | 10.77 | -21.13 |
| 1088 | SB | stb | 0.1 | 20.7 | 1.244 | 0.041 | 2.654 | 0.361 | 60.4 | 9.20 | 1.38 | 9.43 | 0.22 | 10.53 | -21.63 |
| 1089 | SA | stb | 8.9 | 64.7 | 0.930 | 0.219 | 1.911 | 0.089 | 52.7 | 11.84 | 0.39 | 10.18 | 0.12 | 10.19 | -18.92 |
| 1092 | SB | st? | 3.1 | 75.6 | 1.244 | 0.078 | 2.215 | 0.015 | 43.0 | 10.31 | 9.94 | 0.06 | 9.32 | -21.20 | |
| 1093 | SA | stb | 1.1 | 47.5 | 1.076 | 0.123 | 2.362 | 0.082 | 57.9 | 10.19 | 2.05 | 9.93 | 0.30 | 10.63 | -20.06 |
| 1104 | SA | st? | 2.1 | 26.5 | 0.892 | 0.082 | 2.139 | 0.224 | 29.8 | 11.54 | 9.55 | 0.30 | 9.23 | -17.56 | |
| 1116 | SA | 4.9 | 36.8 | 0.968 | 0.103 | 2.333 | 0.062 | 109.2 | 10.56 | 9.88 | 0.53 | 10.96 | -21.36 | ||
| 1118 | SA | st? | 3.0 | 48.6 | 1.285 | 0.040 | 2.360 | 0.124 | 44.1 | 9.65 | 10.13 | 0.12 | 9.75 | -20.11 | |
| 1124 | SA | sy? | 4.8 | 39.0 | 1.134 | 0.038 | 2.091 | 0.058 | 66.4 | 11.10 | 10.00 | 0.12 | 9.58 | -20.32 | |
| 1127 | SA | stb | 3.0 | 75.8 | 1.196 | 0.041 | 2.324 | 0.012 | 101.9 | 10.49 | 0.06 | 10.13 | 0.30 | 10.24 | -21.19 |
| 1137 | SA | st? | 4.3 | 28.8 | 0.866 | 0.076 | 2.292 | 0.160 | 103.5 | 11.86 | 9.89 | 0.30 | 10.26 | -20.30 | |
| 1149 | SB | stb | 5.0 | 63.0 | 1.021 | 0.060 | 2.166 | 0.028 | 82.9 | 11.61 | 1.07 | 9.84 | 0.18 | 9.88 | -20.53 |
| 1157 | SB | sy2 | -0.1 | 38.5 | 1.165 | 0.064 | 2.086 | 0.095 | 62.3 | 10.06 | 9.37 | 0.28 | 10.05 | -20.33 | |
| 1171 | SA | stb | 5.3 | 49.1 | 1.214 | 0.057 | 1.667 | 0.115 | 70.5 | 9.68 | 2.40 | 9.98 | 0.11 | 10.29 | -21.12 |
| 1194 | SB | stb | -2.0 | 53.8 | 1.246 | 0.044 | 2.251 | 0.044 | 58.8 | 9.23 | 9.46 | 0.19 | 10.55 | -20.75 | |
| 1197 | SA | sy? | 4.2 | 57.5 | 0.799 | 0.049 | 2.197 | 0.095 | 66.7 | 10.84 | 9.34 | 0.30 | 9.91 | -19.63 | |
| 1198 | SA | sy? | 3.5 | 68.8 | 1.065 | 0.051 | 2.414 | 0.032 | 102.8 | 10.26 | 10.38 | 0.19 | 10.28 | -21.07 | |
| 1199 | SA | stb | 2.7 | 42.9 | 1.023 | 0.076 | 1.859 | 0.196 | 55.0 | 10.16 | 1.14 | 9.10 | 0.38 | 10.45 | -20.79 |
| 1200 | SB | stb | 2.7 | 26.4 | 0.962 | 0.107 | 2.486 | 0.022 | 104.7 | 10.35 | 10.06 | 0.17 | 10.39 | -20.85 | |
| 1225 | SA | sy? | 2.3 | 66.5 | 1.042 | 0.170 | 2.264 | 0.020 | 50.9 | 10.92 | 9.56 | 0.30 | 9.14 | -19.31 | |
| 1233 | SA | st? | 3.6 | 57.5 | 0.839 | 0.053 | 2.172 | 0.058 | 64.6 | 11.18 | 9.77 | 0.27 | 10.24 | -19.18 | |
| 1235 | SA | st? | 5.0 | 52.5 | 1.122 | 0.045 | 1.989 | 0.100 | 65.1 | 10.37 | 9.67 | 0.10 | 9.90 | -20.94 | |
| 1270 | SA | sy? | 5.0 | 43.8 | 1.086 | 0.050 | 2.250 | 0.066 | 110.7 | 11.70 | 10.34 | 0.19 | 10.24 | -20.84 | |
| 1273 | SB | stb | 0.0 | 54.9 | 0.851 | 0.061 | 2.234 | 0.243 | 110.1 | 11.37 | 9.57 | 0.55 | 10.13 | -20.33 | |
| 1291 | SB | sy2 | 3.9 | 33.2 | 1.436 | 0.039 | 2.367 | 0.097 | 48.5 | 9.52 | 10.09 | 0.10 | 9.89 | -21.14 | |
| 1302 | SB | stb | 3.0 | 62.5 | 1.003 | 0.055 | 1.710 | 0.032 | 74.7 | 10.94 | 0.90 | 9.96 | 0.10 | 9.68 | -19.54 |
| 1304 | SA | stb | 3.0 | 57.6 | 1.053 | 0.195 | 2.137 | 0.083 | 73.4 | 11.34 | 0.53 | 9.75 | 0.30 | 10.43 | -20.16 |
| 1326 | SB | stb | 5.9 | 28.9 | 1.217 | 0.031 | 2.114 | 0.107 | 19.4 | 10.96 | 1.68 | 8.64 | 0.20 | 8.85 | -18.56 |
| 1330 | SB | sy1 | 3.0 | 54.9 | 1.475 | 0.094 | 2.313 | 0.091 | 33.3 | 8.11 | 9.34 | 0.15 | 9.71 | -20.31 | |
| 1333 | SA | sy2 | 2.9 | 78.3 | 1.216 | 0.051 | 2.306 | 0.015 | 37.7 | 9.46 | 9.47 | 0.10 | 9.83 | -19.54 | |
| 1337 | SA | st? | 2.1 | 54.3 | 1.113 | 0.056 | 2.160 | 0.029 | 34.4 | 10.50 | 9.34 | 0.13 | 9.76 | -18.89 | |
| 1341 | SB | stb | 5.9 | 50.6 | 1.330 | 0.037 | 2.087 | 0.052 | 16.2 | 10.29 | 0.85 | 9.01 | 0.36 | 9.07 | -18.69 |
| 1344 | SB | stb | -2.0 | 30.8 | 0.978 | 0.050 | 2.116 | 0.045 | 42.2 | 10.37 | 0.28 | 9.44 | 0.15 | 9.80 | -18.72 |
| 1346 | SB | stb | 6.5 | 75.8 | 1.217 | 0.030 | 1.831 | 0.024 | 15.4 | 11.92 | 0.20 | 9.00 | 0.09 | 8.51 | -17.74 |
| 1356 | SA | 1.7 | 45.3 | 0.842 | 0.056 | 1.894 | 0.266 | 159.1 | 11.11 | 9.68 | 0.75 | 10.50 | -21.07 | ||
| 1363 | SB | stb | 1.1 | 34.3 | 1.278 | 0.049 | 2.236 | 0.015 | 36.7 | 9.70 | 9.48 | 0.12 | 9.46 | -20.38 | |
| 1365 | SB | stb | -2.0 | 44.8 | 0.985 | 0.107 | 2.101 | 0.109 | 75.5 | 10.32 | 0.42 | 9.27 | 0.30 | 10.50 | -19.71 |
| 1379 | SB | stb | 2.2 | 33.6 | 1.152 | 0.079 | 1.821 | 0.153 | 35.5 | 9.63 | 1.45 | 9.45 | 0.10 | 9.93 | -19.99 |
| 1381 | SA | st? | 4.0 | 75.1 | 1.030 | 0.047 | 2.281 | 0.012 | 109.5 | 11.62 | 9.91 | 0.21 | 10.24 | -20.49 | |
| 1403 | SA | sy1 | 4.8 | 53.4 | 0.740 | 0.045 | 2.006 | 0.091 | 112.8 | 12.44 | 9.88 | 0.29 | 10.12 | -19.86 | |
| 1425 | SA | st? | 4.5 | 60.5 | 0.964 | 0.067 | 2.176 | 0.039 | 101.6 | 10.85 | 10.11 | 0.19 | 10.24 | -20.77 | |
| 1452 | SB | stb | 4.9 | 40.9 | 0.796 | 0.072 | 2.087 | 0.082 | 92.1 | 11.54 | 1.07 | 9.92 | 0.22 | 9.85 | -19.85 |
| 1461 | SA | sy? | 3.5 | 52.2 | 0.751 | 0.071 | 1.985 | 0.040 | 86.8 | 12.56 | 9.38 | 0.27 | 9.90 | -19.96 | |
| 1466 | SB | stb | 5.0 | 47.5 | 1.613 | 0.065 | 2.127 | 0.073 | 18.2 | 8.79 | 1.48 | 9.67 | 0.13 | 9.48 | -19.55 |
| 1485 | SB | stb | 3.6 | 45.0 | 1.430 | 0.144 | 2.282 | 0.078 | 33.9 | 8.62 | 2.12 | 9.90 | 0.13 | 9.76 | -20.74 |