The 2dF Galaxy Redshift Survey: Clustering properties of radio galaxies
Abstract
The clustering properties of local, mJy, radio sources are investigated for a sample of 820 objects drawn from the joint use of the FIRST and 2dF Galaxy Redshift surveys. To this aim, we present 271 new spectroscopic counterparts of FIRST radio sources to be added to those already introduced in Magliocchetti et al. (2002). The two-point correlation function for the local radio population is found to be entirely consistent with estimates obtained for the whole sample of 2dFGRS galaxies. From measurements of the redshift-space correlation function we derive a redshift-space clustering length Mpc, while from the projected correlation function we estimate the parameters of the real-space correlation function , Mpc and , where is assumed. Different results are instead obtained if we only consider sources that present signatures of AGN activity in their spectra. These objects are shown to be very strongly correlated, with Mpc and , a steeper slope than has been claimed in other recent works. No difference is found in the clustering properties of radio-AGNs of different radio luminosity. Comparisons with models for show that AGN-fuelled sources reside in dark matter halos more massive than , higher the corresponding figure for radio-quiet QSOs. This value can be converted into a minimum black hole mass associated with radio-loud, AGN-fuelled objects of . The above results then suggest – at least for relatively faint radio objects – the existence of a threshold black hole mass associated with the onset of significant radio activity such as that of radio-loud AGNs; however, once the activity is triggered, there appears to be no evidence for a connection between black hole mass and level of radio output.
keywords:
galaxies: active – galaxies: starburst – galaxies: statistics, distances and redshifts – cosmology: observations – radio continuum galaxies1 Introduction
The last twenty years have shown radio sources to be extremely good probes of cosmological large-scale structure up to significant () redshifts. Clustering in radio catalogues was detected in early wide-area studies: Seldner & Peebles (1981) and Shaver & Pierre (1989) reported the detection of slight clustering of nearby radio sources, while Kooiman, Burns & Klypin (1995) and Loan, Wall & Lahav (1997) measured strong anisotropy in the distribution of bright radio objects from the 4.85 GHz Green Bank and Parkes-MIT-NRAO surveys. However, it was only few years ago that the latest generation of radio surveys such as FIRST (Faint Images of the Radio Sky at 20 cm; Becker, White & Helfand 1995), WENSS (Rengelink et al. 1998) and NVSS (NRAO VLA Sky Survey; Condon et al. 1998) included enough objects to allow for high-precision clustering measurements (Cress et al. 1996; Rengelink et al. 1998; Magliocchetti et al. 1998; Blake & Wall 2003; Overzier et al. 2003). All these recent analyses reveal the tendency for radio objects to be more strongly clustered than optically-selected galaxies.
Assessing the real clustering signal is nevertheless not an easy task when it comes to radio sources, since the lack of known redshifts for the overwhelming majority of these objects forces one to deal with projected quantities such as the angular two-point correlation function ; unfortunately, the relation between angular and spatial measurements is dependent on the radio source redshift distribution – which is highly uncertain at the mJy flux levels probed by these new surveys (see e.g. Dunlop & Peacock 1990; Magliocchetti et al. 1999) – and on the unknown redshift evolution of the radio clustering signal. This leads to estimates for the comoving correlation length (here we are assuming the spatial two-point correlation function to be described by the power-law ) which may span the relatively broad range Mpc even for angular measurements in good agreement with each other (Magliocchetti et al. 1998; Blake & Wall 2003; Overzier et al. 2003).
Since the natural solution to the above problem (redshift acquisition for all the objects included in a chosen catalogue) is out of reach with current instruments, a good starting point towards the understanding of the clustering properties of radio sources is the analysis of homogeneous subsamples of objects, bright enough in the visible band to allow for optical and spectroscopic follow-ups.
A first attempt in this direction was performed by Peacock & Nicholson (1991) who measured the redshift-space correlation function for a sample of 310 radio galaxies with and radio fluxes Jy at 1.4 GHz. These authors indeed found radio sources in their catalogue to be strongly clustered, with a redshift-space correlation length Mpc.
The present paper analyses the clustering properties of , , mJy radio galaxies drawn from the joint use of the FIRST and 2dF Galaxy Redshift surveys as illustrated in Magliocchetti et al. (2002). By doing this, we not only extend the Peacock & Nicholson (1991) measurements to a statistically more significant sample involving less local objects, but we also probe much lower flux densities where the population contains radio-emitting sources that differ from typical AGNs (such as galaxies undergoing intense star formation).
In addition to the above analysis, we will also estimate the two-point correlation function (both in redshift space and real space) for the homogeneous sample of radio AGNs (sources that present signatures of AGN activity in their optical spectra). This will enable us to use up-to-date models, which connect galaxy formation properties with clustering behaviour in order to investigate the nature of the dark matter halos in which these sources reside. By means of the same approach we can also obtain precious information on the nature of the black hole associated with a radio-active AGN to be compared with conclusions from other works.
For instance, Auriemma et al. (1977) found that radio emission is more common in brighter/more massive ellipticals. This result was recently confirmed e.g. by findings of Falomo et al. (2003), while authors such as Laor (2000), Lacy et al. (2001), McLure & Dunlop (2002), McLure & Jarvis (2002) and Dunlop et al. (2003) have investigated the connection between black hole mass and radio luminosity, coming to conclusions in disagreement with each other.
The layout of the paper is as follows. Section 2 introduces 271 new spectroscopic counterparts for local, mJy, radio sources, derived from the joint use of the FIRST and 2dF Galaxy Redshift (2dFGRS) surveys. Section 3.1 describes some of the properties of the total FIRST-2dFGRS sample, which puts together objects presented in Section 2 with those introduced in Magliocchetti et al. (2002), while Sections 3.2 and 3.3 are respectively devoted to the analysis of the redshift-space correlation function and of the projected correlation function both for the whole radio-2dFGRS sample and only for the 536 radio-AGNs. Section 4 compares the available data with models in order to derive the minimum dark matter mass of a halo able to host an AGN-fuelled radio source and gives some constraints on the minimum black hole mass of a radio-loud AGN. Finally, Section 5 summarizes our conclusions.
Unless stated otherwise, throughout this work we will assume , , and (with the rms density fluctuation within a sphere with a radius of Mpc), as the latest results from the joint analysis of CMB and 2dFGRS data seem to indicate (see e.g. Lahav et al., 2002; Spergel et al. 2003). To avoid confusion, we especially emphasise that distances will thus normally be quoted in Mpc, assuming . Units of Mpc will occur only rarely. This assumption is also made in all figures quoted for radio luminosities and black-hole masses. All the correlation lengths are in comoving units.
2 More Spectroscopic Counterparts for FIRST Radio Sources

The 2dFGRS (Colless et al. 2001, 2003) is a large-scale survey selected in the photometric band from the APM catalogue (Maddox et al. 1990a, 1990b, 1996) and its subsequent extensions (Maddox et al., in preparation). The final version includes 221,414 unique, reliable (i.e. with quality flags , Colless et al. 2001, 2003) galaxy redshifts to an extinction-corrected limit for completeness of (with small variations in magnitude limit as a function of position over the sky) over an area of 2151 square degrees. The survey geometry consists of two broad declination strips, a larger one in the SGP covering the area , and a smaller one set in the NGP with , , plus 100 random 2-degree fields spread uniformly over the 7000 square degrees of the APM catalogue in the southern Galactic hemisphere. The median redshift of the galaxies is 0.11 and the great majority have .
The completion of the 2dFGRS has allowed us to obtain 271 new spectroscopic counterparts for mJy radio objects to be added to the sample presented in Magliocchetti et al. (2002). As in Magliocchetti et al. (2002), the parent radio dataset comes from matching together sources in the FIRST (Becker et al. 1995) and APM catalogues over the region of the sky between and , where these two surveys overlap. Magliocchetti & Maddox (2002) find 4075 identifications – corresponding to 16.7 per cent of the original radio sample – in the APM catalogue for and for a matching radius of 2 arcsec, value chosen as the best compromise to maximize the number of real associations (expected to be of the FIRST-APM dataset), while limiting the number of random coincidences to a negligible per cent. 971 objects (hereafter indicated as the photometric catalogue) in the parent dataset exhibit magnitudes brighter than 19.45, the limit of the 2dFGRS.
We note that, even though the fine angular resolution of the FIRST survey implies that some of the flux coming from extended sources could be either resolved out or split into two or more components, leading to a systematic underestimate of the real flux densities of such sources, this effect has been partially corrected for by using the method developed by Magliocchetti et al. (1998) to combine multi-component objects. The above technique, together with the matching procedure, associates optical counterparts to the centroids of multi-component sources, thus minimizing the chances of missing an object with extended radio emission. Also, as already discussed in Magliocchetti et al. (2002), the correction to radio fluxes as measured by FIRST is in the case of sources brighter than 3 mJy, and about 30 per cent for sources with 3 mJy (which mainly correspond to compact spiral galaxies and starbursts). These corrections have been shown not to affect any of the results obtained in both the previous (Magliocchetti et al. 2002) and current works.
The new spectroscopic counterparts were identified by searching in
the 2dFGRS catalogue for objects not yet present in the Magliocchetti et al.
(2002) sample with positions that differed by less than 2
arcsec (value of the diameter of each 2dF fibre) from positions of
sources in the parent photometric dataset. The properties of these 271 objects
are described in Table 2 at the end of the paper; for each of them the Table
indicates:
(1) Source number
(2) Right Ascension (J2000) and (3) Declination (J2000)
as measured in the 2dFGRS.
(4) Offset (expressed in arcsecs) between radio and optical
counterpart in the APM catalogue.
(5) Radio-flux density (in mJy units) at 1.4 GHz.
(6) Apparent and, when present, (7) R magnitudes of the optical
counterpart.
(8) Redshift.
(9) Spectral Classification.
Following Magliocchetti et al. (2002), classes for the optical counterparts of radio sources (column 9 of Table 2) have been assigned on the basis of their 2dF spectra. Spectra have been compared with known templates (see e.g. Kennicut 1992; McQuade et al. 1995) which allowed galaxies to be divided into 6 broad categories:
-
(1)
Early-type galaxies, 150 sources where spectra were dominated by continua much stronger than the intensity of any emission line. These objects can be further divided into two sub-classes:
(i) galaxies with absorption lines only.
(ii) galaxies with absorption lines + weak [O] and H emission lines denoting little star-formation activity. -
(2)
E+AGN-type galaxies, 40 sources showing spectra typical of early-types plus the presence of (narrow) emission lines such as [O], [O], [N] and [S], which are strong if compared to any Balmer line in emission and indicate the presence of large, partially ionized transition regions as is the case in active galaxies.
-
(3)
Late-type galaxies, 51 sources where spectra show strong emission (mainly Balmer) lines characteristic of star-formation activity, together with a detectable continuum.
-
(4)
Starburst galaxies, 15 sources with optical spectra characterized by an almost negligible continuum with very strong emission lines indicating the presence of intense star-formation activity.
-
(5)
Seyfert 1 galaxies, 1 source with spectrum showing strong, broad emission lines.
-
(6)
Seyfert 2 galaxies, 9 sources where the continuum is missing and spectra only show strong narrow emission lines due to the presence of an active galactic nucleus.

Distinctions between different classes of sources and in particular between E+AGN, Seyfert 2 and Late-type galaxies have relied on the diagnostic emission line ratios of Veilleux & Osterbrock (1987), Woltjer (1990) and Rola Terlevich & Terlevich (1997). Note that a definite classification was not possible for all the cases. This simply reflects the fact that it is in general quite common to find ‘composite’ galaxies containing both an AGN and ongoing star formation (see e.g. Hill et al. 2001). We also found two intermediate cases of Seyfert 2-spectral-types with mildly broadened emission lines.
More details on the properties of the full FIRST-2dFGRS sample are given in Section 3.1.
3 The Clustering Properties of Local Radio Sources


3.1 The Data Set
The combination of the sample introduced in Magliocchetti et al. (2002) and of those sources presented in Section 2 provides us with a total of 828 FIRST radio objects with a spectroscopic counterpart in the 2dFGRS. This number is reduced to 820 if we only consider spectra with quality flag Q3 and discard the (four) stars present in the dataset. Their projected distribution onto the sky is shown in Fig. 1, whereby empty circles identify the 971 and mJy sources drawn from the parent photometric catalogue (see Section 2), while filled dots represent the 820 objects with available redshift estimates and spectral classifications.
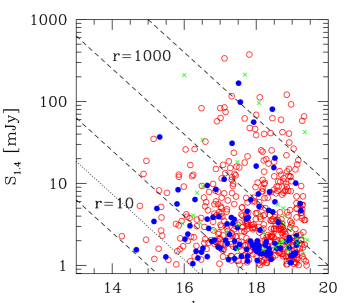
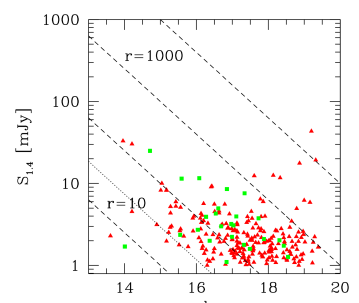
In order to investigate the radio properties of the sample, Figs 2 and 3 respectively show magnitudes versus radio flux at 1.4 GHz and radio power distribution. In more detail, the left-hand panel of Fig. 2 is devoted to the distribution of “classical”, AGN-powered sources (hereafter called radio-AGNs), while the right-hand panel was obtained for the sub-class of star-forming galaxies which owe their radio emission to processes different from accretion onto a central black hole. Empty circles then are for early-type galaxies, filled dots for E+AGN, crosses for Seyfert galaxies (regardless of whether type 1 or 2), while filled triangles are for late-type galaxies and filled squares for starbursts, where the classification follows the one introduced in Section 2. The dashed lines in both panels indicate the loci of constant radio-to-optical ratios , and the dotted lines illustrate the threshold of for an object to be considered as radio-loud. It is clear from the plots that these two classes of objects tend to occupy different regions of the plane, star-forming sources being in general brighter in magnitude and fainter in radio flux. In spite of this difference, we see that the overwhelming majority of the spectroscopic sample has , i.e. the sample is made of radio-loud sources, regardless of the nature of the radio emission.
Radio luminosities have then been derived according to the relation , and are expressed in [W Hz-1 sr-1] units. In the above formula, is the angular diameter distance and is the spectral index of the radio emission (). Following Magliocchetti et al. (2002), we assumed for Seyfert 1 galaxies, for early-type galaxies (with or without emission lines due to AGN activity), for Seyfert 2’s and both for late-type galaxies and starbursts. Fig. 3 shows the resulting distribution of radio luminosities for the whole spectroscopic sample (lower panel) and for the sub-class of radio-AGNs (top panel). The lack of objects at seen in the distribution of AGN-fuelled sources is not seen in the whole spectroscopic sample because of the population of low-luminosity star-forming galaxies which are limited to radio powers (see also Magliocchetti et al. 2002). We also note that all the sources in our sample have moderate luminosities (), i.e. that all the AGN-fuelled objects belong to the class of FRI galaxies (Fanaroff & Riley 1974). This is as expected, since the local radio luminosity function of steep spectrum sources drops rapidly at (Dunlop & Peacock 1990), which is the typical minimum luminosity of an FRII galaxy.
With the aim of studying the clustering properties of the population of local radio sources, following Hawkins et al. (2003) and Madgwick et al. (2003) we have discarded from the original FIRST-2dFGRS sample all the radio objects in 2dFGRS fields with % completeness. Furthermore, we have also only considered those sources with redshifts and magnitudes . This magnitude limit is the brightest over the area of the 2dFGRS survey (Colless et al. 2001, 2003), and so using this limit over the whole area removes the need to correct for variations in the magnitude limit. These cuts leave us with a total of 761 objects (spectroscopic sample) out of which 536 belong to the population of AGN-fuelled sources (radio-AGN sample). Their redshift distributions are illustrated by the histograms in Fig. 4.
3.2 The Redshift-Space Correlation Function
The standard way to quantify the clustering properties of a particular class of sources is by means of the two-point correlation function which measures the excess probability of finding a pair in the two volume elements and separated by a distance . In practice, is obtained by comparing the actual source distribution with a catalogue of randomly distributed objects, subject to the same redshift and mask constraints as the real data. We chose to use the estimator (Hamilton 1993)
| (1) |
where , and are the number of data-data, random-random and data-random pairs separated by a distance (note that throughout this section we will write the distance as instead of to stress the fact that we are working in redshift space).
We generated random catalogues with ten times as many objects as the real datasets, and modulated the angular distribution by both the 2dFGRS and FIRST coverage maps, so that the instrumental window functions did not affect the measured clustering. The redshift distribution for these objects was then generated using the selection function of the different datasets under consideration. Equivalent (with number density of radio sources at redshift and ; see Hawkins et al. 2003 and Madgwick et al. 2003) weights were assigned to each object both in the real and random catalogues; this assumption was justified by the extremely low number density of radio sources ( Mpc-3) which makes the contribution to a negligible one for any sensible value of .
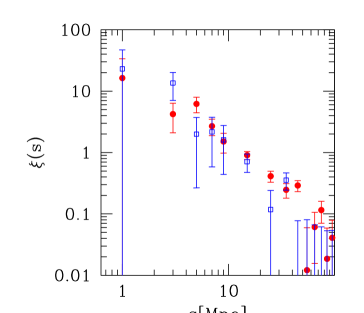
The above procedure was repeated both for the whole spectroscopic sample and in the case of only radio-AGNs. The redshift distributions for the two random catalogues corresponding to the different samples are shown by the dashed lines in Fig. 4. The resulting redshift-space correlation functions are shown in Fig. 5, where the left-hand panel is for the full spectroscopic sample, and the right-hand panel for radio-AGNs. The error bars on were obtained by jack-knife resampling each data-set 20 times.
Fig. 5 suggests that a universal power-law is not a good fit on all scales for either of the measured ’s and that it is particularly poor for the AGN-powered sources. Although a power-law fits well over the range , the redshift-space correlation function steepens at larger scales, and flattens on smaller scales, particularly for the radio-AGN sample. We estimate the true value of the redshift-space correlation length by fitting a localized power-law of the form only in the range .
The corresponding best values for the parameters and can be obtained by a fit to as a function of . This analysis gives Mpc and for the whole FIRST-2dFGRS sample, while in the case of AGN sources one gets Mpc and . These best-fits are shown by the dashed lines in Fig. 5. The dotted line on the left-hand panel of Fig. 5 shows the redshift-space correlation function for the entire population of 2dFGRS galaxies, derived by Hawkins et al. (2003); the similarity between this measurement and the one for local radio-sources is remarkable. This can be understood because the FIRST-2dFGRS catalogue probes radio fluxes down to mJy, which results in a mixture of “classical” AGN-fuelled sources, generally hosted by elliptical galaxies, and star-forming objects such as spirals and irregulars (see Section 2). This mix of early and late type galaxies makes the dataset look similar to a fair (even though very sparse) sample of the whole population of 2dFGRS galaxies.
The situation however looks very different if one considers only AGN-fuelled sources. In this case the sample is much more strongly correlated; the correlation length is higher, and also has a steeper slope. We will discuss the implications of these findings in Section 3.3 when dealing with the real-space correlation function.
As a final step, we are interested in investigating whether there is any dependence of the clustering signal on radio luminosity. We divided the radio-AGN sample into two distinct subsets depending on whether the sources have radio luminosity brighter or fainter than . There are 260 objects in the faint sample, and their average radio luminosity is . There are 276 objects in the bright sample, with average radio luminosity .
The redshift-space correlation functions for the two samples are plotted in Fig. 6; the fainter sample is plotted as filled circles, and the brighter sample as open squares. Even though the small number of sources in the subsets lead to large uncertainties in the measurements, it is clear that the two ’s are entirely compatible with each other. The best-fit parameters are Mpc and for brighter AGNs and Mpc and for the fainter ones. This result shows no evidence for luminosity dependence in the clustering amplitude, and shows that the amplitude of the correlation function at 10 Mpc cannot differ by more much than a factor of 2 even though the two samples differ by a factor of 20 in luminosity. This is consistent with the results of Peacock & Nicholson (1991) who analysed an all-sky sample of radio galaxies at , and found no evidence for any difference in clustering amplitude for samples and . These results imply that the correlation amplitude of radio galaxies is independent of their radio luminosity, at least in the power range .
3.3 The Projected Correlation Function
The previous Section has shown that the redshift-space correlation function is extremely useful for characterizing the main properties of the clustering of low-redshift radio sources. However, differs from the real-space correlation function because of peculiar velocities that lead to redshift-space distortions (see e.g. Hawkins et al. 2003 and Madgwick et al. 2003). It follows that both the amplitude and the slope of the real-space correlation function will differ from the values measured in Section 3.2.
The standard way to recover is to first compute the two-dimensional correlations as a function of separation parallel and transverse to the line of sight, and then integrate it along the direction in order to obtain the projected correlation function as:
| (2) |
We estimate by means of equation (1) – where this time pairs are counted in a grid of bins , – and derive by means of equation (2). We set the upper limit for the integral to Mpc as the best compromise between a large enough value to produce stable results and a small enough value to avoid extra noise added to .
As in the previous subsection, has been evaluated both using the whole spectroscopic sample and the sample of objects showing signatures of AGN in their spectra. Once again, the errors were calculated from 20 jack-knife resamplings of the datasets under consideration.
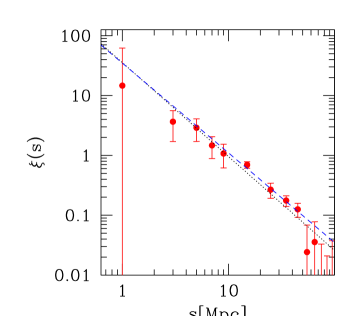
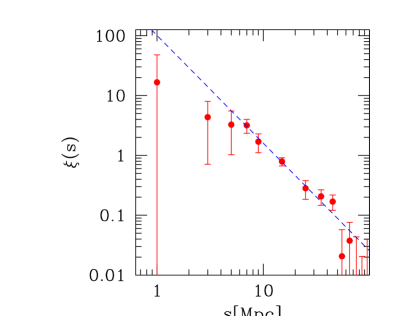
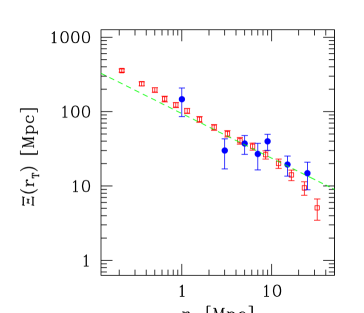
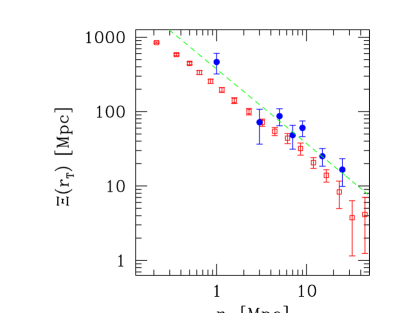
The resulting measurements on scales 1-30 Mpc are shown by the solid points in the two panels of Fig. (7): the left panel shows the results for whole spectroscopic sample, and right panel show the results for AGN sample. The open squares in Fig. (7) show the projected correlation functions from corresponding optical 2dFGRS samples: in the left panel they show the results for the entire population of 2dF galaxies (Hawkins et al. 2003); in the right panel they show the results for early-type 2dFGRS galaxies (Madgwick et al. 2003). From these comparisons we see that the clustering properties of the whole spectroscopic sample are remarkably similar to those of “normal” galaxies, but the projected correlation function of radio AGNs has an amplitude that is roughly twice as large as that of local ellipticals.
From the measurements presented in Fig. 7 it is then possible to estimate the real-space correlation function via (Davis & Peebles, 1983)
| (3) |
which, if we assume the power-law form , can be integrated analytically leading to
| (4) |
where .
A least-square fit to the data for the whole spectroscopic sample gives Mpc, , surprisingly close to the results of Hawkins et al. 2003. For the AGN population we find Mpc, , which is similar to that found by Norberg et al. (2002) for the brightest early-type galaxies in the 2dFGRS. A summary of the results derived here and in Section 3.2 can be found in Table 1.
We note that a measured correlation length Mpc is in very good agreement with previous estimates derived from deprojection of the angular two-point correlation function . These include the results of Cress et al. (1996), Loan et al. (1997), Magliocchetti et al. (1998) and Magliocchetti & Maddox (2002). However, more recent works (e.g. Blake & Wall 2002; Overzier et al. 2003) seem to find lower values for , of the order of 5-6 Mpc. Given that the functional form for the redshift distribution of radio sources at the mJy level adopted by the various authors is the same, i.e. the one proposed by Dunlop & Peacock (1990), we ascribe the differences found by Blake & Wall (2002) and Overzier et al. (2003) as caused by not properly dealing with the issue of multi-component sources. Ignoring the effect of multiple-sources on the observed clustering properties of radio objects in fact leads (amongst others) to an underestimate of the slope of , , which in turn yelds smaller inferred values for the corelation length .
| Whole Sample | Radio-AGN | |
|---|---|---|
| [Mpc] | ||
| [Mpc] | ||
4 Constraints on the Halo and Black Hole Mass
Since the measurements presented in the right-hand panel of Fig. 7 have been obtained for a homogeneous sample of AGN-fuelled sources, we can easily predict the clustering for a range of models to be directly compared with the data.
Under the assumption that each dark matter halo can only host one radio-AGN (but see later for a more general discussion), the predicted spatial correlation function (on a scale and at a redshift ) for this class of sources can in fact be written as:
| (5) |
This expression holds on scales Mpc where the halo-halo exclusion effects are negligible (for the general case see Magliocchetti & Porciani 2003).
The mass-mass correlation function in Equation (5) is fully specified for a given cosmological model and a chosen normalization . The precise form of can be analytically derived following the approach of Peacock and Dodds (1996). The effective bias , which determines the way radio sources trace the mass distribution, is obtained via:
| (6) |
where and respectively are the linear bias factor and the halo mass function of individual halos of mass at a redshift and – in our specific case – is the minimum mass of a halo able to host a radio-AGN.
In order to compare models with data we have then written both and according to the Sheth & Tormen (1999) prescriptions and derived the theoretical projected by integrating the spatial correlation function (5) along the direction parallel to the line of sight via equation (3), where all the relevant quantities are evaluated at the median redshift of the 2dFGRS, .
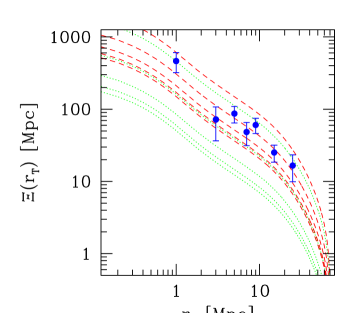
The dotted lines in Fig. (8) show the predictions obtained from equation (5) for different values of the minimum halo mass necessary to host a radio-AGN as compared to the measurements derived in Section 3.3. The chosen values for the minimum mass range from M☉ (bottom dotted curve) to 1014 M☉ (top dotted curve). Despite the large error bars, it is clear that none of the predicted ’s for minimum halo masses M☉ can provide a reasonable fit to the data, since they all fall below the observed values. Indeed, the best fit is obtained for , corresponding to an effective bias . We note that very similar values (i.e. and ) are also found if one releases the assumption of one radio galaxy per halo and considers more general distributions of the kind (see e.g. Peacock 2003) or a more extreme (with average number of radio galaxies per halo of mass ) even though, as expected, the difference between models derived for different values of decreases as one increases the weight given to larger-mass haloes (see Fig. 8).
The implications of the above results are quite intriguing since they suggest, independent of the chosen halo occupation form, that radio-AGNs reside in relatively massive haloes, spanning a mass range from rich groups to super-massive clusters. Smaller halos seem to be inhibited from hosting a radio-emitting AGN. This conclusion is also supported by the small-scale behaviour of the redshift-space correlation function of radio-AGNs as measured in Section 3.2. Indeed, both the lack of pairs with distance Mpc and the flattening of on scales Mpc have a natural explanation if one assumes AGN-powered sources to be confined in massive halos (even if one cannot exclude this latter finding as due to the fingers of God effect, see Hawkins et al. 2003). In the case where only one source per halo is assumed, the halo-halo spatial exclusion ensures that no pair of radio-AGNs can be found with a separation smaller than the sum of the virial radii of the halos that host them. For a typical halo mass of M☉ the minimum separation for the adopted cosmology turns out to be 1.6 Mpc. Allowing for the uncertainties in our determination of , this implies that there should be a deficit of pairs on scales Mpc, consistent with the observed flattening of on small scales.
Thus our average estimate of the minimum halo mass for a radio-AGN is ), which is about a
factor 10 larger than that associated with “normal” early-type
galaxies, ,
(Magliocchetti & Porciani 2003). This is also about a factor 10
larger than that obtained for the population of radio-quiet quasars in
the 2dF QSO dataset, (Grazian et al. 2003). All three of the above
determinations are based on samples drawn from the same parent
catalogue (APM survey), and so selection effects are not expected to
bias the comparison between the different results.
Taking these
numbers at face value suggests that radio-AGNs and radio-quiet quasars
are two distinct populations, with more massive dark matter halos
required for an AGN to trigger radio activity.
On the other hand, the results presented in Section 3.2 (see Fig. 6) together with those obtained by Peacock & Nicholson (1991) for more luminous radio galaxies show that radio-AGNs with very different radio luminosities have very similar correlation amplitude. If one thinks in terms of the model expressed in equation (5), there appears to be little or no correlation between radio luminosity and minimum halo mass. A simple comparison of Figs 6 and 8 illustrates that the correlation function estimates obtained for low-luminosity and moderately bright-luminosity radio-AGNs both fall in the same range as found for the whole sample).
If we then combine the above information, the data seem to suggest that there is a threshold halo mass required to produce significant radio emission from an AGN but – once the radio activity is triggered – there seems to be no connection between radio luminosity of the sources and dark matter content of those halos hosting them. Note that this statement does not necessarily imply the minimum halo mass to be the only factor playing a relevant role in the onset of radio emission from an AGN. Also the threshold may not be a sharp mass threshold, but could be as a smooth transition between the radio-quiet and radio-loud regimes for halos near .
These results on the minimum halo mass can also be viewed in terms of a minimum black hole mass. Ferrarese (2002) gives a simple prescription to convert the dark matter mass of a halo hosting a black hole into black hole mass :
| (7) |
Thus, a minimum halo mass corresponds to , which would represent the minimum black hole mass required to onset radio-AGN activity – at least for relatively faint/FRI sources such as the overwhelming majority of those we have considered in our analysis (see Section 3.1). It is interesting to note that this estimate is in good agreement with both the results of Marchesini, Ferrarese & Celotti (2003) and also those of Dunlop et al. (2003), despite the entirely different methods used in our analysis. Also our minimum black hole mass is noticeably larger than that obtained for radio-quiet quasars; from an analysis of the 2dF QSO dataset in the same redshift range spanned by the sources considered in this work, Corbett et al. (2003) find . By making use of equation (7), we can then conclude that – at least for moderately faint/FRI radio sources – there seems to be a minimum black hole mass of about required to produce significant radio emission from an AGN; however, once the radio emission is produced, there is little or no correlation between radio luminosity and black hole mass. This is in agreement with other analyses of radio-loud quasars by Dunlop et al. (2003) and Cirasuolo et al. (2003).
We note that, even though the connection between black hole mass and radio power has been obtained in our analysis as a consequence of the connection between radio power and halo mass, this first relationship is supposed to be more fundamental and physically based as it is the black hole which actually powers the AGN. Any correlation between radio power and halo mass is then expected to arise as a secondary effect, since black hole mass is observed to scale with bulge luminosity and this is turn is related – in the case of elliptical galaxies – to halo mass (see e.g. Magorrian et al. 1998; Kormendy & Gebhardt 2001; McLure & Dunlop 2002; Archibald et al. 2002; Granato et al. 2004)
5 conclusions
This paper has presented the clustering properties of local, mJy radio sources by making use of a sample of 820 objects drawn from the joint use of the FIRST survey and the 2dFGRS. To this aim, we have introduced 271 new spectroscopic counterparts for FIRST radio sources to be added to those already obtained by Magliocchetti et al. (2002). These objects can be divided in two broad sub-classes: (1) star-forming objects (66 sources, which include both late-type and star-burst galaxies), which owe their radio activity to processes connected to intense star formation and (2) radio-AGNs (202 sources), where the radio signal stems from accretion processes onto a central black hole. In both cases, the redshift range range spanned extends up to (with star-forming objects being relatively more local than AGN-fuelled sources) and radio luminosities cover the interval , which identifies the radio-AGNs included in the sample as FRI sources.
The redshift-space correlation function and the projected correlation function have been calculated for both the total FIRST-2dFGRS sample and for the sub-class of radio-AGNs. The results for the two populations are quite different.
In the case of all FIRST-2dFGRS sources, both the correlation functions are found to be entirely consistent with the estimates obtained by Hawkins et al. (2003) for the whole sample of 2dFGRS galaxies. From measurements of the redshift-space correlation function we derive a redshift-space clustering length Mpc and a slope , while from the projected correlation function we estimate the parameters of the real-space correlation function to be Mpc and .
Sources that show signatures of AGN activity in their spectra are found to be very strongly clustered, with a value for the redshift-space clustering length, (in excellent agreement with the findings of Peacock & Nicholson 1991). Measurements of the real-space correlation function lead to Mpc and , slightly steeper and higher amplitude than optically selected galaxies, but very similar to bright early-type galaxies.
We also find no significant differences in the clustering properties of faint () compared to brighter () AGN-fuelled radio sources.
Comparisons with physically-motivated models for the clustering properties of classes of galaxies show that AGN-fuelled sources have to reside in dark matter halos more massive than , higher than the figure recently measured for radio-quiet QSOs (see e.g. Grazian et al. 2003). Under certain assumptions, this value can be converted into a minimum black hole mass associated with radio-loud, AGN-fuelled objects of , again larger than current estimates for the typical black hole mass associated with local 2dF (radio-quiet) quasars (Corbett et al. 2003).
The above results then suggest – at least for moderately faint/FRI radio sources such as those included in our sample – the existence of a threshold halo/black hole mass associated with the onset of significant radio activity such as that of radio-loud AGNs. We stress that such threshold is not necessarily a sharp one, as it could as well identify an allowed range (in the high-mass regime) for the transition between radio-quiet and radio-loud regimes. Once the activity is triggered there seems to be no evidence for a connection between halo/black hole mass and radio luminosity.
References
- [Archi et al. 2002] Archibald E.N., Dunlop J.S., Jimenez R., Friaca A.C.S., McLure R.J., Hughes D.H., 2002, MNRAS, 336, 353
- [Aur et al. 1977] Auriemma C., Perola G.C., Ekers R., FAnti R., Lari C., Jaffe W.J., Ulrich M.H., 1977, A&A, 57, 41
- [Becker et al. 1995] Becker R.H., White R.L., Helfand D.J., 1995, ApJ, 450, 559
- [Blake2003] Blake C. Wall J.V., 2002, MNRAS, 329, L37
- [Blake2002] Blake C. Wall J.V., 2003, MNRAS, 337, 993
- [Ciras2003] Cirasuolo M., Magliocchetti M., Celotti A., Danese L., 2003, MNRAS, 341, 993
- [Colless 2001] Colless M. et al. (2dFGRS team), 2001, MNRAS, 328, 1039
- [Colless 2003] Colless M. et al. (2dFGRS team), 2003, astro-ph/0306581
- [Corb2003] Corbett E.A., Croom S.M., Boyle B.J., Netzer H., Miller L., Outram P.J., Shanks T., Smith R.J.,Rhook K., 2003, MNRAS, 343, 705
- [Condon1998] Condon J.J., Cotton W.D., Greisen E.W. et al., 1998, AJ, 115, 1693
- [Cress1996] Cress C.M., Helfand D.J., Becker R.H., Gregg M.D., White R.L., 1996, ApJ, 473, 7
- [Davis1983] Davis M., Peebles P.J.E., 1983, ApJ, 208, 13
- [Dun 1990] Dunlop J.S., Peacock J.A., 1990, MNRAS, 247, 19
- [Dunlop2003] Dunlop J.S., McLure R.J., Kukula M.J., Baum S.A., O’Dea C.P., Hugher D.H., 2003, MNRAS, 340, 1095
- [Fal 2003] Falomo R., Carangelo N., Treves A., 2003, MNRAS, 343, 505
- [FR 1974] Fanaroff B.L., Riley J.M., 1974, MNRAS, 167, L31
- [Ferrarese2002] Ferrarese L., 2002, ApJ, 578, 90
- [gra2004] Granato G.L., De Zotti G., Silva L., Bressan A., Danese L., 2004, ApJ, 600, 580
- [Grazian2003] Grazian A., Negrello M., Moscardini L., Cristiani S., Haenelt M.G., Matarrese S., Omizzolo A., Vanzella E., 2003, astro-ph/0303382
- [Hamilton1993] Hamilton A.J.S., 1993, ApJ, 417, 19
- [Hawkins2002] Hawkins E., et al. (2dFGRS Team), 2003, MNRAS, 346, 78
- [Hill 2001] Hill T.L., Heisler C.A., Norris R.P., Reynolds J.E., Hunstead R.W., 2001, ApJ, 548, 127
- [Kennicut 1992] Kennicut R.C., 1992, ApJ, 388, 310
- [koi 1995] Kooiman L.K., Burns J.O., Klypin A. A., 1995, ApJ, 448, 500
- [Kor2001] Kormendy J., Gebhardt K., 2001, in 20th Texas Symposium n relativistic astrophysics, ed J.C. Weeler & H. Martel (AIP COnf. Proc. 586; Melville: AIP), 363
- [Lacy2001] Lacy M., Laurent-Muehleisen S.A., Ridgway S.E., Becker R.H., White R.L., 2001, ApJ, 551, L17
- [Lahav2002] Lahav O., et al. (2dFGRS Team), 2002, MNRAS, 333, 961
- [Laor2000] Laor A., 2000, ApJ, 543, L111
- [loa 1997] Loan A.J., Wall J.V., Lahav O., 1997, MNRAS, 286, 994
- [Maddox et al. 1990a] Maddox S.J., Efstathiou G., Sutherland W.J., Loveday J., 1990a, MNRAS, 243, 692
- [Maddox et al. 1990b] Maddox S.J., Efstathiou G., Sutherland W.J., 1990b, MNRAS, 246, 433
- [Maddox et al. 1996] Maddox S.J., Efstathiou G., Sutherland W.J., 1996, MNRAS, 283, 1227
- [Madgwick22002] Madgwick D.S., et al. (2dFGRS Team), 2003, astro-ph/0303668
- [Maglio21998] Magliocchetti M.,Maddox S.J., Lahav O., Wall J.V., 1998, MNRAS, 300, 257
- [Maglio21998] Magliocchetti M.,Maddox S.J., Lahav O., Wall J.V., 1999, MNRAS, 306, 943
- [Maglio3 2002] Magliocchetti M., Maddox S.J., 2002, MNRAS, 330, 241
- [Maglio2002] Magliocchetti M., et al. (2dFGRS Team), 2002, MNRAS, 333, 100
- [Maglio12003] Magliocchetti M., Porciani C., 2003, MNRAS, 346, 186
- [Mago1998] Magorrian J., et al., 1998, AJ, 115, 2285
- [Marche2003] Marchesini D., Ferrarese L., Celotti A., 2003, MNRAS, submitted
- [Mc 1995] McQuade K., Calzetti D., Kinney A.L., 1995, ApJS, 97, 331
- [Mc 2002] McLure R.J., Dunlop J.S., 2002, MNRAS, 331, 795
- [Mc 2002] McLure R.J., Jarvis M.J., 2002, MNRAS, 337, 109
- [Norberg2002] Norberg P., et al (2dFGRS Team), 2002, MNRAS, 332, 827
- [overz2003] Overzier R.A., Rottgering H.J.A., Rengelink R.B., Wilman R.J., 2003, A&A, 405, 53
- [Peacock1 1991] Peacock J.A., Nicholson D., 1991, MNRAS, 253, 307
- [Peacock 1996] Peacock J.A., Dodds S.J., 1996, MNRAS, 267, 1020
- [Peacock 2003] Peacock J.A., 2003, astro-ph/0309240
- [Rola 1997] Rola C., Terlevich E., Terlevich R., 1997, MNRAS, 289, 419
- [Renge 1998] Rengelink R.B., Myley G.K., Rottgering H.J.A., Bremer M.N.m de Bruyn A.G., Tang Y., 1998, in Bremer M., Jackson N., Perez-Fournon I., eds. Observational Cosmology with the New Radio Surveys. Kluwer, Dordrecht, p.143
- [seld 1981] Seldner M., Peebles P.J.E., 1981, MNRAS, 194, 251
- [shav 1989] Shaver P.A., Pierre M., 1989, A&A, 220, 35
- [sheth 1999] Sheth R.K., Tormen G., 1999, MNRAS, 308, 119
- [snell 2003] Snellen I.A.G., Lehnert M.D., Bremer M.N., Schilizzi R.T., 2003, MNRAS, 342, 889
- [sper 2003] Spergel D.N. et al., 2003, ApJS, 148, 175
- [Veill 1987] Veilleux S., Osterbrock D.E., 1987, ApJ, 63, 295
- [Wolt 1990] Woltjer L., 1990, in SAAS-FEE Advanced Course on Active Galactic Nuclei, Swiss Society for Astro-Physics Astronomy, eds. Blandford R., Netzer H., Woltjer L.