0 \Year2004 \Pagespan000000 \lhead[0]C.A. Watson & V.S. Dhillon: Roche tomography of the secondary stars in CVs \rhead[Astron. Nachr./AN 325, No. (\yearofpublic)]0 \headnoteAstron. Nachr./AN 325, No. \pages (\yearofpublic) / DOI 10.1002/asna.\yearofpublic1XXXX
Roche tomography of the secondary stars in CVs
Abstract
The secondary stars in cataclysmic variables (CVs) are key to our understanding of the origin, evolution and behaviour of this class of interacting binary. In seeking a fuller understanding of these objects, the challenge for observers is to obtain images of the secondary star. This goal can be achieved through Roche tomography, an indirect imaging technique that can be used to map the Roche-lobe-filling secondary. The review begins with a description of the basic principles that underpin Roche tomography, including methods for determining the system parameters. Finally, we conclude with a look at the main scientific highlights to date, including the first unambiguous detection of starspots on AE Aqr B, and consider the future prospects of this technique.
keywords:
binaries: close – novae, cataclysmic variables – stars: late-type – stars: imaging – stars: spotsc.watson@sheffield.ac.uk
1 Introduction
Cataclysmic variables (CVs) are defined as semi-detached binary systems consisting of a Roche-lobe-filling secondary star (typically a lower main-sequence star) transferring material to a white dwarf primary star. The term cataclysmic refers to their violent but non-destructive outbursts, which occur with a wide range of frequencies and amplitudes. Non-magnetic CVs accrete material onto the primary star via a gas stream and accretion disc, and at the position where the gas stream impacts upon the disc a shock-heated region of enhanced emission, called the bright spot, is formed.
In the presence of a strong magnetic field from the white dwarf, the nature of the accretion process changes dramatically. Under these conditions the white dwarf will accrete material along the field lines either directly from the gas stream or via a truncated disc. These latter systems are called polars or intermediate polars, respectively, and collectively they form the magnetic CVs. Typically, the separation of the stellar components in CVs is 1R⊙ and their orbital periods are of the order of a few hours.
1.1 Why image the secondary stars in CVs?
Surface images of the secondary stars would have far-reaching implications for CV studies. For instance, conventional methods of measuring the binary parameters using the secondary star absorption lines assume that the centre-of-mass and centre-of-light of the secondary coincide. This is often not the case as, for many of these systems, the secondaries are known to be irradiated and hence such measurements will be prone to systematic errors. With the availability of surface images any irradiation pattern on the secondary would be known, allowing an accurate determination of the binary parameters. The study of the irradiation pattern itself may also yield clues to the geometry of the accretion structures around the white dwarf - such as the vertical extent of the accretion disc.
Perhaps most importantly of all, images could be used to identify features related to magnetic activity on the secondary, such as cool starspot regions. CV secondaries are rapidly rotating and, in the presence of a dynamo action, are expected to be magnetically active. Indeed, magnetic activity cycles on the secondary star have been invoked to explain variations in their orbital periods, mean brightness and mean outburst intervals. Furthermore, the magnetic field of the secondary is thought to play a vital role in the evolution of the binary as a whole, allowing angular momentum to drain from the binary along the field lines via the magnetic braking mechanism. This drives the system to shorter orbital periods and sustains mass transfer between the components. Images would, therefore, lend evidence for the existence of magnetic activity and, in turn, the magnetic braking theory. In addition, the number, size, variability and distribution of starspots as deduced from surface images would provide key tests of stellar dynamo theories under extreme environmental conditions.
2 The principles of Roche tomography
Unfortunately, the secondary stars in CVs have typical radii of 400 000 km and are located at distances of 200 parsecs. This means that to detect a feature covering half of the secondary would require a 10 000-m class telescope operating at the diffraction limited resolution - well beyond what is technically achievable for now. Since direct imaging has been rendered impossible for the foreseeable future, astro-tomographic techniques must be employed in order to achieve the micro-arcsecond resolution required for imaging purposes. Roche tomography is one such technique and in this section we shall describe its basic principles and how it can be used to determine the binary parameters.
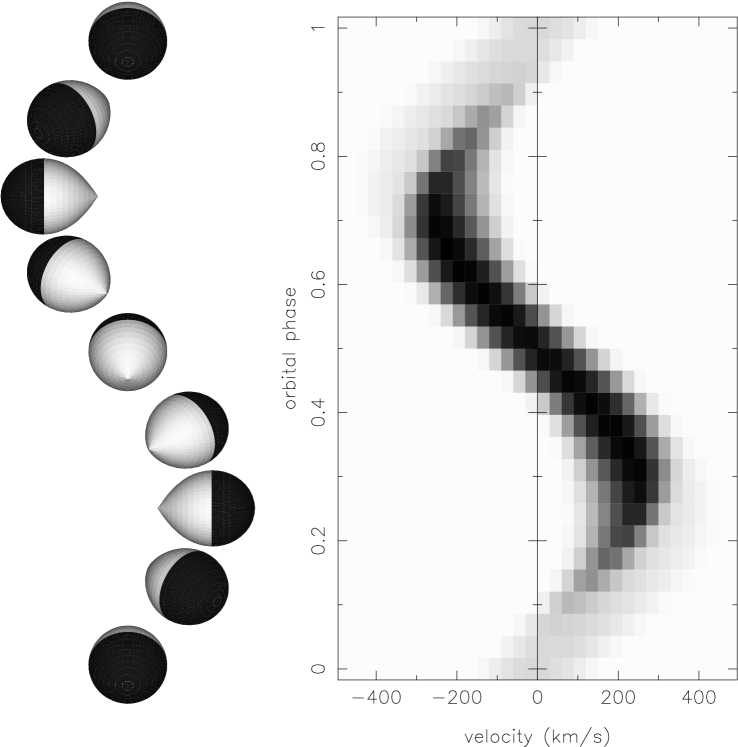
In Roche tomography (Rutten & Dhillon, 1996) the secondary star is modelled as a grid of quadrilateral tiles or surface elements with approximately equal areas, all lying on the critical potential surface defining the Roche lobe. Each surface element is then assigned a copy of the local specific intensity profile convolved with the instrumental resolution. These profiles are scaled to take into account the intensity of each element, and also phase dependent effects such as variations in the projected area, obscuration, and limb-darkening. The contribution from each element is then Doppler-shifted according to its radial velocity at any particular phase (assuming that the secondary star is synchronously rotating). Finally, the rotationally broadened profile of the secondary star at that phase can be simply calculated by summing up the contributions from the surface elements over the visible hemisphere. An example of this forward process is shown in Fig. 1.
When reconstructing an image of the secondary star the reverse process from what has been described above is carried out. In this case, the strengths of the profiles contributed from each tile are iteratively adjusted until an image is obtained whose predicted data is consistent with the observed data (i.e. =1)111Note: minimising does not give a good solution since this results in an image dominated by noise.. Since there are an infinite number of images that can fit the data equally as well, it is necessary to employ a regularisation statistic in order to select a unique image. Following Horne (1985), we select the image with maximum entropy relative to some default map.
Essentially, the default map contains prior information about the intensity distribution across the secondary (if known) and is the image that the reconstruction will default to in the absence of any data. In its most non-committal or least informative form each element in the default map can be set to the average value in the reconstructed map (a moving-average default) - and the global maximum of the entropy occurs when the reconstructed and default maps are identical. If the data are good then the choice of default map makes little difference to the final image. An efficient algorithm for maximising entropy subject to the constraint imposed by is given by Skilling and Bryan (1984) and has been implemented by them in the fortran package memsys. By application to Roche tomography a solution is selected which leaves the largest remaining uncertainty (i.e. the maximum entropy) which is consistent with the data constraints. In this way, the fewest additional assumptions or biases are introduced.
2.1 Techniques
As discussed in Section 1.1, if the centre-of-mass and centre-of-light of the secondary are not coincident then the star’s observed radial-velocity curve will be distorted from the pure sine wave that represents the true motion of its centre-of-mass. This occurs as a result of the geometrical distortion of the secondary star and the presence of surface inhomogeneities, particularly irradiation. Conventional methods of measuring the system parameters do not take these effects into account or, at best, require implementation of an ad hoc correction (e.g. Wade & Horne, 1988).
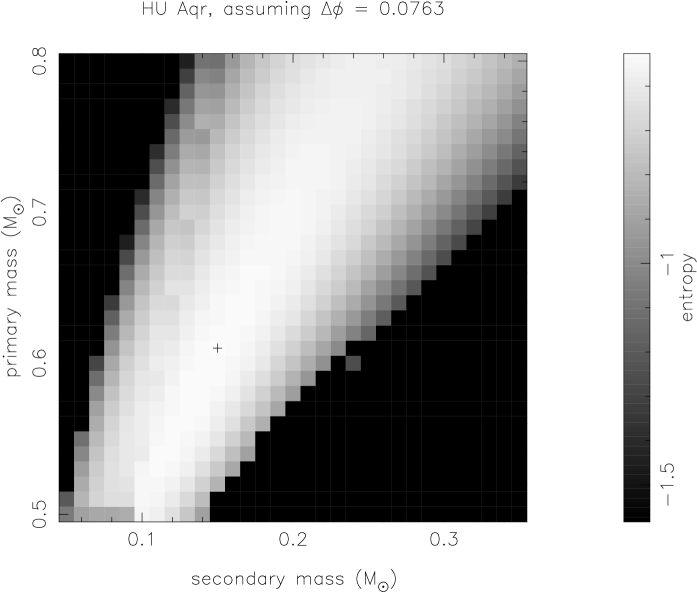
Since Roche tomography automatically takes these factors into consideration then the system parameters can be obtained which contain the least systematic bias. In Roche tomography, adopting incorrect parameters causes spurious artefacts to be introduced during the reconstruction, normally in the form of equatorial banding (see Watson & Dhillon, 2001). This artificially increases the information content of the image, thereby reducing its entropy. Assuming that the correct binary parameters are those that minimise the number of artefacts in the image, they can then be found by searching for the parameters that result in the reconstruction with the highest entropy. This is shown graphically as an entropy landscape (Fig. 2) where the greyscale of each square represents the entropy value obtained for the respective masses during image reconstruction. In similar fashion, this method can be extended in order to obtain the systemic velocity and inclination. Simulations by Rutten & Dhillon (1994) have shown that the masses determined by this technique can be accurate to better than per cent in the presence of irradiation.
3 Science highlights
To date, Roche tomograms of the secondary star in 5 different CVs exist in refereed publications (see Table 1 for a list). The first practical application of Roche tomography was to the nova-like DW UMa observed during a low-state when the secondary was clearly visible. By co-adding the narrow components of the H, H and H emission lines Rutten & Dhillon (1994) were able to show that they originated on the irradiated face of the secondary, though they were unable to determine the system parameters in this test case.
| Object | Type | Line(s) | Features | Remarks | Ref. |
|---|---|---|---|---|---|
| DW UMa | NL | H,, | f | Test case | 1 |
| AM Her | P | Nai | t | Test case | 2 |
| Nai | t | Full analysis | 3 | ||
| IP Peg | DN | Nai | f/l | Full analysis | 3 |
| HU Aqr | P | Heii | t | Full analysis | 3 |
| QQ Vul | P | Nai | f/t | Full analysis | 3 |
Type codes: DN = dwarf nova; NL = nova-like; P = polar.
Feature codes: (f) irradiation of front (L1 point) of secondary, (l) irradiation of leading hemisphere, (t) irradiation of trailing hemisphere, (f/l or f/t) irradiation of L1 point, but stronger towards leading or trailing hemisphere.
Ref. codes: 1 = Dhillon & Rutten (1994); 2 = Smith & Davey (1996); 3 = Watson et al. (2003a)
Derivation of the masses using Roche tomography was first accomplished by Rutten & Dhillon (1996) who constructed an entropy landscape (albeit for a fixed inclination and systemic velocity) for the dwarf nova IP Peg. The entropy landscape method was then extended to include a search for the systemic velocity and inclination by Watson et al. (2003a). This study showed that systemic velocity measurements derived from fitting radial velocity curves are unreliable, and that the systemic velocity can be more accurately determined using Roche tomography.
Furthermore, although it was not possible to find a unique inclination and, therefore, reliably constrain the component masses of the non-eclipsing systems in the study222Note: acceptable changes in the binary parameters did not greatly affect the derived images of the secondaries in this study., consistent results for the mass-ratios were found independently of the inclination. A similar analysis of two separate observations of the X–ray binary Her X–1 (Watson et al. 2003b) was, however, able to determine a unique inclination and set of masses in both instances. The masses obtained for the two datasets agree to within 2 per cent, providing confidence that the method delivers accurate and self-consistent results.
In addition, the resulting images also provide a unique glimpse of the extreme conditions that exist on the secondary stars surface. Fig. 3 shows reconstructed images of the secondaries in HU Aqr and IP Peg. The first image presented is that of the polar HU Aqr in the light of the Heii emission line (Watson et al. 2003a). The most prominent features are that the emission (depicted using bright greyscales) originates from the inner hemisphere and that there is a significant lack of emission from the leading hemisphere. This can be attributed to irradiation from the accretion regions which is shielded from the leading hemisphere by the gas stream and accretion curtain. Likewise, similar irradiation patterns are also evident in Roche tomograms of two more polars, AM Her and QQ Vul (see Watson et al. 2003a).
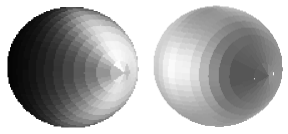
The opposite is apparent in IP Peg (imaged using the NaI doublet, where stronger Na absorption is depicted by bright greyscales). Here, the strongest impact of irradiation occurs on the leading hemisphere where the Nai is ionised. Since IP Peg is a non-magnetic CV and therefore harbours an accretion disc, it is possible that the irradiating source is the bright-spot. This is located to the correct side of the binary system to illuminate the leading hemisphere of the secondary.
The tomograms in Fig. 3 represent the best that can be achieved using a single absorption or emission line on 4-m class telescopes. Although this is sufficient to constrain the binary parameters and map large scale features such as irradiation patterns, it is insufficient to image small scale features such as starspots. To do this requires the implementation of techniques such as least squares deconvolution (LSD - see Donati et al. 1997) which effectively stacks the 1000’s of stellar lines that can be observed using an echelle spectrograph to form a single line of high signal-to-noise.
Here we present the preliminary results of applying LSD and Roche tomography to the novalike AE Aqr. Observations of AE Aqr were undertaken on 2001 August 9 & 10 using the 4.2-m William Herschel Telescope and the Utrecht Echelle Spectrograph, with simultaneous photometry taken using the Jacobus Kapteyn Telescope in order to monitor the flaring behaviour and slit-loss correct the spectroscopic data.
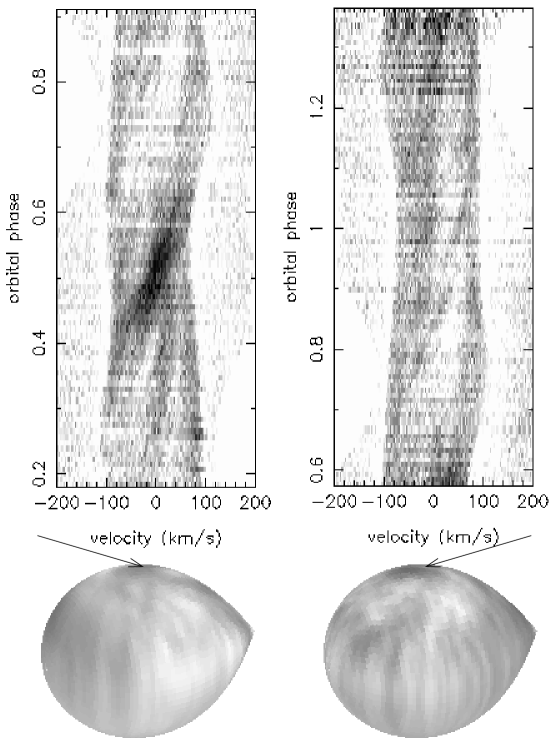
The preliminary findings are shown in the top panel of Fig. 4 as trails of the LSD profiles after removal of the orbital motion and subtraction of a theoretical profile. Clearly apparent are the expected variations in with orbital phase, as well as the appearance of emission ’bumps’ traversing the trails from blue to red. These ’bumps’ are due to the classical distortion of the line profile by starspots and therefore represent the first unambiguous detection of starspots on a CV secondary. Further confidence in the level of the detection can be gained by noting that several starspot features can be seen to repeat over the two nights.
Roche tomograms for both nights are displayed in the lower panel of Fig. 4. Although further work is still required to sharpen the images, and the rear of the star in night one has not been observed leading to additional blurring - it is still evident that several features can be identified in both tomograms. These include the presence of a high latitude spot extending from 60 towards the polar regions (though not truly polar), and an apparent band of spots at a latitude close to 30. This is similar to images of other rapidly rotating stars, where high latitude starspots have also been found.
4 Conclusions and future work
Comparison of the number of Roche tomograms currently in the literature (Table 1) with the number of Doppler maps of CVs shows that Roche tomography is clearly still a fledgling tool. As such, there are still extensions to the technique that can be made. One would be to combine Roche and Modulated Doppler tomography (Steeghs 2003) – allowing the secondary star and accretion regions to be mapped simultaneously without many of the constraining axioms of conventional Doppler tomography.
In addition, as higher quality datasets for CVs become available, there will be an increasing need to discard the entropy landscape method. This would be in favour of techniques which allow the binary parameters to be determined simultaneously during the image reconstruction process, thereby greatly reducing the computational burden of such studies. With the current quality of CV datasets, however, unique and reliable binary parameters may not always exist, and such methods may produce erroneous results.
Even without these enhanced features, Roche tomography has shown itself to be capable of constraining the system parameters and providing an insight into the effects of irradiation in such objects. In addition, the Roche tomograms of AE Aqr provide the first conclusive proof that starspots are present on the surface of CV secondaries.
We can now look forward to imaging CV secondaries in unprecedented detail, and future work should aim to address questions as to what role the secondary star magnetic field plays in both the short term evolution of CVs, such as the effect on accretion rates and cyclical orbital period variations, as well as the longer term evolution through magnetic braking. Starspot tracking could also be used to measure the amount of differential rotation in these stars (e.g. Cameron & Donati 1997). In addition to answering these questions, such studies will also provide further tests of stellar dynamo theories under the most extreme environmental conditions.
Acknowledgements.
The authors thank the efforts of the organising committee of JD09 of the IAU General Assembly, 2003. Thanks also go to Tariq Shahbaz for much advice on the AE Aqr data reduction.References
- [1] Cameron, A.C., Donati, J.-F.: 1997, MNRAS, 291, 658
- [2] Davey, S.C., Smith, R.C.: 1996, MNRAS, 280, 481
- [3] Donati, J.-F., Semel, M., Carter, B.D., Rees, D.E., Cameron, A.C.: 1997, MNRAS, 291, 658
- [4] Horne, K.: 1985, MNRAS, 213, 129
- [5] Rutten, R.G.M., Dhillon, V.S.: 1994, A&A, 288, 773
- [6] Rutten, R.G.M., Dhillon, V.S.: 1996, ’Roche Tomography of the Cool Star in IP Peg’. In: CVs and Related Objects. ed. by Evans, A., Wood, J.H. (Kluwer, Dordrecht) pp. 21–24
- [7] Skilling, J., Bryan, R.K.: 1984, MNRAS, 211, 111
- [8] Steeghs, D.: 2003, MNRAS, 344, 448
- [9] Wade, R.A., Horne, K.: 1988, ApJ, 324, 411
- [10] Watson, C.A., Dhillon, V.S.: 2001, MNRAS, 326, 67
- [11] Watson, C.A., Dhillon, V.S., Rutten, R.G.M., Schwope, A.D.: 2003a, MNRAS, 341, 129
- [12] Watson, C.A., Dhillon, V.S., Quaintrell, H., Still, M.: 2003b, MNRAS, submitted