Optical Spectroscopy of K-selected
Extremely Red Galaxies
Abstract
We have obtained spectroscopic redshifts for 24 sources from a sample of bright, K-selected EROs using the Keck-I telescope. These EROs have high resolution morphologies from HST and were selected with a median Ks magnitude of 18.7 and mag. (Yan & Thompson 2003). Among the 24 redshifts, the majority (92%) are at . We derived the rest-frame J-band luminosity function at . Our result suggests that the luminosity evolution between bright EROs at and the present-day L∗ massive galaxies is at most about 0.7 magnitude. Combining the morphologies and deep spectroscopy revealed that the 24 EROs have the following properties. (1) 86% of the spectra have absorption features from old stars, suggesting that the dominant stellar populations seen in the rest-frame UV are old stars. 50% of the sources have pure absorption lines, while the remaining 50% have emission lines, indicating recent star formation. We conclude that the color criterion for EROs is very effective in selecting old stellar populations at , and a large fraction of these systems with prominent old stellar populations also have recent star formation. (2) The 12 emission line systems have the same number of disk and bulge galaxies as in the remaining 12 pure absorption line systems. We conclude that spectral classes do not have a simple, direct correspondence with morphological types. (3) Three EROs could be isolated, pure passively evolving early-type galaxies at . This implies that only a small fraction (10%–15%) of early-type galaxies are formed in a rapid burst of star formation at high redshifts and evolved passively since then. (4) Three EROs have very red continua and pure emission line spectra. Their redshifts and star formation rates are similar to that of HR 10. These three sources are potential candidates for dusty starbursts. (5) We identified three AGNs (13%), which is consistent with what has been found by deep Chandra observations.
1 Introduction
In recent years, significant progress has been made in the study of Extremely Red Objects (EROs), i.e. galaxies selected by the color criteria of either ( mag. or ( mag. These are the expected colors of a pure passively evolving old stellar population at roughly a redshift of one. Several recent wide field near-IR surveys (McCarthy et al. 2002; Cimatti et al. 2002; Roche et al. 2002) have provided large datasets for measuring the surface densities of EROs down to faint K magnitudes and for ERO clustering analysis (Daddi et al. 2000a; McCarthy et al. 2001). These surveys found that the ERO angular correlation strength is comparable to that of low redshift early-type galaxies (Davis & Geller 1976; Willmer, da Costa & Pellegrini 1998), and about a factor of 10 higher than that of average field galaxies. These results are partly due to the narrow redshift range selected by the color criteria. Additional interpretation is that the EROs at are progenitors of present-day early-type galaxies (McCarthy et al. 2001).
Spectroscopy of EROs provides additional information on their physical properties. The spectral properties set constraints on their star formation history and stellar populations. Similar to the earlier spectroscopic work on the individual sources HR 10 (Graham & Dey 1996) and CL0939+4713B (Soifer et al. 1999), spectroscopy of a sample of 30 EROs from the K20 survey (Cimatti et al. 2002) also found that EROs are a mix of both emission line and absorption line systems, in a ratio of 11. Based on the presence of emission lines, Cimatti et al. (2002) concluded that 50% of their ERO sample are dusty star-forming galaxies and the remaining 50% are early-type systems. This conclusion is based on an assumption that the galaxy spectral classes correspond to the galaxy morphological classes.
Combining high resolution imaging from HST with ground-based K-band images, we carried out a morphological study of 115 EROs selected with ( mag. (Yan & Thompson, 2003; hereafter Paper I). We found that only 305% of the EROs have morphologies consistent with a pure bulge or bulge-dominated galaxy (equivalent to E/S0), while disks comprise 647% of the sample. Only 6% of the EROs remained unclassifiable. Mergers or strongly interacting systems, which include sources from both classes, make up 174% of the full sample. These results suggest that the nature of EROs are complex. High resolution morphologies as well as spectroscopy are needed to better understand this population at high redshifts.
The heterogeneous nature of EROs selected by their optical/near-IR colors has also been highlighted by X-ray and sub-millimeter observations. Deep Chandra and XMM observations of EROs with reveal that roughly 15–20% of EROs are detected in hard X-rays, consistent with their being obscured Active Galactic Nuclei (AGN), while roughly another 15% are detected in the soft X-ray band, and are therefore either low-luminosity AGNs or starbursts (Alexandra et al. 2002; Brusa et al. 2002). The 850m observations of relatively bright EROs () produced a fairly low detection rate, only about 20% (Thompson 2003, private communication; Andreani et al. 1999; Mohan et al. 2002). This suggests that ULIRG type galaxies are relatively uncommon in bright ERO samples. However, deep near-IR observations (K) of sub-mm selected sources found that close to half of the 850m detections have very red colors, with 2.6 mag (Frayer et al. 2003).
We found in Paper I that there can be significant differences in the ERO populations selected by either mag. or mag. Both color selection criteria are sensitive to dust reddened galaxies and systems dominated by old stellar populations at a redshift of one. However, using the Bruzual & Charlot (Bruzual & Charlot, 1996) models, we showed in Paper I (Figure 8) that the EROs selected with ( mag. can include more systems which have somewhat prolonged star formation (e.g. Gyr galaxies), whereas the ( mag. selection would be biased against these types because star formation could contribute enough blue light to make the galaxy drop out of mag. selected sample. On another hand, criteria also selects a higher fraction of lower-z sources because the Balmer/4000A breaks are still effectively contributing to the colors. We should point out that ERO is no longer very useful designation, simply because galaxies selected are highly dependent on what color criteria and photometric depths of the data. Different color selections inevitably produce different galaxy samples with different properties. It is important to understand these differences before making any comparisons between surveys using different color selections.
To complement the morphological study carried out in Paper I, we have obtained spectroscopic observations for a subset of the EROs from Paper I. The goal was to determine the redshift distribution, luminosity functions, spectral properties, and to map out the correspondence between the morphologies and spectral types. Throughout the paper, we used the cosmology of , and H km/s/Mpc.
2 Observations and Reductions
We obtained spectroscopic observations for 36 sources from the original sample of 115 EROs, which have a median of 187 and mag. Because the positions of the EROs in our sample are distributed all over the sky (see Paper I), the spectroscopic target fields were primarily selected by their accessibility during the observing run, with priority given to fields containing higher numbers of EROs. No other selection criteria were imposed on the spectroscopic targets, and we obtained spectra for all of the EROs in each target field. We used the Low Resolution Imaging Spectrograph (LRIS, Oke et al. 1995) on the Keck i telescope on the nights of UT 2002 September 1-4. The weather conditions were not photometric and cirrus were present during all four nights. The seeing was around . The D680 dichroic and the 400 l/mm grating blazed at 8500Å in the LRIS red side were used to optimize wavelength coverage in the critical 8000 Å – 1 m region, where the strong spectral features, primarily [O II] emission and Ca II HK absorption, are expected for galaxies. In the LRIS blue side, we used the 300 l/mm grating blazed at 5000 Å. Multi-slit masks were set up for all WFPC2 fields containing two or more EROs, using wide slits. In order to facilitate sky subtraction, we dithered the targets along the slits between successive exposures, with offsets of –. The integration time for each exposure was 1200 seconds. The total integration time for each multi-slit mask was 1–1.5 hrs.
The data were reduced using a suite of IRAF scripts written by Daniel Stern (private communication 2002). Each slitlet was treated as a separate, long-slit spectrum. Bias was subtracted by fitting low order polynomials to the overscan regions. The blue and red CCDs were read out using four and two amplifiers, respectively. The fitting was done for each overscan region for each amplifier separately. Sky lines were subtracted by fitting high order polynomials along the spatial direction in each two-dimensional (2D) spectrum. The order of this polynomial fitting was scaled to the length of the slit, with a minimum of three for the shortest slits. A fringe map was made by median combining the dithered 2D images, excluding the one from which the fringe map was subtracted, then the fringe map was subtracted from each of the 2D spectral images.
Cosmic ray removal was done on the individual images using the IRAF script SZAP from the DIMSUM package111Deep Infrared Mosaicking Software, a package written by Eisenhardt, Dickinson, Stanford and Ward, available at http://iraf.noao.edu/contrib/dimsumV2. First, the sky lines were modeled with polynomial fitting and taken out from each image. Then object spectra were removed by subtracting the median-combined and smoothed (with a 5x5 boxcar) images. Cosmic rays were identified by comparing the flux in the residual images to the expected noise calculated from the 2D model. Pixels affected by cosmic rays were replaced by the values from the model. The 2D spectra were not rectified before extracting the 1D spectra.
After the sky line subtraction and cosmic ray removal, all 2D spectra of a given ERO were shifted and average-combined to create the final stacked 2D spectrum. The IRAF task APALL was then used to extract the 1D spectra. The wavelength solutions were obtained from 3rd order polynomial fits to the sky lines in the object spectra. In the LRIS red side spectra, there were many sky lines for wavelength calibration, and the wavelength solutions have residual uncertainties less than 0.3Å. In the blue side, there are a fewer lines, with the residual uncertainties typically less than 1.0Å. Flux calibration was done using long slit spectra of several standard stars. The spectra of these bright stars were also used to remove the atmospheric absorption bands in the red LRIS spectra around 6867Å — 6944Å (B-band), 7168Å — 7394Å (b-band), and 7594Å — 7684Å (A-band). We note that the D680 dichroic produces a sharp drop of sensitivity around 6800Å in the spectra.
3 Results and Discussion
3.1 The Redshift Sample
Of the 36 targets observed, redshifts were obtained for 22 extragalactic EROs. We also identified one M star. Two additional EROs have redshifts from the Hawaii redshift survey (Cowie et al. 1996), which makes a total of 24 EROs with redshifts from the Paper I sample. The source identifications, K-band magnitudes (within an aperture diameter of 2.5 times the seeing disk), () colors, redshifts, quality ranks, emission line fluxes, morphologies, and spectral features used for the redshift measurements for the 24 EROs are listed in Table 1. The redshift quality rank describes how secure a redshift measurement is, where “a” is for redshifts measured from multiple, well detected spectral features, including both absorption and emission lines; “b” is for redshifts measured from multiple, but weak spectral features; and “c” indicates redshifts derived from only a single spectral feature. Figure 1 shows six representative spectra, 2 with emission lines and 4 with absorption lines, from our whole sample. The spectra in this figure are smoothed with a boxcar of 11 pixels (20 Åfor the LRIS red spectra and 16 Åfor the LRIS blue spectra). Among the six spectra shown in this figure, the three redshifts have quality a and the remaining three have quality b.
Figure 2 shows the redshift distribution. The median redshift of the sample is 1.14. The distribution is strongly peaked around this redshift, and weakly extends to both lower redshift () and higher redshift (). The fraction of interlopers is 8% (2/24) for our redshift sample. This estimate of low redshift EROs could have a large error because of the small size of our sample. The drop-off at the high redshift end of the distribution is due to fainter apparent magnitudes, redder colors because of higher K-corrections, and the strong spectral features moving out of our wavelength range. Figure 3 presents the distributions of the () color and the magnitude for both the sources with and without redshifts. The 13 sources without redshifts are 0.5 magnitude fainter in and 0.3 magnitude redder in the () color than the sources with redshifts. However, Figure 2 and Figure 3 also show that the sources with and without redshifts have overall similar properties, and that they appear to be from the same parent population.
As described in § 2, the 36 spectroscopic targets were selected by their accessibility during the observing run, with priority given to fields containing higher numbers of EROs; no other criteria were imposed. These 36 sources have roughly the same mix in morphological classes as in the original sample of 115 EROs. Specifically, the spectroscopic sample has 61% (22/36) of disks or disk dominated (D+DB) galaxies, and 34% (12/36) of bulges or bulge dominated (B+BD) systems, in comparison with 64% and 30% respectively in the original sample.
At the median redshift of our sample (), the morphologies are based on rest-frame B band light. The recent ERO morphology study (Moustakas et al. 2003) based on the HST/ACS F850LP (z band) images found a slightly higher fraction of bulges or bulge dominated galaxies (40%) and somewhat lower fraction of disk type of systems (40%). This is expected since the F850LP filter samples the light long-ward of 4000Å and thus is more sensitive to old stars.
Our success rate in measuring redshifts is high in the B+BD systems (10/12), but much lower in the D+DB galaxies (12/22). Among the 13 sources without redshift, the majority (10/13) are disk dominated galaxies with small bulges (DB); six have edge-on geometry. A simple reason for the high success rate in measuring redshifts for B+BD galaxies is because the ( mag. color limit is very effective in selecting the bulges or bulge dominated galaxies with predominantly old stars and little dust at . Our spectroscopic data (see § 3.4) provides further evidence for this. The spectroscopic bias against measuring redshifts for DB type sources could be due to several reasons. Star formation in some of these systems could be intrinsically weak, thus difficult to detect, especially for the edge-on disks which have inherently higher obscuration. In addition, the oldest stars and younger star forming regions form the strong spectral features we use for redshift identification. If the integrated light from the DB type EROs are mostly from intermediate age stellar populations, their spectra would have weaker spectral lines, thus it is more difficult to measure their redshifts.
3.2 The Rest-frame J-band Luminosity Function at
Ideally, when we trace the galaxy evolutionary history, we want to select a specific galaxy population at high redshift, e.g. z=1, and compare them with the low redshift sources which should have the same parent population at high redshift. Only such a fair comparison will give us a unbiased view of the galaxy evolution. Our redshift sample has a median redshift of 1, and is selected by the color of mag. and . These criteria should select most of luminous galaxies with SEDs of old stellar population at , except small number of dusty galaxies at lower redshifts and photometric errors causing sources scattered in-and-out of our selection. In principle, the photometric incompleteness could be quantified by simulations. However, in this paper, because our redshift sample is fairly small, the errors due to small number statistics will dominate our analyses. Thus, we will not go into the detailed simulation to quantify how complete our selection criteria sample the luminous galaxies with SEDs of old stellar population.
To understand the relation between the galaxies selected with mag. at and present-day massive galaxies, it is instructive to compare their luminosity functions, which describe the source density per co-moving volume per absolute magnitude in a certain filter band. As shown below, we will compare our rest-frame J-band luminosity function with the present-day J-band luminosity function for galaxies of all types (Cole et al. 2001), and with the rest-frame J-band luminosity functions at z=1.0 measured from the K20 survey (Pozzetti et al. 2003). Here we are limited to use the present-day J-band luminosity function for all galaxies types because there are no published data for early type galaxies. However, because the sources in our redshift sample are very luminous, our comparison is most limited to bright end of the luminosity function (as seen below). Therefore, the mismatch is probably very small.
At the median redshift of our sample (), the observed filter corresponds to the rest-frame band. We compute the absolute magnitude at the rest-frame J-band for an object with an apparent Ks magnitude at redshift of z, using the following equation:
| (1) |
Here A is the galactic extinction, which is generally very small, less than 0.04 magnitude in Ks band. The k-correction term, , describes the color difference between the observed and the rest-frame bandpasses (Oke & Sandage 1986; Kim, Goobar & Perlmutter 1997).
| -2.5log_10(∫Z(λ) S_J(λ) dλ∫Z(λ)SKs(λ) dλ) | (2) | ||||||
Here is the SED for Lyrae, is the filter transmission curve, is the assumed galaxy SED template. As shown above, includes the zero point difference between two different filters, as well as the color difference due to the redshifted SED (Kim, Goobar & Perlmutter 1997). At zero redshift, becomes the color of a galaxy with the assumed SED. We took the Lyrae SED from Bruzual & Charlot (1996) and the standard Mauna Kea and filter curves from Simons & Tokunaga (2002). The k-correction was computed for an early-type SED, and is -1.58 at . The uncertainties in k-correction due to different SEDs should be very small because at the observed Ks band is roughly equivalent to the rest-frame band.
We used the 1/Vmax method (Schmidt 1968; Felten 1976) to calculate the rest-frame J-band luminosity function. We adopted the cosmology with and H km/s/Mpc. The maximum co-moving volume for a source is defined as the volume within which the source could still be above the flux limit of the sample. In the 1/Vmax approach, the galaxy luminosity function , the number of galaxies per co-moving volume per absolute magnitude, is simply:
| (3) |
For each source within our redshift sample, we compute its maximum volume. Because of field-to-field differences in exposure times, atmospheric seeing, or dithering, our survey area is a function of the limiting magnitude. To account for this effect when calculating the volume factor used in the luminosity function, we integrated the survey area over the ten spectroscopic target fields as a function of magnitude (see Paper I for details). The resulting differential area histogram was then used to calculate an effective survey volume for each ERO with a spectroscopic redshift.
Figure 4 shows the rest-frame J-band luminosity function of the K-selected EROs at . The solid points are the measurements using only the sources with redshifts, whereas the circles are the measurements of the luminosity function including also the sources without any redshifts, by artificially setting their redshifts to the median redshift of 1.14. This is one of the crude ways to compute the incompleteness correction. Because our color criteria select galaxies within a relatively narrow redshift space, setting for galaxies without redshift measurement is not a far off approximation. The purpose of doing this is to demonstrate the approximate amplitude of the correction, rather than producing an accurate measurement.
In Figure 4, we compare our results with 1). the local J-band luminosity function (Cole et al. 2001) (solid curve in Figure 4); 2). the rest-frame J-band luminosity function at using a K-band flux limited spectroscopic sample (long dashed curve in Figure 4) (Pozzetti et al. 2003); 3). the rest-frame J-band luminosity function at for galaxies with pure absorption lines in the K20 survey (dotted curve in Figure 4, Pozzetti 2003, private communication). It is not surprising that our data points are somewhat higher than the dotted curve which indicates the LF for pure absorption line galaxies from the K20 survey. As shown by our results, selecting only pure absorption line galaxies will underestimate the volume density of old stellar populations at redshift of 1.0. Ideally, we should compare our result with the local J-band LF of early type galaxies, however, there is no published measurement in the literature. As discussed in the begining of this section, since our sources are mostly luminous () galaxies, the comparison with the local J-band LF for all galaxy types should not be too far off. The luminosity evolution between the local LF and the LF at z=1.0 from the K20 survey is roughly 0.7 magnitude (Pozzetti et al. 2003). Our measurements lie roughly along the dashed curve. The EROs are a color selected subset of a general K-band flux limited sample. The high volume density implied by our data points can be explained by the significant clustering in our ERO redshift sample, since the spectroscopic targets were selected with higher priority given to fields containing higher numbers of EROs. We computed the ERO surface density in our redshift sample, which is a factor of 2–3 higher than that of the original sample. This is a direct evidence that the EROs in our redshift sample are clustered within small volumes.
Although the rest-frame J-band luminosity function at we derived from our sample is highly biased, it does set an upper limit on the amount of luminosity evolution EROs could have if compared to the present-day L∗ luminous galaxies. Any properly selected ERO sample should be less clustered over a larger area, and its luminosity function would be lower compared to what we measured. Thus, we conclude that the luminosity evolution between bright EROs at and the present-day massive galaxies is small, about 0.7 magnitude.
We also compute the rest-frame J-band luminosity density from our data, which is , over the range of M of -24.0 to -26.0. The logrithmic of the rest-frame J-band luminosity density for galaxies brighter than -24, , is 19.86 Watt/Hz/Mpc3 and 20.02 Watt/Hz/Mpc3 for the redshift sample and the sample including sources without redshifts respectively. These numbers are slightly higher than the luminosity density computed from the rest-frame J-band LF at from the K20 survey, integrated from -24.0 to -26.0 ( Watt/Hz/Mpc3). Again, this could be explained by somewhat higher clustering in our small sample. In order to evaluate the amplitude of the evolution strength, we also compute the local J-band luminosity density, is 19.18 Watt/Hz/Mpc3, using the measurement from Cole et al. (2002). We found that luminosity density evolution between now and redshift of 1 is .
3.3 Correspondence between Morphologies and Spectral Types
[O II] 3727Å emission was detected in 12 of the 24 sources listed in Table 1. Thus, 50% of our sample with redshifts have emission lines, and the other 50% are pure absorption line galaxies. These percentages are the same as found in the K20 survey (Cimatti et al. 2002). In Paper I, we classified disks or disk dominated systems as D+DB, and bulge or bulge dominated as B+BD. The two spectral classes, emission line versus absorption line, have a similar mix of bulge and disk dominated morphological types. Specifically, among the 12 sources with [O II] 3727Å emission lines, 7 are D+DB and 5 are B+BD systems, while of the 12 absorption line sources, 7 are classified as D+DB and 5 as B+BD. The ERO morphological classes do not have a simple correspondence with the presence of emission lines or absorption lines. As stated in § 3.1, the redshift sample (24 sources) have slightly higher fraction of B+BD galaxies than that of D+DB, on a level of 10%. Considering our small size sample and large uncertainties, we do not attempt to correct for any morphological biases in the redshift sample.
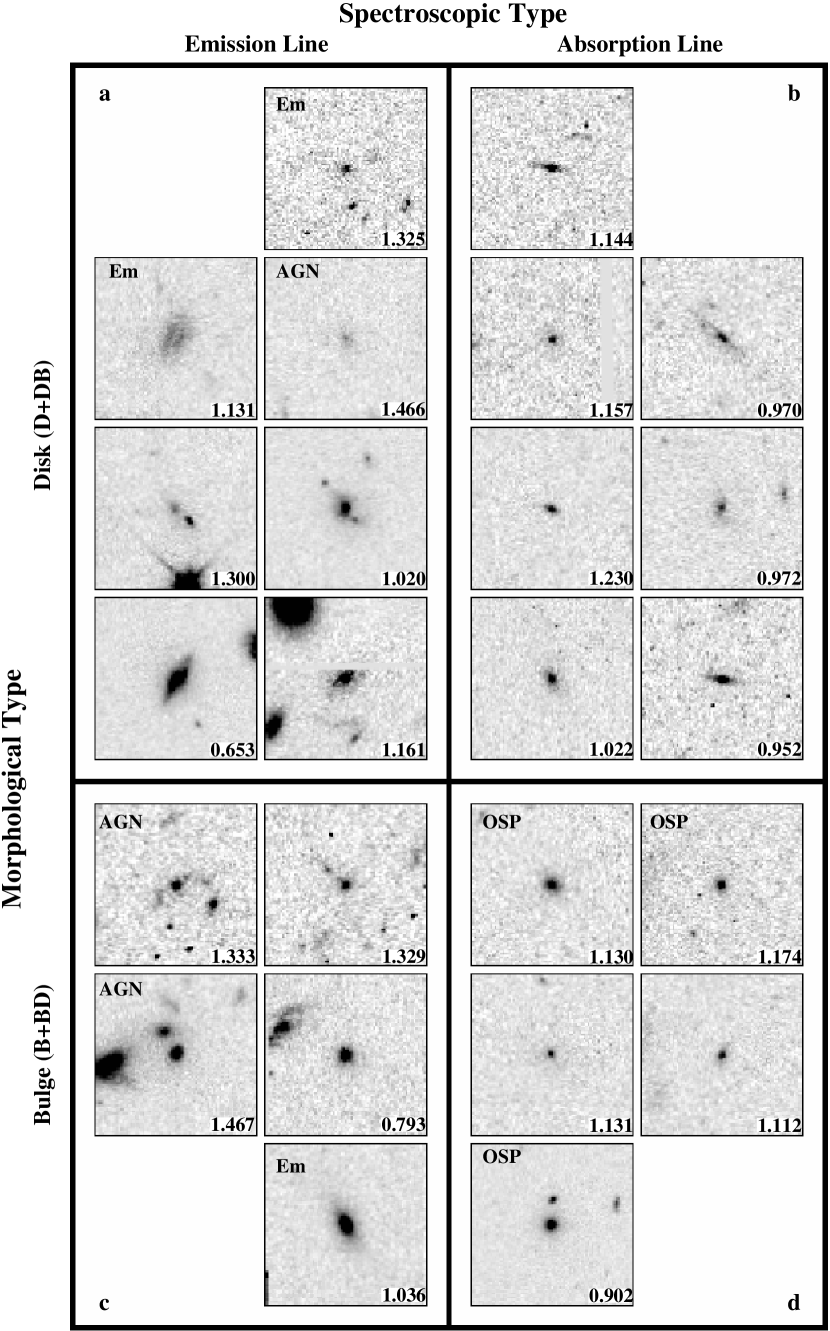
This result is visually shown in Figure 5 using the HST/WFPC2 stamp image of each ERO. The four panels in this figure present the four categories of EROs — (a) disks with emission lines, (b) disks with pure absorption lines, (c) bulges with emission lines, and (d) bulges with pure absorption lines. The emission line sources, including both bulges and disks (groups a and c), are at slightly higher redshifts and have slightly brighter magnitudes than the absorption line systems (groups b and d). The bulges with pure absorption lines are the reddest subset in the () color, but the two reddest systems are disks.
Figure 5.a shows the disks with emission lines. These systems are probably dust reddened, and also have star forming activity in their disks. One obvious example of dust reddening is shown in the second stamp image in panel a; the dust lane is clearly present in this galaxy. Figure 5.b shows the EROs which are morphologically classified as disk dominated but without detectable emission lines. These are the quiescent disks. In Paper I, we classified four of these as edge-on disks. It is possible that the inherently high obscuration in the edge-on orientation make the disks faint, while the central bulges are relatively unobscured and bright. This would also explain why these sources are at since the ( mag. criterion should select old stellar populations at these redshifts. Figure 5.c presents “rejuvenated old stellar populations”. These are the bulge dominated systems (B+BD) with emission lines. The HST/WFPC2 images show that these bulges with emission lines have clear indications of mergers/interactions, such as tidal tails, asymmetric nuclei or multiple faint companions. The star formation triggered by these interactions produces the detected emission lines. However, the dominant stellar populations in these bulges are old stars. Figure 5.d presents the five absorption line bulges (B+BD). Among them, three are pure bulges (no evidence of disks) which could be identified as passively evolving early-type galaxies at . The statistics (3/24) from our survey suggests that the fraction of this type of system is small, around 1015%. This result sets a strong constraint on the traditional galaxy formation scenario, in which massive ellipticals formed at high redshifts in a burst of star formation and passively evolved to the present day (Kauffmann & Charlot, 1998).
Excluding the three AGNs (see § 3.5) and the two sources without reported line fluxes from the Hawaii Redshift Survey (Cowie et al. 1996), the [O II] 3727Å line fluxes in the remaining seven sources are in the range of — ergs/s/cm2. These line fluxes are the raw measurements, not corrected for light losses due to the finite slit width or extinction. Using the conversion from Kennicutt (1998), where the star formation rate (SFR, M⊙ yr-1) = 1.4L[O II] (ergs/s), we calculate that the SFRs in these seven sources are in the range of – M⊙/yr. The star formation rates measured from the rest frame [O II] 3727Å line are only lower limits because dust extinction could be significant. The highest star formation rate in our sample is 6 M⊙/yr for ufg00_121, comparable to HR 10 (Dey et al. 1999), which has an [O II] star-formation rate of 4.8 M⊙/yr in our assumed cosmology model. HR 10 is a massive dusty starburst based on millimeter and sub-mm observations, suggesting that ufg00_121 could be a similar system. Clearly longer wavelength observations using SIRTF and SCUBA are required to measure the total star formation rates for the very dusty systems.
The global volume-averaged star formation rate is shown to rise steeply from the present day to redshifts of 1 — 2 (Madau et al. 1996; Lilly et al. 1996; Yan et al. 1999). The morphological properties observed in our ERO sample and the high fraction of star forming systems could be largely due to this evolutionary effect at . Finally, our observed result could also be due to the color selection. The ( mag. color selects more old, red bulges with small disks or residual star formation (S0, Sa like systems) than what is selected with an mag. criterion. This is mainly because the -band is more sensitive to star formation. More details about this color selection effect are given in Paper I.
3.4 Old versus Young Stars
The presence of nebular emission lines, such as [O II] 3727Å in spectra are a sensitive probe of recent star formation. Although half of our redshift sample have [O II] emission, the spectra of most sources have not only very red continua but also absorption line features, such as H+K, G-band, or a 4000 Å break. These features are the indicators of old stars. Specifically, excluding two EROs from the Hawaii Redshift Survey (Cowie et al. 1996), we have 19 spectra which show absorption lines, seven of which also have emission lines. Only three EROs have pure emission line spectra. This implies that a large fraction (19/22) of the EROs in our redshift sample, including both bulge and disk dominated systems, have mostly old stellar populations with an additional small amount of young stars formed more recently. A good example is shown in the bottom panel of Figure 1, u2fq1_085. The morphology of this ERO shows a prominent bulge with a faint disk; the red portion of its spectrum clearly shows absorption features from old stars in the bulge and the blue portion of its spectrum has an [O II] 3727Å emission line, indicating star forming activity in the disk. Early-type galaxies with recent star formation are also found in the field (Treu et al. 2002; van Dokkum & Stanford 2002). Thus, using only the presence of emission lines as the diagnostic to separate EROs into the two categories of early-type versus dusty star forming systems can lead to significant mis-classification.
At the other extreme, three EROs, ufg00_121, u2fq1_130 and u2fq1_115, have only [O II] 3727Å emission, and no detectable absorption lines. The red continua observed in these three sources are probably due to dust extinction. Two of these EROs have disk type morphologies, the other is a bulge. They are the most likely candidates for being very dusty and having strong star formation like HR 10 (Dey et al. 1999). [O II] 3727Å emission was detected in HR 10, with an uncorrected SFR of 4.8 M⊙/yr. Its spectrum shows a very red continuum but no significant absorption lines.
Figure 6 shows the () color as a function of the redshift for the sample listed in Table 1. In the figure, the model curves are calculated using the Bruzual & Charlot (1996) spectral energy distributions (SED), with different assumptions on the star formation history. The solid dots identify the three bulges with absorption line spectra. These systems could be pure passively evolving early-type galaxies formed in a rapid star burst at high redshift, evolving only passively since then. Since their colors are slightly redder than the Gyr models, this could suggest that there is a small amount of dust in these galaxies. Our data alone can not discriminate the models with two very different formation redshifts.
The open circles in the figure indicate the remaining 88% (21/24) of the sample, which have large or small disks, as well as the bulges with emission lines. The observed colors of these EROs are consistent with the colors from the three models, where dust, multiple epochs of star formation, and old stellar populations all could play some role in determining their colors. This highlights the complex physical properties of EROs at .
Ultimately, the goal is to obtain more quantitative estimate of what fraction of the K-band light is due to old stars in these optical/near-IR color selected galaxies. In principle, this can be done if one has high S/N spectra and good broad band photometry. Stellar population synthese models could be used to fit both broad band SEDs, as well as emission line and absorption line spectra. This will decompose the stellar population and quantitatively measure the fraction of K-band light due to old stars. Although our current data does not permit us doing this analyses, in the future, such analyses should be done properly with better datasets.
3.5 AGNs and Clusters
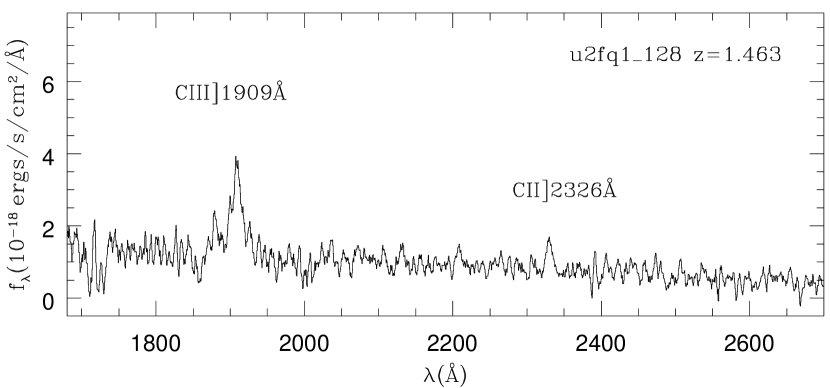
Three EROs in our redshift sample have AGN signatures. Both u2fq1_128 and u2fq1_389, show C III] 1909Å and C II] 2326Å semi-forbidden emission lines in their spectra. Figure 7 shows the spectrum of u2fq1_128, smoothed with a boxcar of 5 pixels (7.3Å). The observed full widths at half maximum (FWHM) in the emission lines are about 3740 km/s for u2fq1_128 and 790 km/s for u2fq1_389. The source u2fq1_128 is classified as a bulge dominated system, while u2fq1_389 has a faint disk (Paper I). Both are likely dust-shrouded, low-luminosity AGN, with the broad-lined u2fq1_128 being a Seyfert I galaxy and the narrower-lined u2fq1_389 being a Seyfert II or LINER galaxy.
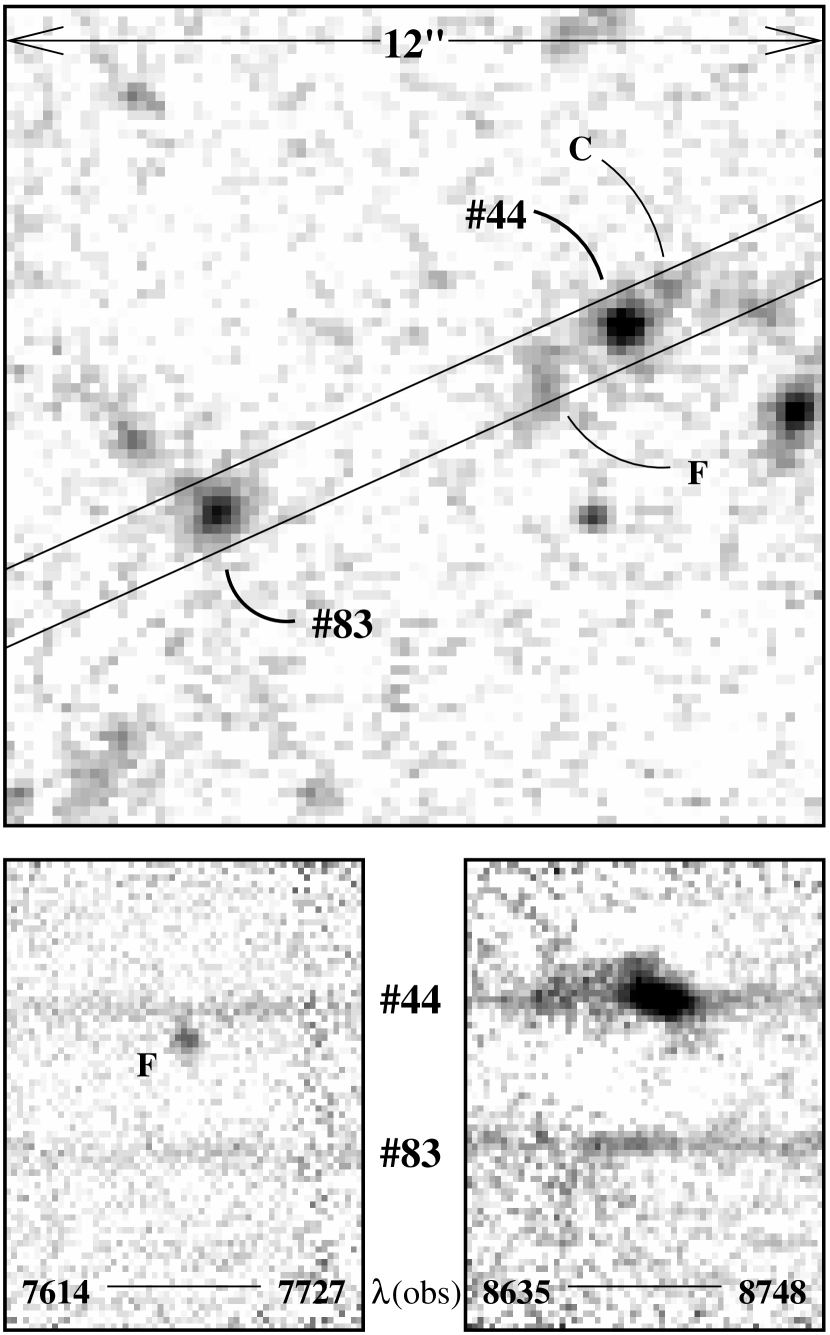
The third AGN is ufg00_044. The top panel in Figure 8 shows the HST/WFPC2 F814W images of ufg00_044 and ufg00_083. These two EROs are separated by 6.6 arcseconds (56 kpc projected separation), both have [O II] 3727Å emission lines and are at (Figure 5, bottom left panel). These two EROs are clearly situated in a high density region, with evidence for ongoing merging/interaction. The slit went through both ERO ufg00_044 and ufg00_083, as well as two fainter galaxies. In Figure 8, the bottom right panel shows the 2D spectra in the observed wavelength region of 8635 — 8748Å, and that ufg00_044 has a broad [O II] 3727Å line. The observed velocity width is 609 km/s. In addition, it also has [Ne III] 3867Å emission (not shown in Figure 8), confirming the bright line is [O II] 3727Å. Object ufg00_044 is clearly in an actively merging environment. The velocity extension above its broad [O II] line probably comes from the close companion (C). Perhaps this close interaction is the trigger of its AGN activity. The bottom left panel in Figure 8 covers the wavelength from 7614 — 7727Å; the emission line source with no detected continuum between the two EROs is object F. Its spectrum has two emission lines, H and [O III] 5007Å, and is a foreground galaxy at . The [O III] 4959Å falls within the atmospheric absorption A band, and thus this line is only weakly detected.
The one mega-second Chandra observation in the HDF revealed that about % of mag. selected EROs are detected in the hard X-ray band and are AGNs (Alexander et al 2002). We detect 3 AGNs out of 24 EROs with redshifts, which is consistent with the X-ray studies. Two of these AGNs have () colors of 4.10 and 4.16, and are both bulge dominated; the third AGN has an () color of 5.25 and disk morphology. The red colors from these three AGNs could be due to a combination of dust extinction and the presence of old stellar populations.
The sources observed are in ten different WFPC2 fields (Table 1), each of which is slightly less than . Among these ten fields, four contain EROs clustered in redshift space, likely tracing the high concentration regions of large scale structures. The two AGNs, u2fq1_128 and u2fq1_389 are at similar redshifts, 1.467 and 1.466. In the u2845 field, we find three sources at . One is an ERO, while the other two are serendipitous detections at similar redshifts. In the ufg00 field, a group of three EROs ufg00_083, ufg00_044, and ufg00_121, are identified at . All three have [O II] 3727Å emission lines, and their morphologies show clear signatures of recent interactions. In the uim03 field, sources uim03_100 and uim03_089 are at . Although these EROs don’t necessarily belong to clusters of galaxies at , they are clearly situated in high density environments. These sources do not show a preference for any morphological or spectral types. The magnitudes, colors, morphologies, and spectral properties presented in this paper and Paper I suggest that the -selected EROs are probably massive, luminous systems at . These systems tend to be strongly clustered, tracing peaks of the mass density field, as found by other wide field surveys (Daddi et al. 2000a; McCarthy et al. 2002; Roche et al. 2002).
4 Summary
We obtained deep spectroscopic observations for 36 sources among the original 115 EROs, which were selected in Paper I with ( and have a mean 187. The major conclusion of Paper I is that a large fraction of EROs (64%) are disks or disk dominated galaxies, while only 30% have bulge or bulge dominated morphologies. Of the 36 spectroscopic targets, we were able to determine redshifts for 22 sources. We found that half of the redshift sample have [O II] 3727Å emission, while the remaining half are pure absorption line systems. The two broad spectral classes (emission versus absorption line) have an equal mix of bulge and disk dominated galaxies. If we include the sources without redshifts (the total sample of 36), the fractions of emission line and the pure absorption line systems are 1/3 respectively. It appears that the spectral class does not have a simple, direct correspondence with the morphological type. Detecting [O II] 3727Å emission in 50% of the redshift sample implies that recent star forming activity is fairly common among the EROs. However, we found that although 50% of the sample have star formation, there are significant populations of old stars in the majority of the sample. This is supported by the evidence that a large fraction of the spectra (19/22) in our sample not only have very red continua, but also absorption features which are indicative of old stars. Only three EROs have pure emission line spectra, with no significant absorption. They are the most likely candidates for dusty starbursts.
The results from this paper and Paper I have significant implications for the theories of galaxy formation and evolution. First, the strong ERO clustering measured by recent wide field near-IR surveys (McCarthy et al. 2001; Daddi et al. 2000a) are generally interpreted as the evidence that EROs selected by a single optical/near-IR color are the progenitors of present-day ellipticals. However, our detailed studies using HST/WFPC2 images and Keck spectroscopy show that the properties of these EROs are fairly complex; a significant fraction of EROs have disks and/or signs of mergers/interactions. For these EROs to evolve to present-day ellipticals, major mergers would be required in order to re-distribute old stars, and consume all the gas in the disks on a time scale of a few billion years (from to the present-day) (Kormendy & Sanders 1992; Shioya & Bekki 1998). This implies that most of the EROs would still need to go through a starburst phase. Sensitive far infrared observations from SIRTF will be very useful to measure the volume densities of dusty starbursts between and the present-day. This will allow us to draw more quantitative connections among EROs, dusty starbursts and the present-day early-type galaxies.
Second, the fraction of isolated, passively evolving old stellar populations at is small, roughly 1015%. Clearly the generic scenario, where massive ellipticals are rapidly formed at high redshifts (Eggen, Lynden-Bell & Sandage 1962) and then evolve passively, should be limited to only a small fraction of the entire early-type galaxy population. Previous measurements of the number density of pure passively evolving old stellar populations based on a single color selection or optical spectroscopic classification (Daddi, Cimatti & Renzini, A. 2000b) are probably over-estimated.
The rest-frame J-band luminosity function derived from our sample suggests that the luminosity evolution between EROs at and the present-day massive galaxies is probably not very large. More accurate measurements would require a larger and more complete redshift sample with high resolution images from HST. There exists several deep and large datasets useful for this. A complete redshift survey of these datasets would provide important information for understanding the nature of the EROs.
5 Acknowledgment
We thank Daniel Stern for his generous help and providing his software for the LRIS data reduction. D. Thompson acknowledges partial support from the NASA LTSA grant NAG5-10955. LY and DT acknowledges the funding for this research by the HST grant AR-08756. LY and BTS are supported by the SIRTF Science Center at Caltech. SIRTF is carried out at the Jet Propulsion Laboratory, operated by California Institute of Technology, under contract with the National Aeronautics and Space Administration. The spectroscopic data presented herein were obtained at the W.M. Keck Observatory, which is operated as a scientific partnership among the California Institute of Technology, the University of California, and the National Aeronautics and Space Administration. The Observatory was made possible by the generous financial support of the W.M. Keck Foundation. We also wish to recognize and acknowledge the very significant cultural role and reverence that the summit of Mauna Kea has always had within the indigenous Hawaiian community. We are most fortunate to have the opportunity to conduct observations from this mountain.
References
- Alexander (2002) Alexander, D.M., Vignali, C., Bauer, F.E., Brandt, W.N., Horschemeier, A.E., Garmire, G.P., Schneider, D.P. 2002, AJ, 123, 1149
- Andreani et al. (1999) Andreani, P. Cimatti, A., Röttgering, H., & Tilanus, R. 1999, Ap&SS, 266, 267
- brusa (2002) Brusa, M., Comastri, A., Daddi, E., Cimatti, A., Vignali, C. 2002, in Workshop on X-ray Spectroscopy of AGN with Chandra and XMM-Newton, MPE Report 279, 267
- Bruzual & Charlot (1996) Bruzual, G. & Charlot, S. 1996, ftp://gemini.tuc.noao.edu/pub/charlot/bc95
- Cimatti et al. (2002) Cimatti, A., Daddi, E., Mignoli, M., Pozzetti, L., Renzini, A., Zamorani, G., Broadhurst, T., Fontana, A., Saracco, P., Poli, F., Cristiani, S., D’Odorico, S., Giallongo, E., Gilmozzi, R., & Menci, N. 2002, A&A, 381, 68
- cole (2001) Cole, S. et al. 2001, MNRAS,326, 255
- Cowie (1996) Cowie, L.I., Songaila, A., Hu, Ester, M., Cohen, J.G. 1996, AJ, 112, 839
- connolly (1997) Connolly, A., Szalay, A.S., Dickinson, M., Subbarao, M., & Brunner, R.J. 1997, ApJ, 487, L13
- Daddi et al. (2000) Daddi, E., Cimatti, A., Pozzetti, L., Hoekstra, H., Röttgering, H.J.A., Renzini, A., Zamorani, G., & Mannucci, F. 2000, A&A, 361, 535
- Daddi (2000) Daddi, E., Cimatti, A. & Renzini, A., 2000, A&A, 362L, 45
- davis (1976) Davis, M. & Geller, M.J. 1976, ApJ, 208, 13
- dey (1999) Dey, A. et al. 1999, ApJ, 519, 610
- dokkum (2000) van Dokkum, P. & Stanford, A. 2001, ApJ, 562, L35
- eggen (1962) Eggen, O.J., Lynden-Bell, D., Sandage, A.R., 1962, ApJ, 136, 748
- Felton (1976) Felten, J.E. 1976, ApJ, 207, 700
- frayer (2003) Frayer, D. et al. 2003, AJ, in prep.
- Graham (1996) Graham, J. & Dey, A. 1996, ApJ, 471, 720
- Kennicutt (1998) Kennicutt, R. 1998, ARA&A, 36, 189
- kauffmann (1998) Kauffmann, G. & Charlot, S. 1998, MNRS, 297, L23
- kim (1997) Kim, A., Boobar, A. & Perlmutter, S. 1996, PASP 108, 190
- kormendy (1992) Kormendy, J. & Sanders, D. 1992, ApJ, 390, L53
- lilly (1996) Lilly, S.J., Le Fevre, O., Hammer, F., Crampton, D. 1996, ApJ, 459, 142
- madau (1996) Madau, P., Ferguson, H.C., Dickinson, M.E., Giavalisco, M., Steidel, C.C., Fruchter, A. 1996, MNRAS, 283, 1388
- Mohan et al. (2002) Mohan, N.R., Cimatti, A., Röttgering, H.J.A., Andreani, P., Severgnini, P., Tilanus, R.P.J., Carilli, C.L., & Stanford, S.A. 2002, A&A, 383, 440
- moustakas (2003) Moustakas, L. et al. 2003, ApJL, in press
- McCarthy et al. (2001) McCarthy, P.J., Carlberg, R.G., Chen, H.-W., Marzke, R.O., Firth, A.E., Ellis, R.S., Persson, S.E., McMahon, R.G., Lahav, O., Wilson, J., Martini, P., Abraham, R.G., Sabbey, C.N., Oemler, A., Murphy, D.C., Somerville, R.S., Beckett, M.G., Lewis, J.R., & MacKay, C.D. 2001, ApJ, 560, L131
- oke (1968) Oke, B. & Sandage, A. 1968, ApJ, 154, 21
- oke (1995) Oke, J.B., Cohen, J.G., Carr, M., Cromer, J., Dingizian, A., Harris, F.H., Labrecque, S., Lucinio, R., Schaal, W., Epps, H., Miller, J. 1995, PASP, 107, 375
- Pozzetti (2003) Pozzetti, L., Cimatti, A., et al. 2003, A&A, 402, 837
- Roche et al. (2002) Roche, N.D., Almaini, O., Dunlop, J., Ivison, R.J., Willott, C.J. 2002, MNRAS, 337, 1282
- Schimdt (1968) Schmidt, M. 1968, ApJ, 151, 393
- simons (2002) Simons, D.A. & Tokunaga, A. 2002, PASP, ,114, 169
- Soifer et al. (1999) Soifer, B.T., Matthews, K., Neugebauer, G., Armus, L., Cohen, J.G., Persson, S.E., & Smail, I. 1999, AJ, 118, 2065
- shioya (1998) Shioya, Y. & Bekki, Kenji 1998, ApJ, 504, 42
- willmer (1998) Willmer, C.N.A., da Costa, L.N., Pellegrini, P.S. 1998, AJ, 115, 869
- yan (2003) Yan, L. & Thompson, D.J. 2003, ApJ, 586, 765
- yan (1999) Yan, L., McCarthy, P.J., Fruedling, W., Teplitz, H.I., Malumuth, E.M., Weymann, R.J., Malkan, M.A. 1999, ApJ, 519L, 47


| ID | MDS ID | /Color | z/Q11The quality of the redshift measurements are ranked from high to low as a, b, and c. | Flux22The [O II] 3727Å emission line fluxes are in units of ergs/s/cm2. The two sources whose redshifts were taken from the Hawaii Redshift Survey don’t have published [O II]3727Å line fluxes. | Morph33Morphology from Paper I: DDisk, DBDiskBulge, BDBulgeDisk, BBulge | Emission44Emission features: [O II] 3727Å, [NeIII] 3867Å, MgII 2802.7Å, C III], C II]; Absorption features: HKCa II H and K lines, 4000Åis the 4000Å break, 2900Åis the 2900Å break, FeI+MgI are absorption lines at 3840Å and 3580Å G-band 4303Å. | Absorption44Emission features: [O II] 3727Å, [NeIII] 3867Å, MgII 2802.7Å, C III], C II]; Absorption features: HKCa II H and K lines, 4000Åis the 4000Å break, 2900Åis the 2900Å break, FeI+MgI are absorption lines at 3840Å and 3580Å G-band 4303Å. |
|---|---|---|---|---|---|---|---|
| 2 | ufg00_070 | 18.27/5.23 | 1.144/b | DB | H+K | ||
| 3 | ufg00_121 | 18.29/4.27 | 1.325/a | 3.90 | D | [O II] | H+K |
| 4 | ufg00_044 | 17.68/4.16 | 1.333/a | 15.1 | B | [O II], [NeIII] | H+K |
| 5 | ufg00_083 | 18.05/4.60 | 1.329/b | 0.58 | B | [O II] | H+K |
| 7 | udh00_057 | 18.58/4.05 | 1.157/c | D | 4000Å? | ||
| 9 | ueh02_063 | 17.43/4.82 | 1.130/b | B | H+K, FeI+MgI | ||
| 12 | ubi02_055 | 18.49/4.03 | 0.970/c | D | 4000Å | ||
| 13 | ubi02_062 | 18.46/4.71 | 1.174/a | B | H+K, 4000Å | ||
| 32 | uim03_102 | 18.60/4.04 | 1.230/b | DB | H+K, 4000Å | ||
| 33 | uim03_089 | 18.57/4.02 | 1.131/b | BD | H+K, 4000Å | ||
| 34 | uim03_100 | 18.34/4.51 | 1.112/b | BD | H+K, 4000Å | ||
| 35 | uim03_075 | 17.94/4.63 | 0.972/a | DB | H+K, 4000Å, G-band | ||
| 78 | u2845_050 | 17.95/4.14 | 0.902/a | B | H+K, G-band, MgII | ||
| 94 | u2fq1_130 | 17.91/4.05 | 1.131/a | 1.40 | D | [O II] | |
| 95 | u2fq1_389 | 18.39/5.25 | 1.466/a | 1.85 | D | [O II], CIII] CII] | 2900Å? |
| 97 | u2fq1_273 | 18.15/4.43 | 1.300/a | 1.26 | ID | [O II] | H+K |
| 99 | u2fq1_128 | 17.37/4.10 | 1.467/a | 1.72 | B | [O II], MgII, CIII] CII] | |
| 104 | u2fq1_085 | 17.04/4.29 | 0.793/a | 1.66 | BD | [O II] | H+K, H, H9, G-band |
| 105 | u2fq1_115 | 17.86/4.31 | 1.036/a | 0.56 | B | [O II] | |
| 109 | u2h91_03455These two redshifts are from the Hawaii redshift survey (Cowie et al. 1996). | 17.70/4.27 | 1.020/a | DB | [O II] | ||
| 110 | u2h91_01155These two redshifts are from the Hawaii redshift survey (Cowie et al. 1996). | 17.25/4.14 | 0.653/a | D | [O II] | ||
| 111 | u2fq2 | 17.58/4.34 | 1.161/a | 2.10 | D | [O II] | H+K, MgII |
| 113 | uec00_053 | 18.01/4.10 | 1.022/a | DB | H+K, MgII | ||
| 115 | uec00_047 | 17.81/4.36 | 0.952/b | D | H+K |