Gas Physics, Disk Fragmentation, and
Bulge Formation in Young Galaxies
We investigate the evolution of star-forming gas-rich disks, using a 3D chemodynamical model including a dark halo, stars, and a two-phase interstellar medium with feedback processes from the stars. We show that galaxy evolution proceeds along very different routes depending on whether it is the gas disk or the stellar disk which first becomes unstable, as measured by the respective Q-parameters. This in turn depends on the uncertain efficiency of energy dissipation of the cold cloud component from which stars form.
When the cold gas cools efficiently and drives the instability, the galactic disk fragments and forms a number of massive clumps of stars and gas. The clumps spiral to the center of the galaxy in a few dynamical times and merge there to form a central bulge component in a strong starburst. When the kinetic energy of the cold clouds is dissipated at a lower rate, stars form from the gas in a more quiescent mode, and an instability only sets in at later times, when the surface density of the stellar disk has grown sufficiently high. The system then forms a stellar bar, which channels gas into the center, evolves, and forms a bulge whose stars are the result of a more extended star formation history.
We investigate the stability of the gas-stellar disks in both regimes, as well as the star formation rates and element enrichment. We study the morphology of the evolving disks, calculating spatially resolved colours from the distribution of stars in age and metallicity, including dust absorption. We then discuss morphological observations such as clumpy structures and chain galaxies at high redshift as possible signatures of fragmenting, gas-rich disks. Finally, we investigate abundance ratio distributions as a means to distinguish the different scenarios for bulge formation.
Key Words.:
ISM: kinematics and dynamics – ISM: structure – Galaxies: abundances – Galaxies: bulges – Galaxies: evolution – Galaxies: kinematics and dynamics1 Introduction
The formation of galaxies is one of the important questions in current astrophysical research. With HST and earth-bound 10m class telescopes it is now possible to study the evolution of galaxies with redshift by direct observation. Although no complete picture is available at the moment, some facts are well established. Surveys undertaken around have shown that luminous elliptical and spiral galaxies were largely formed by then, and have only moderately evolved to the present time (Brinchmann et al., 1998; Lilly et al., 1998; Abraham et al., 1999; Abraham, 1999; Abraham & Merrifield, 2000; Dickinson, 2000). Beyond , there are far fewer high-luminosity galaxies off all types compared to low redshifts (Dickinson 2000, see also Driver et al. 1998). Thus the bulge-to-disk Hubble sequence of galaxies appears to have formed at redshifts slightly beyond (Abraham & Merrifield, 2000; Kajisawa & Yamada, 2001), although part of the stellar populations of these galaxies might have formed earlier.
At spiral galaxies and barred galaxies are observed, and it seems that by then the full Hubble sequence is in place, quite similar to the galaxy distribution today. However, the frequency of barred galaxies drops sharply beyond (e.g., Abraham et al., 1999). van den Bergh et al. (2002) showed that this is not an selection effect. They shifted a local galaxy sample to higher redshifts and concluded that most of the barred galaxies would still be visible. Thus, the absence of bars at higher redshifts seems to be real.
Already at around of galaxies are morphologically peculiar. At higher redshifts many clumpy structures and compact objects are observed. Most of these cannot be attached to the traditional Hubble scheme, but show irregular morphologies (e.g., Abraham et al., 1996; van den Bergh et al., 2000). The anomalous morphologies observed in these high redshift objects cannot be explained through band-shifting effects alone, because the irregularities persist also in NICMOS observations (Dickinson, 2000), probing the visual restframe wavelength of these objects.
Observations of high redshift galaxies currently provide information only about the global properties of these objects. Detailed data like stellar metallicity distributions, stellar kinematics, or gas distributions are only available for local galaxies. To understand galaxy formation in a consistent picture, models must be developed that can be compared with observations over the whole observed redshift range. These models should be able to explain the properties of distant galaxies as well as the detailed data on local galaxies.
With high resolution cosmological simulations, large progress has been made in understanding cosmic structure formation (e.g., Navarro et al., 1996; Moore et al., 1998; Jenkins et al., 2001; Klypin et al., 2001). However, on galactic scales these simulations still lack the necessary resolution to describe the processes relevant for baryon dissipation and star formation. Therefore two approaches for describing galaxy formation and evolution have been developed. Semi-analytical modeling, based on simple assumptions to describe the baryonic physics and star formation in the dark halos that form in the cosmological simulations, has been used to analyze the global properties of galaxy samples (e.g., Kauffmann et al., 1993; Guiderdoni et al., 1998; Cole et al., 2000).
On the other hand, dynamical models, using a subset of the cosmological information as initial conditions on smaller scales, have been used to investigate the detailed structure of forming galaxies (e.g., Steinmetz & Müller, 1995; Navarro & Steinmetz, 1997; Sommer-Larsen et al., 1999; Williams & Nelson, 2001; Samland & Gerhard, 2003). These small-scale dynamical models still need to describe star formation with a simple parametrization, but they contain a much more detailed description of the dynamics, feedback, and, in some cases, element enrichment. Thus with these models it is possible to predict observable properties through the galaxy assembly process, and to compare directly with observations of high redshift galaxies (e.g., Contardo et al., 1998; Westera et al., 2002; Abadi et al., 2003). Because these models can be calculated over a Hubble time, one can also directly compare detailed present-day characteristics (e.g., metallicities and kinematics of stellar populations) with observations of local galaxies. Finally, with such models predictions can be made for dynamical and stellar population properties of high-redshift galaxies, which can be verified by future high resolution observations with the next generation telescopes.
The mass accumulation into dark matter halos is well understood in the context of the cosmological simulations and can be used as an input to model galactic evolution (e.g., van den Bosch, 2002; Wechsler et al., 2002). Additionally, the angular momentum distributions of the forming dark halos have been calculated recently (Bullock et al., 2001; Chen & Jing, 2002). It is widely accepted, both in the semi-analytical approach and the small-scale dynamical models, that galactic evolution depends sensitively on the mass and angular momentum distribution of the system.
Much less is known about the processes that govern the evolution of the baryons within a dark halo, and how these influence the properties of the forming galaxies. Stars in galaxies nearby are observed to form in molecular clouds much denser than the ambient medium in which these clouds are embedded. Most of the kinetic energy of this cloud fluid is in the motions of single clouds relative to the bulk flow. This kinetic energy can be dissipated by inelastic collisions (Larson, 1969) and augmented by supernova feedback (McKee & Ostriker, 1977). Under some conditions the macroscopic cloud system can be treated as an isothermal fluid (Cowie et al., 1980). Its energy dissipation rate is not well-determined, however. One expects that it depends on the geometrical structure of the clouds, on whether a major part of the dense medium is arranged in filaments, and on their self-gravitating structure and magnetic fields (Kim et al., 2001; Balsara et al., 2001). Thus the dynamics of the macroscopic cloud medium may be more or less dissipative, depending on the physical conditions, and may well vary between galaxies.
In the present paper we investigate the formation and dynamical evolution of galactic disks, varying the cloud dissipation rate. We use the interaction network and two-phase chemodynamical model of Samland & Gerhard (2003, SG03) to describe the assembly of a disk of stars, hot gas, and star-forming cold gas. We find that the dynamical stability of the disk depends sensitively on the cloud dissipation efficiency, here described by the parameter . For large , dynamical instabilities in the gas dominate the evolution, leading to fragmentation of the disk into a small number of star-forming clumps which subsequently merge to form a centrally concentrated bulge. For small , on the other hand, the system forms stars until the stellar disk becomes unstable, leading to a stellar bar at late times. The different stability properties in both cases can be quantified in terms of the effective Toomre parameter for the stellar, gaseous, and combined system (e.g., Toomre, 1964; Jog & Solomon, 1984; Wang & Silk, 1994; Elmegreen, 1995).
The evolution of a system with high dissipation calculated at higher resolution is described in Immeli et al. (2003), where it was shown that morphological and photometrical properties of several high redshift objects, like the chain galaxies (Cowie et al., 1995), can be explained by a fragmented disk model.
Several authors have suggested that galactic bulges can form by the secular evolution of a galactic disk, driven by interstellar gas or stars (e.g., Combes & Sanders, 1981; Pfenniger & Norman, 1990; Noguchi, 1999). Recent observations lend some support to these secular evolution scenarios. Bulges in late-type spirals show similar properties to their surrounding disks, in that their light profiles are better fit by an exponential rather than an law (Courteau et al., 1996; Seigar et al., 2002), and in their colours (Peletier & Balcells, 1996).
As shown here, the evolution of star-forming galactic disks may take different routes, depending on whether it is the gas or the stars that drives a disk instability. This in turn depends on the uncertain efficiency of energy dissipation in the cold cloud component. These different routes also lead to different formation scenarios for galactic bulges. Thus we suggest here that the morphological properties of galaxies may depend not only on cosmological variables like different mass or angular momentum distributions, or infall history, but also on internal physical processes during galaxy evolution.
In Sect. 2 we describe our model for star-forming disks. In Sect. 3 we describe the morphological evolution of these disks, depending on the dissipation efficiency of the cold gas. Sect. 4 discusses the stability and star formation rates in the models, and Sect. 5 describes the properties of the bulges that form in the two main evolutionary scenarios. Finally, Sect. 6 summarizes our findings.
2 The Model
We use a two-phase model for the interstellar medium, consisting of a hot, low-density phase and a cold cloud medium from which stars are formed. The chemical elements and most of the energy released from SNeII and later SNeIa are returned to the hot phase. However, the cloud velocity dispersion of the cold phase is heated by SNeII as well (McKee & Ostriker, 1977). We describe this system with a three-dimensional chemodynamical evolution code, which combines a hydrodynamical grid code for the two phases of the interstellar medium (ISM) with a particle mesh code for the stars. See SG03 for more details.
The interactions between the different ISM phases and the stars are described in detail in SG03. A difference exists in the characterization of the star formation rate (SFR), where we use here a simple Schmidt law (Schmidt, 1959),
| (1) |
with and chosen to be consistent with the star formation rule derived by Kennicutt (1998). We here adopt a volume density star formation threshold , converted from the surface density threshold of obtained from observations by Kennicutt (1998), assuming a disk scale height of the order of the spatial resolution of our model. Thus . This is a lower value compared to other thresholds used in the literature (e.g. Noguchi, 1999). It ensures that gas does not clump simply because it is below a high star formation threshold and cools when there is no heating from star formation.
SG03 did an extensive investigation of the network of processes connecting the different ISM phases in this model. We use their values for most of the efficiency parameters that occur in this network, as determined through either theory or observation. As shown by SG03, this network is strongly self-regulating, so that the system is not sensitive to the precise values used for these efficiencies. They conclude that the cloud dissipation efficiency is the most uncertain parameter in the model. We now describe the relevance of this parameter in somewhat more detail.
The dynamics of the cold cloud medium (CM) is described in a statistical way through the hydrodynamic moment equations. Energy dissipation and gain are implemented through sink and source terms to the moment equations. The internal energy describes the kinetic energy of the single clouds relative to the bulk motion. The CM cools through reducing this kinetic energy, which in this model is assumed to happen through inelastic collisions between single clouds. Larson (1969) derived the dissipation rate in a CM consisting of spherically symmetric clouds with constant mass. Using the mass-radius relation for clouds given by Elmegreen (1989) the internal energy change can be written as
| (2) |
where is the density of the CM, its velocity dispersion, and with denoting the pressure of the intercloud medium . All constants have been merged to . also contains the deviation of the effective cross section for cloud-cloud collisions from the geometrical value due to magnetic fields, self gravity, and gravitational focusing. It also depends on whether the cold cloud medium is arranged mostly in clumpy structures or mostly in filaments, which is not well-understood. Thus the precise macroscopic description of cloud dissipation on a galactic scale is uncertain, and hence the value of in eq. 2. It is therefore possible that the dissipation efficiency changes from one galaxy to another, and that this changes galactic evolution. It is equally possible that interstellar cloud physics is nearly universal, and that the main driver for galactic evolution is the baryonic infall rate per unit area, or disk growth time, as Noguchi (1999) has argued. In both cases, the local heating-collisional cooling equilibrium of the cloud medium is changed, and hence the star formation history.
To investigate the influence of cloud dissipation on disk evolution, we performed a sequence of simulations with different dissipation efficiencies . The values given in Table 1 are normalized to the efficiency used in SG03. The range of values corresponds to the maximum variations given in Table 1 of SG03.
| model index | [] | model index | [] |
|---|---|---|---|
| A | 20 | E | 1/5 |
| B | 10 | F | 1/10 |
| C | 5 | G | 1/20 |
| D | 1 |
The dynamical set-up of the models describes the rapid formation of a massive galactic disk in a pre-existing, static dark matter halo with NFW-profile (Navarro et al., 1997). According to Sommer-Larsen et al. (2002) the delayed infall of the baryonic matter into the relaxed halo can solve the angular momentum problem arising from CDM structure formation simulations. The primordial gas enters the simulation volume vertically at 15.5 kpc, and the infall is uniformly distributed over a radius of 17 kpc, with a rotation velocity equal to the circular velocity at the infall point. The infall rate is during one Gyr, resulting in a total mass of . The simulation volume has a diameter of 38 kpc and a vertical height of 31 kpc with a spatial resolution around 500 pc. The evolution of a higher-resolution simulation of model A is discussed in Immeli et al. (2003). The higher resolution does not lead to different results, which indicates that the outcome of our simulations is not sensitive to the resolution used.
The chemodynamical model naturally provides ages and metallicities of all stars formed over time, as well as ISM densities and metallicities. This enables us to calculate HST- and UBVRIJHKLM-colours of the model, including dust absorption. This is done using the method described in Westera et al. (2002), but we adopt here a three times lower absorption coefficient. We will use the observable colours to discuss the morphological evolution.
3 Morphological Evolution
3.1 Settling of the Disk
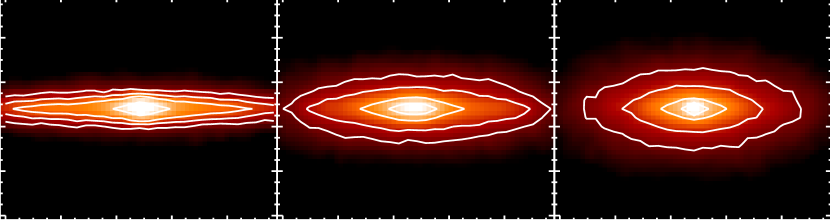
The infall of the baryonic matter leads to the build-up of a gaseous disk. The settling of the disk is shown in Fig. LABEL:settlingbild, which shows a cut through the -plane of the density distribution for the cold gas component in models B, D and F at different times. The energy feedback from the first stars heats up the disk. In consequence the settling of the disk takes longer than a free-fall timescale, depending strongly on the cloud velocity dispersion and hence on the cloud dissipation efficiency . Since the angular momentum does not play a role in the settling along the rotation axis, the -component of the velocity dispersion alone prevents the clouds from completely falling to the disk plane.
After 500 Myr the cold gas phase shows a filamentary distribution in all three models. This is caused by the local energy feedback of the first supernovae of type II (SNeII) to the gas. This leads to local variations in the velocity dispersion of the cloud medium, which act like the analogues of pressure gradients in the hot gas phase. Thus the cold gas is compressed. In addition, in regions with enhanced energy input, the equilibrium between hot and cold gas phases is shifted to decrease the density of the cold medium.
The model with high dissipation (B, first row) settles to a thin disk which is almost completely supported by rotation. The timescale for the settling is relatively short because the energy input from SNeII can be dissipated efficiently. The less efficient energy dissipation of model D causes the disk to settle more slowly. The disk in this model also remains thicker during the whole evolution, because the equilibrium between the continuous energy input from SNeII and energy dissipation by cloud collisions is shifted to higher internal energies and thus higher cloud velocity dispersions. This is even more true in model F, where the even less efficient energy dissipation results in a yet thicker disk.
3.2 Face-On Evolution
Fig. 2 shows an overview of the face-on morphological evolution of all our models, presented in terms of the V-band restframe surface brightness calculated from the distribution of stars as described in Section 2. Model indices are indicated at the left for each row, and time is indicated at the top for each column. All images are normalized to the same surface brightness magnitude interval, which enables us to directly compare luminosities of the models. The absolute V-magnitude of the galaxy is also given in each panel. Obviously, the morphological evolution depends strongly on the dissipation efficiency.
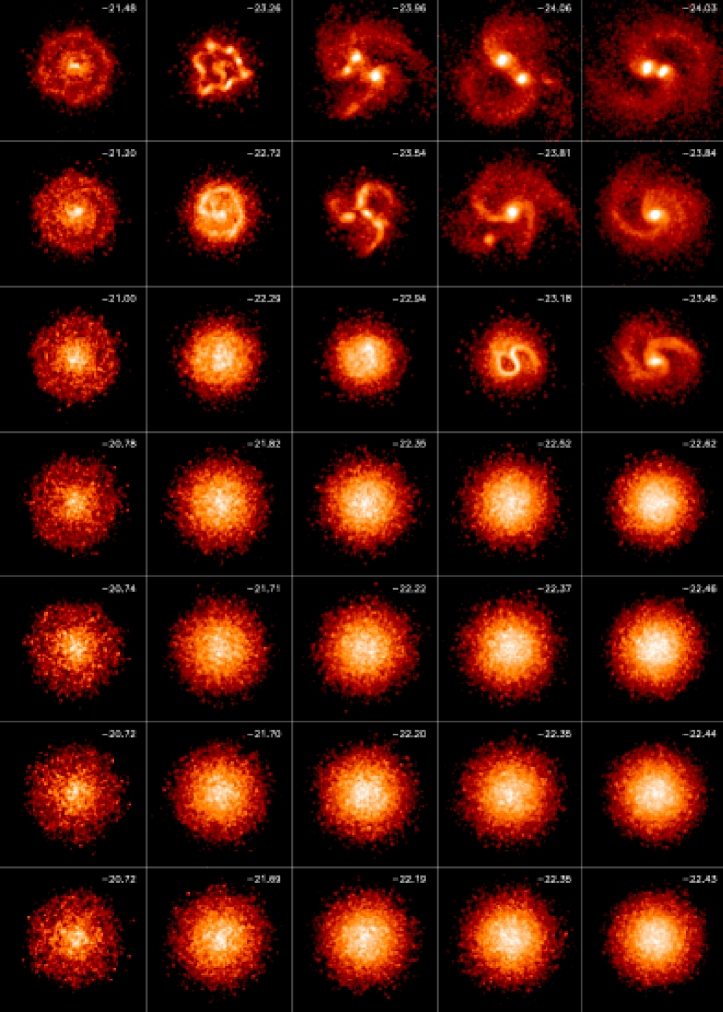
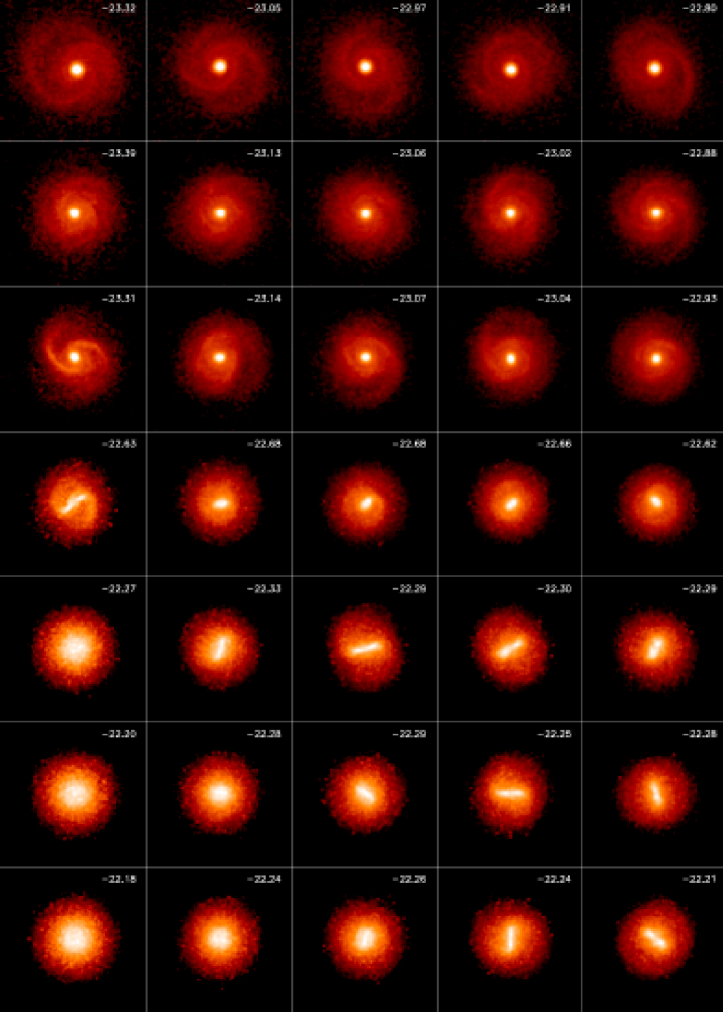
At 0.5 Gyr the formation of the disk is under way and none of the models shows an asymmetry in surface brightness yet. Generally, the colder models are brighter in absolute V-magnitude than their warmer counterparts. At 0.75 Gyr the coldest model (A) shows several knots of high density with enhanced star formation. In model B a ring like structure is visible. 200 Myr later the disks of these two models have fragmented, showing several nearby knots. At 1.05 Gyr some clumps in models A and B have already merged and fragmentation is also visible in model C. Whereas at 1.2 Gyr models D to G still show a symmetric surface brightness distribution, the clumps in models A to C have already fallen to the center and merged to form a bright bulge. This persists for the remainder of the simulation, together with a clear spiral pattern in the disk. Model D develops a bar like structure with spiral arms at around 2 Gyr. A very pronounced bar is visible in models E to G at around 2.8 Gyr. As can be seen in the last column of Fig. 2, these bars become shorter. Bar evolution is discussed further in Sect. 5.2.
The morphological evolution of models A, B, and C is similar in the sense that they all develop a fragmented disk and end up with a compact central concentration. Their exists a dependence on , in such a way that the more efficiently the gas dissipates energy, the more pronounced is the clumping, because the lower velocity dispersion in the more dissipative models counterbalances the gravitational instabilities less well. In all the cold simulations a ring develops. This ring structure probably results from the form of the rotation curve in these models; see Cha & Whitworth (2003); Gingold & Monaghan (1983). It is important to note that the mass enhancement in the ring amounts to less than 10% of the total mass in the cloudy medium.
The galaxy models A-C in their fragmented phase resemble, when viewed edge-on, the chain galaxies first reported by Cowie et al. (1995, CHS95). These are high redshift galaxies observed with HST in the Hawaii Survey Fields, with large major-to-minor axis ratios, knotty structures and very blue colors. CHS95 suggest that chain galaxies in the redshift range have a mass comparable to that of a present-day galaxy and that they represent a new population of galaxies. Our model favors the interpretation of O’Neil et al. (2000) that the chain galaxies are clumpy disk-like structures seen edge-on. Model A, recalculated with higher resolution, is compared to observations in detail in Immeli et al. (2003). The main results are that the extraordinary morphology as well as very blue colors observed by CHS95 are reproduced well. An investigation of the properties of the individual clumps in this model leads to typical stellar clump masses of a few . Metallicity differences between individual clumps are not larger than 0.25 dex and the influence of individual clumps on the rotation curve can by as high as .
A similarity in the evolution can also be seen in models E to G. In these models the disk remains symmetric for a much longer time. At around 2.7 Gyr these models then become bar unstable, and a very prominent bar develops in about one dynamical time. Contrary to the fragmented disk models, the absolute luminosity of the models showing a bar instability does not vary much over the simulated time interval. The evolution of model D lies somewhere in between these two cases, showing a bar with spiral arms at around 2 Gyr.
Comparing models A and B shows that no qualitative differences in the evolution are visible. The same is true for models F and G, which indicates that the chosen values of (Table 1) covers the whole relevant range.
4 Global Properties
4.1 Stability of the Disk
As shown in the previous section, our models can be divided in two groups according to their dynamical evolution: Models A to C show an early fragmentation, whereas in models E to G a bar instability occurs at later times. Model D appears to be a transition case. In the remainder of this paper, we confine the discussion to models B, D, F, as representative models for the different evolutionary paths. First, we relate these more quantitatively to the stability of the multicomponent disk. The Toomre parameter (Safranov, 1960; Toomre, 1964) is an important quantity in investigations of disk stability. In a single component gaseous disk is given through
| (3) |
where is the surface density, the epyciclic frequency, the gravitational constant, and is the radial velocity dispersion of the gas. is a well-defined stability limit for such disks: disks with low velocity dispersions and high surface densities such that are subject to radial instabilities.
In a disk consisting of gas and stars the evaluation of is more difficult. As described above, the interstellar material in our model consists of two gas phases. Because the hot intercloud medium (ICM) only makes up for about 1% of the total gas mass and because it is pressure dominated and therefore stable in a Toomre sense, we can neglect the ICM contribution to the Toomre parameter. Henceforth, we consider a composite for the stellar and the cold gas phases.
There have been several attempts to describe the stability of a two-component systems in the context of the Toomre parameter. Jog & Solomon (1984) derived a dispersion relation for a two-component system of stars and gas and evaluated it numerically. Romeo (1992) derived finite thickness corrections for disk systems. A simple approximation was inferred by Wang & Silk (1994)
| (4) |
where is the stellar surface density and is the radial velocity dispersion of the stars. Elmegreen (1995) gives a more accurate way of calculating the effective parameter for a two component disk. He reformulates the dispersion relation of Jog & Solomon (1984) in such a way that the derived is completely analogous to the one-phase . We use this more accurate method as well as the approach of Wang & Silk (1994) to evaluate for the two-phase medium. Since the results are the same, we will not further distinguish between the two methods.
Fig. 3 shows maps of , , and two-component for models B and F. The white regions in the maps denote those parts of the disk where the number of stellar particles in a grid cell in the plane is less than five and no secure stellar velocity dispersion and hence no reliable could be determined. These maps show clearly that the values can vary substantially between different parts of the disk, both radially and azimuthally.
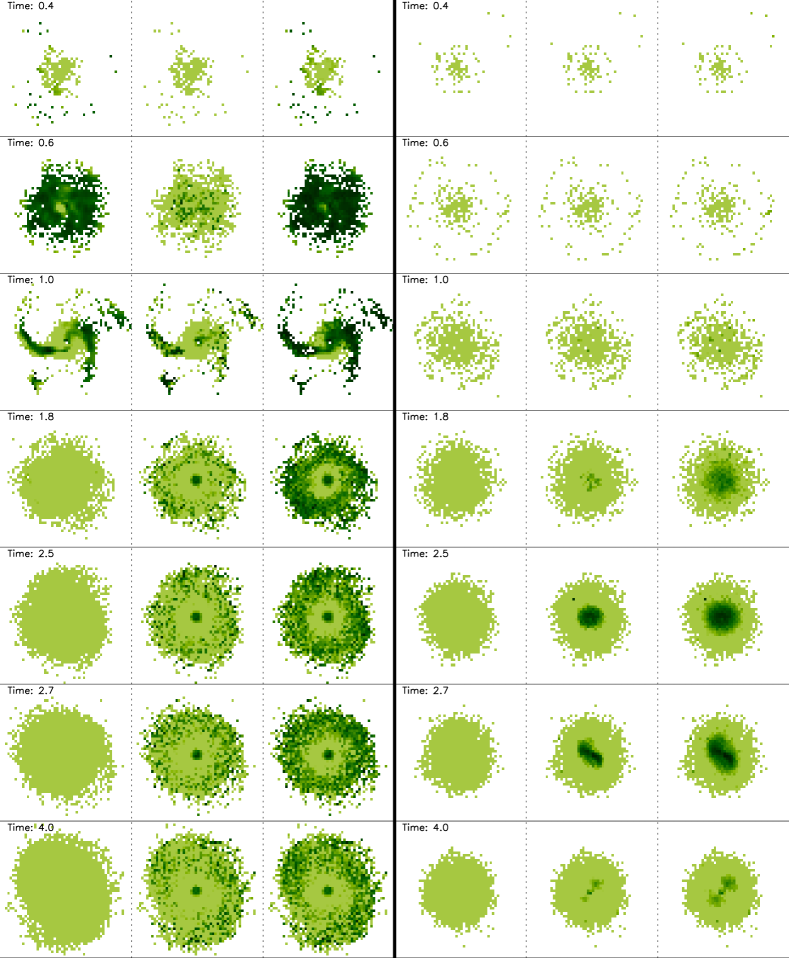
At around 0.4 Gyr, not many cells reach the stability boundary just discussed: all ’s have values above unity. Already at 0.6 Gyr the situation changes in model B. The gaseous component develops regions of instability, and reveals an unstable disk over a large radial range. For comparison, the disk of model F is still stable at 1 Gyr in both components as well as in the composite . In model B the violent evolution following the instability causes a sharp increase in the mean . The instability converts energy from ordered motions to random motions, as well as driving up the SFR and SN heating, which indirectly increases the cloud velocity dispersion and hence the Toomre parameter.
At 1.8 Gyr the stellar disk of model F has a central Toomre parameter around 1.5. The gaseous phase has a Toomre parameter of at least 2 and therefore is stable not only to radial but also to bar instabilities (Polyachenko, 1997). Nevertheless, the composite already approaches values around 1 in the center. Thereafter, drops further in the center, causing a bar instability at around 2.6 Gyr. The bar is visible in the instability map, but the signature becomes weaker as the bar evolves.
Globally, both models are stable after their respective instability, indicating that an equilibrium state has been reached and no further large morphological changes will occur (compare Sect. 5.2. However, model B remains marginally unstable in its outer parts, which drives the spiral pattern visible at late times (Fig.2). Consistent with the fact that this model has a thinner disk with higher rotational support than model F, the outer regions of the disk in model B also have a lower than in model F.
In summary, the most striking difference between the two models is that the instability in model F occurs in the stellar disk in the central regions, at comparably late times, whereas in model B the instability develops in the cold gas phase over the whole of the disk, starting early-on. Thus the different morphological evolution discussed in the previous section can be attributed to the instability emerging in different phases.
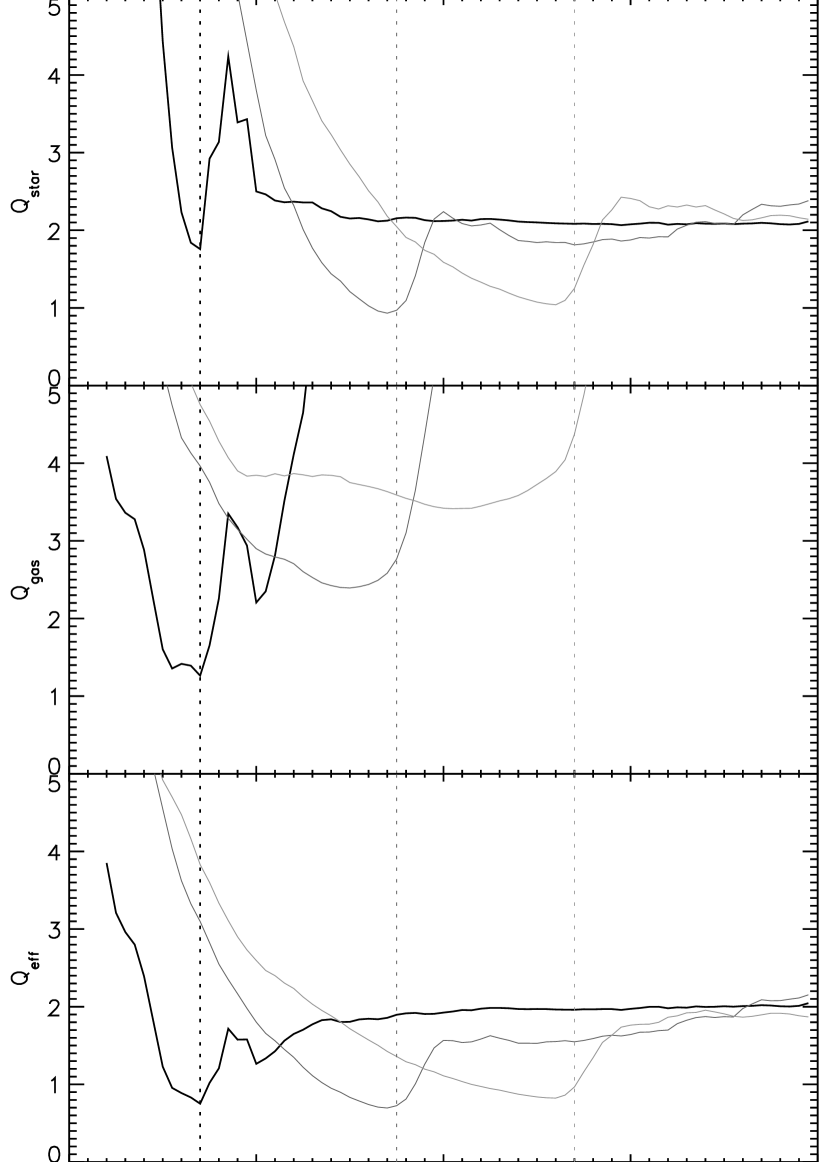
To investigate the time evolution of the Toomre parameter, we averaged it over a central circle with radius 2 kpc. The progression of this average is shown in Fig. 4. Again we see that different components trigger the instability in the different models. In all models, the instability starts when . This value should not be taken as an absolute limit for stability, however, since it depends on the radius over which the Toomre parameter is averaged. Nevertheless, this shows that is a good tracer of the instability. Also clearly visible is the increase of after the onset of instability.
4.2 Star Formation Rate
The different dynamical evolution along the sequence of models has a strong impact on the global star formation history. Fig. 5 shows the SFR as a function of time, for models B, D, and F. One immmediately recognizes large differences in the absolute values as well as in the shape of the SFR.
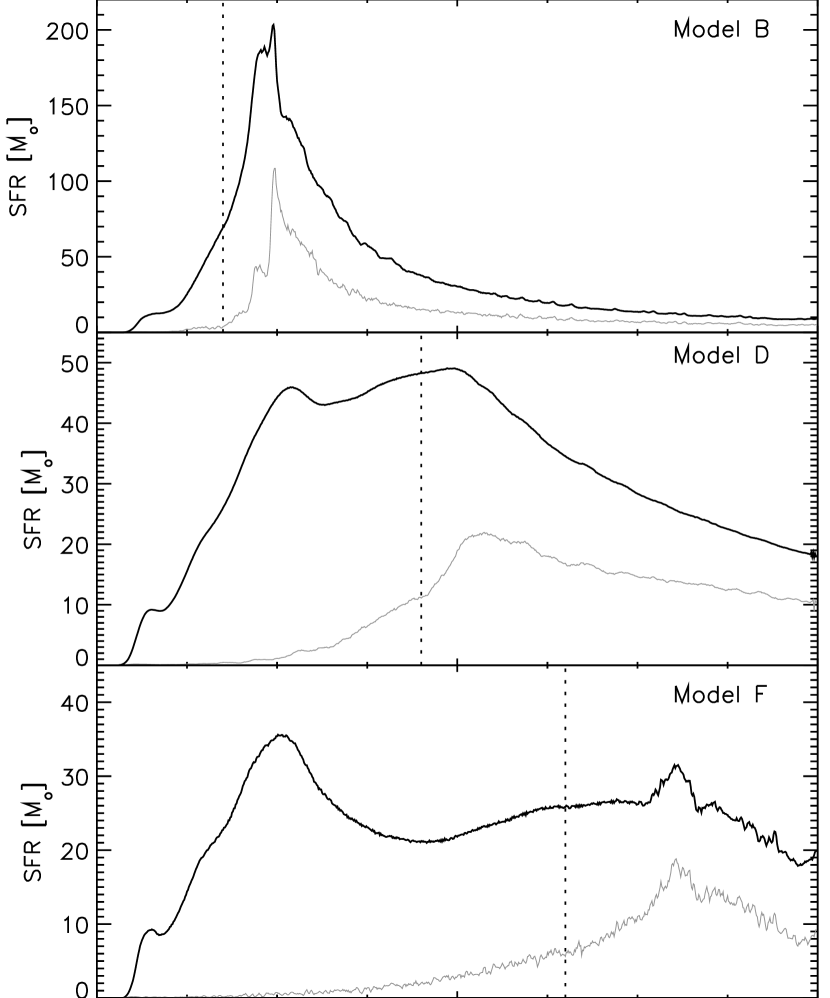
In the beginning, the SFR is low because the gas must first fall to the Galactic plane and reach the limiting volume density for star formation, . This takes around 200 Myr. After this the SFR increases as more material falls in. The energy feedback from the first stars heats the gas and the equilibrium found depends on the energy dissipation rate of the cold gas phase. The less efficiently energy can by dissipated, the higher the cold cloud velocity dispersion, and hence the more extended in the -direction the cold gas disk is (Fig. LABEL:settlingbild). If, on the other hand, the dissipation efficiency is high, the velocity dispersion drops and the material settles in a high density disk. Since all models have identical mass infall and total mass, the density in the disk plane is lower in the thicker disks. Because the SFR follows a Schmidt law (Eq. 1), the overall SFR will be higher in the models with strong gas dissipation. This effect can be seen already at around 500 Myr, when the SFR rates of the models differ by a factor of two.
The subsequent shape of the SFR is dictated by the further evolution. In models A to C the cold gas phase of the disk becomes unstable, with the stars following the potential perturbations induced by the gas. The clumping of the gas leads to a strong enhancement of the SFR (Fig. 5, top panel). The clumps then fall to the center and, due to the efficient angular momentum redistribution during this phase, a large fraction of the gas is located in the center after the clumps have merged. In this stage, the SFR reaches a pronounced maximum, which can be as high as .
The warmer models form stars at a much lower rate, after the initial rise driven by the infall. Because the gas phase remains stable, the cold cloud disk from which the stars form has no large density enhancements. Star formation then increases again when the instability of the stellar disk sets in. The bar causes an inflow of gas to the center, causing an increase in the central SFR which also reflects in the global SFR (Fig. 5, bottom panel). Indeed, Aguerri (1999) found a strong correlation between the global SFR and the barred structure of galaxies.
As a consequence of their diverse SFR, the integrated mass of stars formed in these models also varies strongly (Fig. 6): whereas after 2 Gyr model B has already converted 75% of its baryonic mass into stars, the corresponding value for model D is around 40% and that for model F is around 25%.
This illustrates how different the SFR in these models are despite their identical mass infall rates. The cooling efficiency, acting as a process on small scales, thus influences the strength and the shape of the SFR, consistent with results from van den Bosch (2002). It is therefore difficult to constrain the mass accretion rate of a galaxy from the star formation history alone, without further assumptions. This shows the need for self-consistent modelling of galaxies.

4.3 Metallicity Distribution
Fig. LABEL:metvert shows the metallicity distribution of the stars in models B and F after time 4 Gyr. Here we divide the stars in the model into halo, disk, and bulge components. The halo is defined as all stars with a distance to the disk plane of at least 3 kpc. The disk component is defined as all stars with -distance from the plane 0.5 kpc and a minimal distance of 2 kpc from the center. All stars within 2 kpc from the center are taken to be the bulge component.
There exist clear differences in the metallicity distributions of both models, due to their different evolutionary histories. However, in both models the metallicity increases from the halo to the disk to the bulge. The halo has the lowest metallicities because the metal-enriched clouds falls through the halo towards the disk plane. When the clouds settle in the disk, the chemical enrichment can take place over a longer time-scale. The subsequent angular momentum redistribution from the instability causes the gas to flow inwards. The inflowing gas cannot escape from the galactic center, and when it is converted to bulge stars, it has the highest metallicities.
Since the settling of the baryons to the plane depends on the dissipation rate (Sect. 3.1), the enrichment time-scale for stars that end up in the halo is longer for model F than for model B, and so one expects a more advanced chemical enrichment of the halo in model F. Indeed, the halo metallicity distribution of the cold model B shows a peak at , whereas the peak in the distribution for model F lies approximately one dex higher at . The shape of the observed metallicity distribution of the halo of M31 (Durrell et al., 2001) is very similar to that of model F. This points to a relatively slow star formation process for the M31 halo stars. By contrast, the metallicity distribution of the Milky Way halo (Chiba & Beers, 2000) resembles more the distribution created in the cold model B, and points to a faster settling of the gas to the disk in the early collapse of the Milky Way (see also SG03).
In the distribution of disk stars, the differences between both models are also clearly visible. In model B, the peak at relatively low metallicities mirrors the peak in the SFR at early times, before SNeIa play a significant role in the enrichment. This model is compared to data from Edvardsson et al. (1993). Note, however, that the observed sample contains stars that have formed much later than at 4 Gyr where the model calculation ends. The slower star formation process of model F leads to a steady increase of stars with high metallicities; in this model the gas is enriched by SNeIa before a large fraction of the stars is formed.
A similar argument applies to the bulge. Here the high early SFR of model B produces many metal poor bulge stars with . In model F, by contrast, the evolution is slower, leading to a steady increase in the stellar metallicity without a peak at low metallicities. Tiede & Terndrup (1999) reported a metallicity distribution for the Galactic bulge with a similar shape as produced in model B. On the other hand, results from Ramirez et al. (2000) and Zoccali et al. (2003) point to a more metal rich distribution. The formation of the Galactic bulge is discussed further in the next section.
Although clearly the cloud energy dissipation is not the only physical process that influences the metallicity distributions in galaxies, it does have an important impact on the dynamical, star formation, and chemical evolution of galaxies.
5 Bulge Formation
In our series of models we observe two qualitatively different paths to bulge formation. In those models where the gas disk fragments and develops massive clumps, the bulge is formed through the merging of these clumps at relatively early times (see also Noguchi, 1999). In the class of models where a bar forms through an instability of the stellar disk, the bulge is formed from this bar, at comparably late times. This is similar to the scenario proposed by Combes & Sanders (1981), Pfenniger & Norman (1990) and Raha et al. (1991).
These two routes do not cover the whole range of bulge formation processes: further ways in which a bulge may be formed are through mergers (Aguerri et al., 2001; Scannapieco & Tissera, 2003) or in the center of an early galactic collapse (Eggen et al., 1962). It is possible that all these routes may play a role in the formation of some bulges. Real bulges may even form through a combination of these processes, as indeed happens in the self-consistent models of SG03. In particular, some nuclear bulges would appear to be good candidates for the rapid SFR processes.
The least well-studied of these bulge formation processes is that from merging clumps in a fragmenting disk (Noguchi, 1999). Immeli et al. (2003) compare a high-resolution simulation of model A with observations and conclude that this process may in fact be at work in the chain galaxies found by CHS95. Further observations of similar objects will thus be highly interesting.
Fig. 8 shows edge-on projections of the inner regions of models B, D, and F in terms of K-band surface brightness. The bulges also stand out in the K-band radial surface brightness profiles, plotted in Fig. LABEL:kprofile. In the following subsections, we give some more specific predictions from our models.
5.1 Clump Merging
As we have seen, in the cold models (A to C) the disk fragments in an early evolutionary state and quickly develops several clumps of stars and gas. The clumps then spiral to the center, where they merge, causing a massive bulge to form. Because this process leads to very high gas densities, the SFR in the clumps and, especially, in the subsequently forming bulge is very high. This results in a rapid oxygen enrichment of the bulge stars, as can be seen from Fig. 10, where [O/Fe] is plotted against [Fe/H] (top panel for model B).

In this plot, [O/Fe] at low metallicities corresponds to the IMF averaged abundance ratio of supernovae of type II (SNeII) (Samland, 1998), which enrich the ISM on a timescale of order 10 Myr. The supernovae of type Ia (SNeIa), assumed in our model to arise from white dwarf binary systems on a timescale of around 1 Gyr, influence the chemical evolution of the ISM only at later times. The large amount of iron produced by the SNeIa lowers [O/Fe]. The metallicity at which this happens depends on how far the enrichment has progressed before this time, and so the location of the transition in Fig. 10 gives information about the star formation time-scale. In the case of the fragmenting model B, the short starburst produces a clearly defined path through the [O/Fe]-[Fe/H] diagrams, with a bend lying around . Thus SNeII have enriched the ISM already to this high metallicity before the feedback from SNeIa plays an important role.
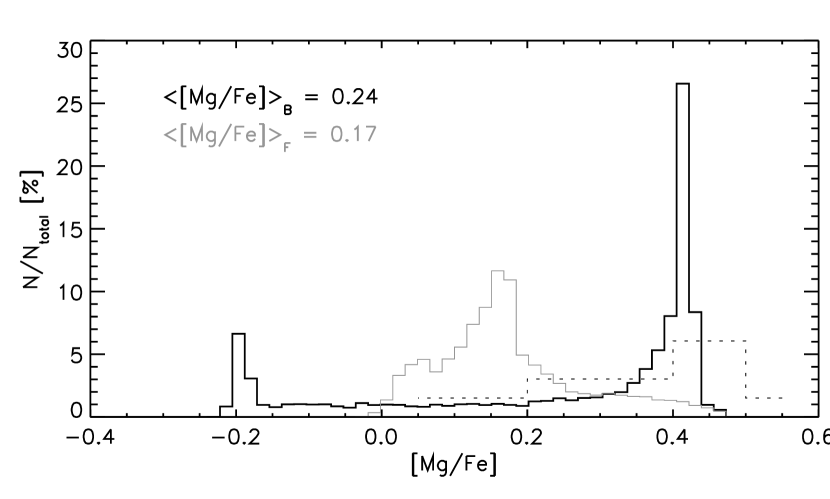
After the starburst, 70% of the infalling baryonic matter in model B has been converted to stars. The fast SF history is thus reflected in a large overabundance of -elements. This is shown for the element Mg in Fig. 11. The distribution of [Mg/Fe] for all bulge stars at time 4 Gyr shown in Fig. 11 has a strong peak at [Mg/Fe] . There is also a smaller peak at ; this value corresponds to the maximum reached in a closed box simulation, and is generated by an extended low level star formation at late times when the iron enrichment from SNeIa dominates.
The distribution in Fig. 11 for model B looks not unlike that for the Galactic bulge stars measured by McWilliam & Rich (1994) and shown as the dotted histrogram in Fig. 11. Note, however, that the observed distribution will depend on the entire SF history following the simulated early phase. Thus, at the moment it is too early to say whether the old Galactic bulge could have formed out of an early fragmenting disk, but it is clearly a possibility that is worth further investigation.
The evolution of the velocity dispersion of the bulge stars is shown in Fig. 12, where both the (cylindrical) radial velocity dispersion and the vertical component are given. The figure shows two main effects: The first, visible in in both components, is a more or less linear rise of the velocity dispersion due to the growing mass concentration in the center of the disk.
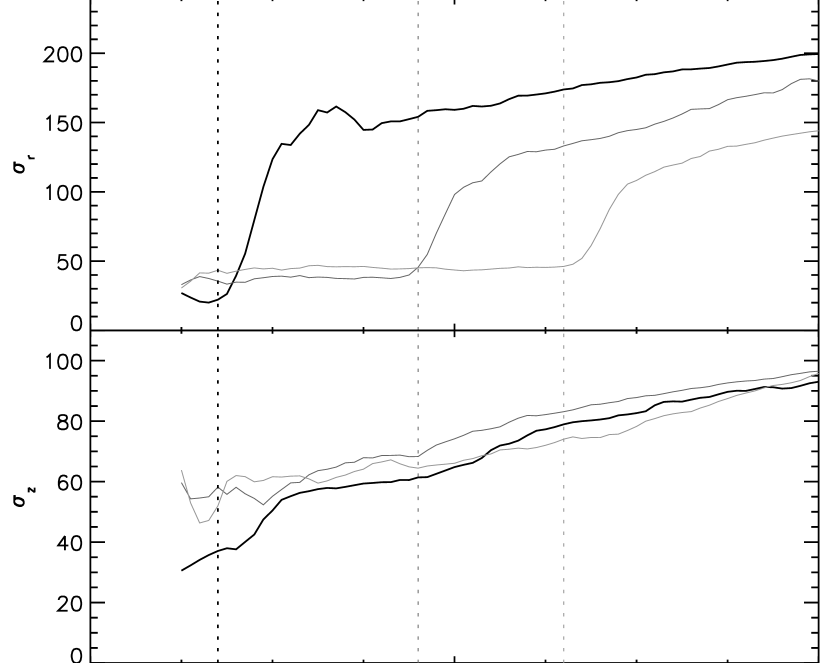
The second effect originates in the instability and affects only the radial component. In model B, the violent evolution of the galactic disk with the final coalescence to a nuclear bulge leads to a strong rise in the radial velocity dispersion: when the instability sets in, rises sharply from around 30 to 150 . The corresponding rise in models D and F occurs later; see Section 5.2. The -component of the velocity dispersion increases less through the instability.
At early times, the vertical dispersion in this model exceeds . We believe this is a combination of the infall model used and a massive disk building up in the galactic plane. At the end of the simulation, the radial velocity dispersion is around 200 whereas the -component lies around 90 .
5.2 Bar Evolution
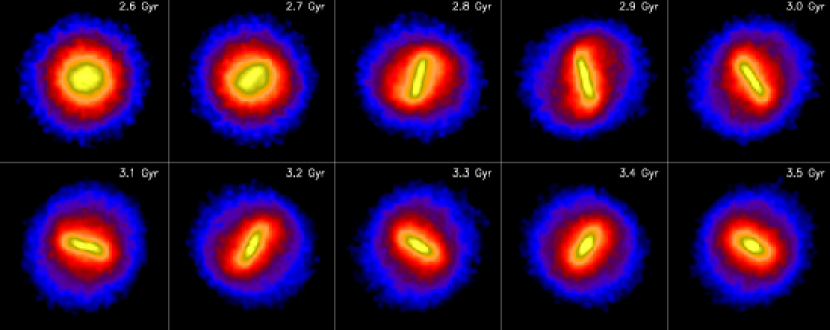
Fig. 13 shows the evolution of model F during the bar instability, through its face-on K-band surface brightness map. Model F is representative for the models with lower cloud energy dissipation, E to G. The bar forms between 2.6 Gyr and 2.8 Gyr, i.e., within a time interval of the order of the dynamical time, as is also observed in N-body simulations (Combes & Sanders, 1981). The bar instability causes a sudden increase in the radial component of the velocity dispersion (Fig. 12), whereas the -component stays rather unaffected.
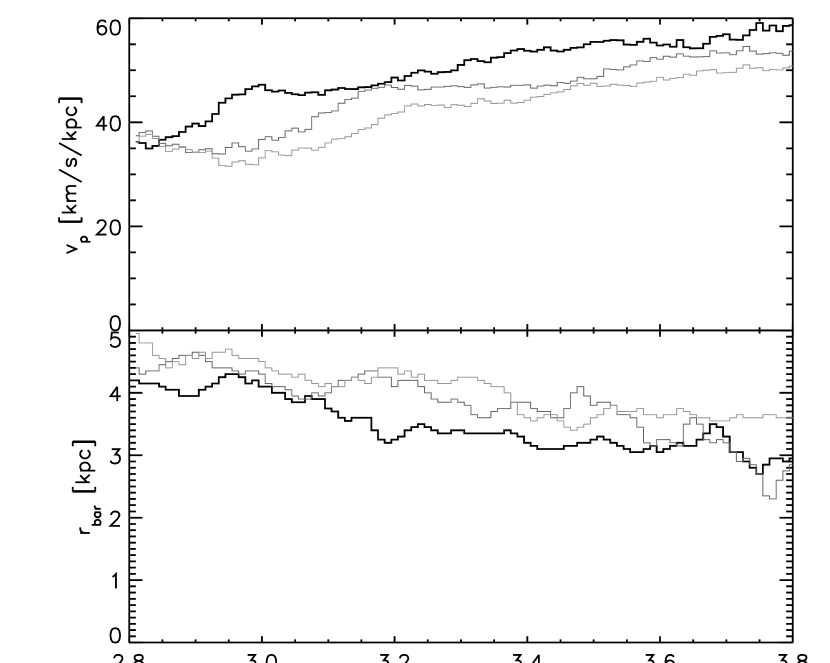
Right after its formation the bar becomes very pronounced, and then weakens again. To do a quantitative investigation, we made a Fourier decomposition of the mass distribution to derive the length of the bar. Fig. 14, bottom panel, shows that the bar becomes shorter with time. The bar length evolves from around 4.5 kpc to around 3.2 kpc within 1 Gyr. The shortening of the bar is accompanied by an increasing pattern speed (Fig. 14, top panel). The bar developed in the model is a fast bar with its end near the corotation radius. The rising pattern speed can be explained by the growing mass concentration in the center, since all relevant frequencies at a given radius depend on . This evolution is similar in all three models that form a bar.
Because at the time when the bar forms (Fig. 6), the gas content of models E to G is still high, up to 60%, the formation of the bar leads to a significant inflow of gas to the center. There the gas can form new stars (compare Sect. 4.2). The mass accumulation in the center then weakens the bar, as previously observed in numerical simulations (e.g Friedli & Benz, 1993; Norman et al., 1996). There is also observational evidence for the weakening of bars through central concentrations: Das et al. (2003) recently found an anti-correlation between central mass concentration and deprojected bar ellipticity in a sample of 13 barred nearby galaxies.
As we have already mentioned in the introduction, observations indicate an absence of bars at intermediate and high redshifts (Abraham et al., 1999). In the models presented here, the formation of an extended stellar disk with surface density high enough that it can become bar-unstable, takes a comparably long time. In addition, in these systems with large gas fraction, the bar formed is rapidly weakened due to strong gas transport to the center. Both effects could occur in high redshift disks, as the early disks might have larger cloud random motions because of the stronger infall, and would have higher gas contents. The two effects thus might explain the absence of bars at higher redshifts.
The metallicity distribution of the stars in the central bar/bulge (Fig. 10) reflects the slower enrichment process in the hotter models. The bend in [O/Fe] is shifted to lower [Fe/H], because of the smaller SFR in these models. The bump visible in this plot for models D and F at [Fe/H] around -0.4 is mainly due to the increase of the central SFR caused by the instability. The SNeII formed in the central regions dominate the feedback again and enhance the abundance of -elements. This effect together with the averaging over the central 2 kpc is also the source of the scatter in the plots for models D and F.
We note that, because we use an IMF-averaged yield for SNeII, we do not find a broad range of [O/Fe] values at low metallicities, as would be expected at early times when bulge stars are enriched by individual SNeII with different progenitor masses (Argast et al., 2000). The scatter seen for models D and F in Fig. 10 comes from the form of the SFR.
6 Conclusion
We have investigated a sequence of models for star-forming, gas-rich disks. The most important result from these models is that galaxy evolution proceeds very differently depending on whether it is the gas disk or the stellar disk which first becomes unstable, as measured by the respective Q-parameters. In our two-phase, star-forming interstellar medium description this depends on how efficiently the cold cloud medium can dissipate the kinetic energy it gains from dynamical and feedback heating. An additional important variable is the infall history (Noguchi, 1999), which influences the gas density and hence the local self-regulation equilibrium (Samland & Gerhard, 2003, SG03) and the disk stability.
When the cold gas cools efficiently and drives the instability, the galactic disk fragments and forms a number of massive clumps. The stellar disk fragments with the gas because of the strong gravity of the clumps, which begin to form stars at a high rate because of their large density. The clumps then spiral to the center of the galaxy in a few dynamical times and merge there to form a central bulge component in a strong starburst. This scenario is similar to that discussed by Noguchi (1999). We show that, in this mode of disk evolution, the bulge forms rapidly and early; the unstable region of the disk is completely disrupted, and the disk must be rebuilt by subsequent infall. Because of the starburst origin, many of the bulge stars formed in this way have large [/Fe] abundance ratios.
On the other hand, if the kinetic energy of the cold clouds is dissipated at a lower rate, stars form from the gas in a more quiescent mode, while keeping the kinetic temperature high enough and the gas density low enough to prevent the gas from becoming dynamically unstable. In this case, an instability only sets in at later times, when the surface density of the stellar disk has grown sufficiently high. The system then forms a stellar bar, which channels gas into the center, evolves, and forms a bulge whose stars are the result of a more extended star formation history, i.e., have lower [/Fe]. This scenario resembles the evolution described by Combes & Sanders (1981), Pfenniger & Norman (1990) and Raha et al. (1991). The comparably long formation time for bars and bulges in this mode and the weakening of the bar through inward gas flow in the still gas-rich disks might explain the absence of bars at high redshift (Abraham et al., 1999).
An example of a nearby galaxy in which the fragmentation process may be taking place, is the gas-rich, blue starburst galaxy NGC 7673 (Homeier & Gallagher, 1999). At higher redshifts, a number of morphologically unusual galaxies may be in similar evolutionary states, such as the so-called chain galaxies (Cowie et al., 1995) and other knotty galaxies seen in the HDF (van den Bergh et al., 1996); see Immeli et al. (2003) for further discussion. On the other hand, the abundance ratios in the centers of nearby bulges show only a moderate overabundance ([/Fe]; Proctor & Sansom (2002)), arguing that these stars were formed from gas enriched by more extended star formation histories. The few [Mg/Fe] abundance ratio measurements available for the Galactic bulge (McWilliam & Rich, 1994), on the other hand, point towards more enhanced [/Fe]. Consistent with this, Puzia et al. (2002) find a similar enhancement in three Galactic bulge fields as in bulge globular clusters from integrated light measurements.
Clearly, mixed star formation histories would also be possible, in which a part of the bulge formed in an early starburst, preceding a slower build-up of bulge stars from secular evolution of the disk. In the multi-phase galaxy evolution model of SG03, which follows the formation of a large disk galaxy in a growing CDM dark matter halo, the final bulge is indeed a superposition of these two components with, in that model, the larger part of the mass in the secular component. Our models suggest that the time-scale for secular disk evolution is comparable to or longer than that for Fe enrichment from SNeIa, while the central starburst occurs before SNeIa become important. Thus further spatially resolved measurements of [/Fe] in bulges, and measurements of [/Fe] vs Fe and radius for Galactic bulge stars will be key for disentangling bulge formation history.
It is well-known that the properties and evolution of a galactic disk depend on global parameters like mass, angular momentum, and infall rate. We have shown here that the evolution may also depend strongly on the physics of the baryonic component, in particular, the uncertain energy dissipation rate of the cold cloud medium from which most stars are formed. This also implies that one cannot simply derive the accretion rate onto a galaxy by determining its star formation history. Although all the models in our sequence have an identical gas infall, we observe very different SF histories from one model to the other. In all models, however, the instability causes gas transport to the center, and a subsequent increase of the central SFR leading to the build-up of a central bulge component.
We thank the referee, M. Noguchi, for his prompt report, the Schweizerischer Nationalfond for financial support of this work under grant 20-64856.01, and the Centro Svizzero di Calcolo Scientifico (CSCS) for the opportunity of using their computing facilities.
References
- Abadi et al. (2003) Abadi, M. G., Navarro, J. F., Steinmetz, M., Eke, V. R. 2003, ApJ, 591, 499
- Abraham et al. (1996) Abraham, R. G., Tanvir, N. R., Santiago, B. X., Ellis, R. S, Glazebrook, K., van den Bergh, S. 1996, MNRAS, 279, L47
- Abraham et al. (1999) Abraham, R. G., Merrifield, M. R., Ellis, R. S., Tanvir, N. R., Brinchmann, J. 1999, MNRAS, 308, 569
- Abraham (1999) Abraham, R. G. 1999, Ap&SS, 269, 323
- Abraham & Merrifield (2000) Abraham, R. G., Merrifield, M. R. 2000, AJ, 120, 2835
- Aguerri (1999) Aguerri, J. A. L. 1999, A&A, 351, 43
- Aguerri et al. (2001) Aguerri, J. A. L., Balcells, M., Peletier, R. F. 2001, A&A, 367, 428
- Argast et al. (2000) Argast, D., Samland, M., Gerhard, O., Thielemann, F.-K. 2000, A&A, 356, 873
- Balsara et al. (2001) Balsara, D., Ward-Thompson, D., Crutcher, R. M. 2001, MNRAS, 327, 715
- Brinchmann et al. (1998) Brinchmann, J., Abraham, R., Schade, D., Tresse, L., Ellis, R. S., Lilly, S., Le Fevre, O., Glazebrook, K., Hammer, F., Colless, M., Crampton, D., Broadhurst, T. 1998, ApJ, 499, 112
- Bullock et al. (2001) Bullock, J. S., Dekel, A., Kolatt, T. S., Kravtsov, A. V., Klypin, A. A., Porciani, C., Primack, J. R. 2001 ApJ, 555, 240
- Cha & Whitworth (2003) Cha, S.-H., Whitworth, A. P. 2003, MNRAS, 340, 91
- Chen & Jing (2002) Chen, D. N., Jing, Y. P. 2002, MNRAS, 336, 55
- Chiba & Beers (2000) Chiba, M., Beers, T. 2000, AJ, 119, 2843
- Cole et al. (2000) Cole, S., Lacey, C. G., Baugh, C. M., Frenk, C. S. 2000, MNRAS, 319, 168
- Combes & Sanders (1981) Combes, F., Sanders, R. H. 1981, A&A 96, 164
- Contardo et al. (1998) Contardo, G., Steinmetz, M., Fritze-v. Alvensleben, U. 1998, ApJ, 507, 497
- Courteau et al. (1996) Courteau, S., de Jong, R. S., Broeils, A. H. 1996, ApJ, 457, 73
- Cowie et al. (1995) Cowie, L. L., Hu, E. M., Songaila, A. 1995, AJ, 110, 1576 (CHS95)
- Cowie et al. (1980) Cowie, L. L. 1980, ApJ, 236, 868
- Das et al. (2003) Das, M., Teuben, P. J., Vogel, S. N., Regan, M. W., Sheth, K., Harris, A. I., Jefferys W. H. 2003, ApJ, 582, 190
- Dickinson (2000) Dickinson, M. 2000, in “Building Galaxies: From the Primordial Universe to the Present”, XIXth Moriond Astrophysics Meeting, ed. F. Hammer et al. (Paris: Ed. Frontieres), 257
- Driver et al. (1998) Driver, S. P., Fernandez-Soto, A., Couch, W. J., Odewahn, S. C., Windhorst, R. A., Phillips, S., Lanzetta, K., Yahil, A. 1998, ApJ, 496, 93
- Durrell et al. (2001) Durell, P. R., Harris W. E., Pritchet, C. J. 2001, ApJ, 121, 2557
- Edvardsson et al. (1993) Edvardsson, B., Andersen, J., Gustafsson, B., Lambert, D. L., Nissen, P. E., Tomkin, J. 1993, A&A, 102, 603
- Eggen et al. (1962) Eggen, O. J., Lynden-Bell, D., Sandage, A. R. 1962, ApJ, 136, 748
- Elmegreen (1995) Elmegreen, B.G. 1995, MNRAS, 275, 944
- Elmegreen (1989) Elmegreen, B.G., 1989, ApJ, 338, 178
- Friedli & Benz (1993) Friedli, D., Benz, W. 1993, A&A, 268, 65
- Gingold & Monaghan (1983) Gingold, R. A., Monaghan, J. J. 1983, MNRAS, 204, 715
- Guiderdoni et al. (1998) Guiderdoni, B., Hivon, E., Bouchet, F. R., Maffei, B. 1998, MNRAS, 295, 877
- Homeier & Gallagher (1999) Homeier N. L., Gallagher J. S., 1999, ApJ, 522, 199
- Immeli et al. (2003) Immeli, A., Samland, M., Gerhard, O.E., Westera, P. 2003, ApJ, submitted
- Jenkins et al. (2001) Jenkins, A., Frenk, C. S., White, S. D. M., Colberg, J. M., Cole, S., Evrard, A. E., Couchman, H. M. P., Yoshida, N. 2001, MNRAS, 321, 372
- Jog & Solomon (1984) Jog, C. J., Solomon, P. M., 1984, ApJ, 276, 114
- Kauffmann et al. (1993) Kauffmann, G., White, S. D. M., Guiderdoni, B. 1993, MNRAS, 264, 201
- Kajisawa & Yamada (2001) Kajisawa, M., Yamada, T. 2001, PASJ, 53, 833
- Kennicutt (1998) Kennicutt, R. C., 1998, ApJ, 498, 541
- Kim et al. (2001) Kim, J., Balsara, D., Mac Low, M.-M. 2001, JKAS, 34, 333
- Kormendy (1982) Kormendy, J. 1982, in Morphology and Dynamics of Galaxies, ed. L. Martinet & M. Mayor (Sauverny: Geneva Obs.), 113
- Klypin et al. (2001) Klypin, A., Kravtsov, A. V., Bullock, J. S., Primak, J. R. 2001, ApJ, 554, 903
- Larson (1969) Larson, R.B., 1969, MNRAS, 145, 405
- Lilly et al. (1998) Lilly, S., Schade, D., Ellis, R., Le Fevre, O., Brinchmann, J., Tresse, L., Abraham, R., Hammer, F., Crampton, D., Colless, M., Glazebrook, K., Mallen-Ornelas, G., Broadhurst, T. 1998, ApJ, 500, 75L
- McKee & Ostriker (1977) McKee, C. F., Ostriker, J. P., 1977, ApJ, 218, 148
- McWilliam & Rich (1994) McWilliam, A., Rich, R. M. 1994, ApJS, 91, 749
- Moore et al. (1998) Moore, B., Governato, F., Quinn, T., Stadel, J., Lake, G. 1998, ApJ, 499, 5
- Navarro et al. (1996) Navarro, J. F., Frenk, C. S., White, S. D. M. 1996, ApJ, 462, 563
- Navarro et al. (1997) Navarro, J. F., Frenk, C. S., White, S. D. M. 1997, ApJ, 490, 493
- Navarro & Steinmetz (1997) Navarro, J. F., Steinmetz, M., 1997, ApJ, 478, 13
- Noguchi (1999) Noguchi, M. 1999, ApJ, 514, 77
- Norman et al. (1996) Norman, C. A., Sellwood, J. A., Hasan, H. 1996, ApJ, 462, 114
- O’Neil et al. (2000) O’Neil, K., Bothun, G. D., Impey, C. D., 2000 ApJS, 128, 99
- Peletier & Balcells (1996) Peletier, R. F., Balcells, M. 1996, AJ, 111, 2238
- Pfenniger & Norman (1990) Pfenniger, D., Norman, C. 1990, ApJ, 363, 391
- Polyachenko (1997) Polyachenko, V. L, Polyachenko, E. V., Strel’Nikov, A. V. 1997, AstL, 23, 483
- Puzia et al. (2002) Puzia, T. H., Saglia, R. P., Kissler-Patig, M., Maraston, C., Greggio, L., Renzini, A., Ortolani, S. 2002, A&A, 395, 45
- Raha et al. (1991) Raha, N., Sellwood, J. A., James, R. A., Kahn, F. D. 1991, Nature 352, 411
- Ramirez et al. (2000) Ramirez, S. V., Stephens, A. W., Frogel, J. A., DePoy, D. L. 2000, AJ, 120, 833
- Romeo (1992) Romeo, B.R. 1992, MNRAS, 256, 307
- Safranov (1960) Safranov, V.S. 1960, Ann. d’Ap., 23, 979
- Samland (1998) Samland, M. 1998, ApJ, 496, 155
- Samland & Gerhard (2003) Samland, M., Gerhard, O. 2003, A&A, 399, 961 (SG03)
- Proctor & Sansom (2002) Proctor, R. N., Sansom, A. E. 2002, MNRAS, 333, 517
- Scannapieco & Tissera (2003) Scannapieco, C., Tissera, P. B. 2003, MNRAS, 338, 880
- Schmidt (1959) Schmidt, M. 1959, ApJ, 129, 243
- Seigar et al. (2002) Seigar, M., Carollo, C. M., Stiavelli, M., de Zeeuw, P. T., Dejonghe, H. 2002, AJ, 123, 184
- Sommer-Larsen et al. (2002) Sommer-Larsen, J., Götz, M., & Portinari, L. 2002, astro-ph/0204366
- Sommer-Larsen et al. (1999) Sommer-Larsen, J., Gelato, S., Vedel, H. 1999, ApJ, 519, 501
- Steinmetz & Müller (1995) Steinmetz, M., Müller, E. 1995, MNRAS, 276, 549
- Tiede & Terndrup (1999) Tiede, G. P., Terndrup, D. M. 1999, AJ118, 895
- Toomre (1964) Toomre, A. 1964, ApJ, 139, 1217
- van den Bergh et al. (1996) van den Bergh, S., Abraham, R.G., Ellis, R.S., Tanvir, N.R., Santiago, B.X., Glazebrook, K.G., 1996, AJ, 112, 359
- van den Bergh et al. (2002) van den Bergh, S., Abraham, R. G., Whyte, L. F., Merrifield, M. R., Eskridge, P. B., Frogel J. A., Pogge, R. 2002, AJ, 123, 2913
- van den Bergh et al. (2000) van den Bergh, S., Cohen, J.G., Hogg, D.W., Blandford, R. 2000, AJ, 120, 2190
- van den Bosch (2002) van den Bosch, F. C. 2002, MNRAS, 332, 456
- Wang & Silk (1994) Wang, B., Silk, J. 1994, ApJ, 427, 759
- Wechsler et al. (2002) Wechsler, R. H., Bullock, J. S., Primack, J. R., Kravtsov, A. V., Dekel, A. 2002, ApJ 568, 52
- Westera et al. (2002) Westera, P., Samland, M., Gerhard, O., Buser, R. 2002, A&A, 389, 761
- Williams & Nelson (2001) Williams, P. R., Nelson, A. H. 2001, A&A, 374, 839
- Zoccali et al. (2003) Zoccali, M., Renzini, A., Ortolani, S., Greggio, L., Saviane, I., Cassisi, S., Rejkuba, M., Barbuy, B., Rich, R. M., Bica, E. 2003, A&A, 399, 931