[
Measuring the Small-Scale Power Spectrum of Cosmic Density
Fluctuations
Through 21 cm Tomography Prior to the Epoch of Structure
Formation
Abstract
The thermal evolution of the cosmic gas decoupled from that of the cosmic microwave background (CMB) at a redshift . Afterwards and before the first stars had formed, the cosmic neutral hydrogen absorbed the CMB flux at its resonant 21cm spin-flip transition. We calculate the evolution of the spin temperature for this transition and the resulting anisotropies that are imprinted on the CMB sky due to linear density fluctuations during this epoch. These anisotropies at an observed wavelength of meters, contain an amount of information that is orders of magnitude larger than any other cosmological probe. Their detection, although challenging, could tightly constrain any possible running of the spectral index from inflation (as suggested by WMAP), small deviations from Gaussianity, or any significant contribution from neutrinos or warm dark matter to the cosmic mass budget.
pacs:
PACS numbers: 98.80.-k, 98.65.-r, 98.70.Vc, 95.30.Jx]
Introduction.
The small residual fraction of free electrons after cosmological recombination coupled the temperature of the cosmic gas to that of the cosmic microwave background (CMB) down to a redshift, [1]. Subsequently, the gas temperature dropped adiabatically as below the CMB temperature . The gas heated up again after being exposed to the photo-ionizing ultraviolet light emitted by the first stars during the reionization epoch at (see review in [2]). Prior to the formation of the first stars, the cosmic neutral hydrogen must have resonantly absorbed the CMB flux through its spin-flip 21cm transition [3, 4, 5, 6]. The linear density fluctuations at that time should have imprinted anisotropies on the CMB sky at an observed wavelength of meters. In this Letter, we calculate the power spectrum of these anisotropies and assess the significance of their potential detection. A direct measurement of the amplitude of inhomogeneities on small spatial scales would constrain any possible tilt or running of the spectral index of the power spectrum as recently suggested by Wilkinson Microwave Anisotropy Probe (WMAP) [7], or any suppression of power on small scales due to a warm dark matter component in the cosmic mass budget [8].
Spin temperature history.
We start by calculating the history of the spin temperature, , defined through the ratio between the number densities of hydrogen atoms in the excited and ground state levels, where subscripts and correspond to the excited and ground state levels of the 21cm transition, is the ratio of the spin degeneracy factors of the levels, is the total hydrogen density, and K is the temperature corresponding to the energy difference between the levels. The time evolution of the density of atoms in the ground state is given by,
| (1) | |||||
| (2) |
where is the cosmic scale factor, ’s and ’s are the Einstein rate coefficients, ’s are the collisional rate coefficients, and is the blackbody intensity in the Rayleigh-Jeans tail of the CMB, namely with cm [9]. The transition rates can be related to the transition rates by the requirement that in thermal equilibrium with , the right-hand-side of Eq. (2) should vanish with the collisional terms balancing each other separately from the radiative terms. The Einstein coefficients are , and [3, 9]. The collisional de-excitation rates can be written as , where is tabulated as a function of [10].
Equation (2) can be simplified to the form,
| (4) | |||||
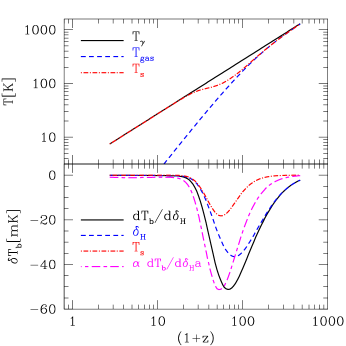
where , is the Hubble parameter at high redshifts (with a present-day value of ), and is the density parameter of matter. The upper panel of Fig. 1 shows the results of integrating Eq. (4). Both the spin temperature and the kinetic temperature of the gas track the CMB temperature down to . Collisions are efficient at coupling and down to and so the spin temperature follows the kinetic temperature around that redshift. At much lower redshifts, the Hubble expansion makes the collision rate subdominant relative the radiative coupling rate to the CMB, and so tracks again. Consequently, there is a redshift window between , during which the cosmic hydrogen absorbs the CMB flux at its resonant 21cm transition. Coincidentally, this redshift interval precedes the appearance of collapsed objects [2] and so its signatures are not contaminated by nonlinear density structures or by radiative or hydrodynamic feedback effects from stars and quasars.
During the period when the spin temperature is smaller than the CMB temperature, neutral hydrogen atoms absorb CMB photons. The resonant 21cm absorption reduces the brightness temperature of the CMB by,
| (5) |
where the optical depth for resonant 21cm absorption is,
| (6) |
Small inhomogeneities in the hydrogen density result in fluctuations of the 21cm absorption through two separate effects. An excess of neutral hydrogen directly increases the optical depth and also alters the evolution of the spin temperature. We can write an equation for the resulting evolution of fluctuations,
| (8) | |||||
leading to spin temperature fluctuations,
| (9) |
The resulting brightness temperature fluctuations can be related to the derivative,
| (10) |
through . We include all fluctuations caused by except for the variation in due to fluctuations in which is very small [10]. Figure 1 shows as a function of redshift, including the two contributions to , one originating directly from density fluctuations and the second from the associated changes in the spin temperature [4]. Both contributions have the same sign, because an increase in density raises the collision rate and lowers the spin temperature and so it allows to better track . Since grows with time as , the signal peaks at , a slightly lower redshift than the peak of .
Next we calculate the angular power spectrum of the brightness temperature on the sky, resulting from density perturbations with a power spectrum ,
| (11) |
where is the Fourier tansform of the hydrogen density field, is the comoving wavevector, and denotes an ensemble average (following the formalism described in [6]). The 21cm brightness temperature observed at a frequency corresponding to a distance along the line of sight, is given by
| (12) |
where denotes the direction of observation, is a narrow function of that peaks at the distance corresponding to . The details of this function depend on the characteristics of the experiment. The brightness fluctuations in equation (12) can be expanded in spherical harmonics with expansion coefficients . The angular power spectrum of map can be expressed in terms of the 3D power spectrum of fluctuations in the density ,
| (13) | |||||
| (14) |
Our calculation ignores inhomogeneities in the hydrogen ionization fraction, since they freeze at the earlier recombination epoch () and so their amplitude is more than an order of magnitude smaller than at . The peculiar velocity and gravitational potential perturbations induce redshift distortion effects that are of order and smaller than for the high– modes of interest here. These effects are expected to be washed-out within realistically broad band filters.
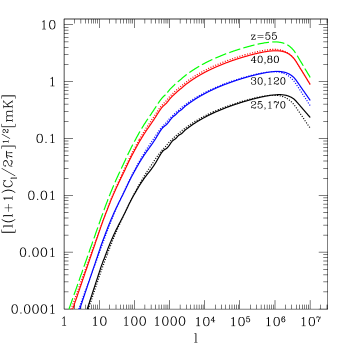
Figure 2 shows the angular power spectrum at various redshifts. The ability to probe the small scale power of density fluctuations is only limited by the Jeans scale, below which the dark matter inhomogeneities are washed out by the finite pressure of the gas. Interestingly, the cosmological Jeans mass reaches its minimum value, , within the redshift interval of interest here [2]. During the epoch of reionization, photoionization heating raises the Jeans mass by several orders of magnitude and and broadens spectral features, thus limiting the ability of other probes of the intergalactic medium, such as the Ly forest, from accessing the same very low mass scales. The 21cm tomography has the additional advantage of probing the majority of the cosmic gas, instead of the trace amount () of neutral hydrogen probed by the Ly forest after reionization. Similarly to the primary CMB anisotropies, the 21cm signal is simply shaped by gravity, adiabatic cosmic expansion, and well-known atomic physics, and is not contaminated by complex astrophysical processes that affect the intergalactic medium at .
The small scale power spectrum.
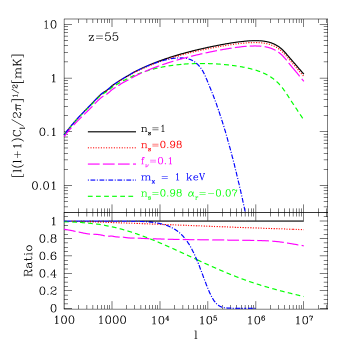
In most models of inflation, the evolution of the Hubble parameter during inflation leads to departures from a scale-invariant spectrum that are of order with being the number of –folds between the time when the scale of our horizon was of order the horizon during inflation and the end of inflation [14]. Recent WMAP data combined with other measures of the power on smaller scales, suggests that the power spectrum changes with scale much faster than inflation would have predicted [7], although this result is still somewhat controversial. Independent hints that the standard CDM model may have too much power on galactic scales have inspired several proposals for suppressing the power on small scales. Examples include the possibility that the dark matter is warm and it decoupled while being relativistic so that its free streaming erased small-scale power [8], or direct modifications of inflation that produce a cut-off in the power on small scales [15]. An unavoidable collisionless component of the cosmic mass budget beyond CDM, is provided by massive neutrinos (see [16] for a review). Particle physics experiments established the mass splittings among different species which translate into a lower limit on the fraction of the dark matter accounted for by neutrinos of , while current constraints based on galaxies as tracers of the small scale power imply [17].
In Fig. 3 we show the 21cm power spectrum for various models that differ in their level of small scale power. It is clear that a precise measurement of the 21cm power spectrum will dramatically improve current constraints on alternatives to the standard CDM spectrum.
Unprecedented information.
The 21cm signal contains a wealth of information about the initial fluctuations. A full sky map at a single photon frequency measured up to , can probe the power spectrum up to . Such a map contains independent samples. By shifting the photon frequency, one may obtain many independent measurements of the power. When measuring a mode , which corresponds to a wavenumber , two maps at different photon frequencies will be independent if they are separated in radial distance by . Thus, an experiment that covers a spatial range can probe a total of independent maps. An experiment that detects the 21cm signal over a range centered on a frequency , is sensitive to , and so it measures a total of independent samples.
This detection capability cannot be reproduced even remotely by other techniques. For example, the primary CMB anisotropies are damped on small scales (through the so-called Silk damping), and probe only modes with (). The total number of modes available in the full sky is , including both temperature and polarization information.
Detectability of signal.
The sensitivity of an experiment depends strongly on its particular design, involving the number and distribution of the antennae for an interferometer. Crudely speaking, the uncertainty in the measurement of is dominated by noise, , which is controlled by the sky brightness at the observed frequency [6],
| (16) | |||||
where is the minimum observable as determined by the field of view of the instruments, is the maximum observable as determined by the maximum separation of the antennae, is the fraction of the array area thats is covered by telescopes, is the observation time and is the frequency range over which the signal can be detected. The numbers adopted above are appropriate for the inner core of the LOFAR array (http://www.lofar.org), planned for initial operation in 2006. The predicted signal is , and so a year of integration or an increase in the covering fraction are required to observe it with LOFAR. Other experiments whose goal is to detect 21cm fluctuations include SKA (http://www.skatelescope.org) and PAST (http://astrophysics.phys.cmu.edu/jbp). The main challenge in detecting the predicted signal involves its appearance at low frequencies where the sky noise is high. Proposed space-based instruments [18] avoid the terrestrial radio noise and the increasing atmospheric opacity at (corresponding to ).
Final comments.
The 21cm absorption is replaced by 21cm emission from neutral hydrogen as soon as the intergalactic medium is heated above the CMB temperature during the epoch of reionization [13]. Once most of the cosmic hydrogen is reionized at , the 21cm signal is diminished. The optical depth for free-free absorption after reionization, , modifies only slightly the expected 21cm anisotropies. Gravitational lensing should modify the power spectrum [12] at high , but can be separated as in standard CMB studies (see [19] and references therein). The 21cm signal should be simpler to clean as it includes the same lensing foreground in independent maps obtained at different frequencies.
The large number of independent modes probed by the 21cm signal would provide a measure of non-Gaussian deviations to a level of , constituting a test of the inflationary origin of the primordial inhomogeneities which are expected to possess deviations [20].
Acknowledgments.
This work was supported in part by NASA grant NAG 5-13292, NSF grants AST-0071019, AST-0204514 (for A.L.) and by NSF grants AST-0098606, PHY-0116590 and the David & Lucille Packard Foundation Fellowship (for M.Z.).
REFERENCES
- [1] P. J. E. Peebles, Principles of Physical Cosmology, Princeton U. Press: Princeton, (1993), pp. 176, 177.
- [2] R. Barkana, & A. Loeb, Phys. Rep. 349, 125 (2001).
- [3] G. B. Field, Astrophys. J. 129, 536 (1959).
- [4] D. Scott, & M. J. Rees, Mon. Not. R. Astr. Soc. 247, 510 (1990).
- [5] P. Tozzi, P. Madau, A. Meiksin, & M. J. Rees, Astrophys. J. 528, 597 (2000); N. Y. Gnedin & P. A. Shaver, Astrophys. J., submitted, preprint [astro-ph/0312005] (2003).
- [6] M. Zaldarriaga, S. Furlanetto, & L. Hernquist, Astrophys. J., submitted, preprint [astro-ph/0311514] (2003).
- [7] D. N. Spergel, et al., Astrophys. J. Suppl. 148, 175 (2003).
- [8] P. Bode, J. P. Ostriker & N. Turok, Astrophys. J., 556, 93 (2001); R. Barkana, Z., Haiman, & J. P. Ostriker, Astrophys. J., 558, 482 (2001).
- [9] G. B. Rybicki, & A. P. Lightman, Radiative Processes in Astrophysics, Wiley: New York, (1979), pp. 29-32.
- [10] A. C. Allison, & A. Dalgarno, Astrophys. J., 158, 423 (1969); B. Zygelman, & A. Dalgarno, in preparation
- [11] M. Tegmark, & M. Zaldarriaga, Phys.Rev. D 66,103508, (2002).
- [12] U-L. Pen, preprint [astro-ph/0305387] (2003).
- [13] X. Chen, & J. Miralda-Escudé, Astrophys. J., submitted, preprint [astro-ph/0303395] (2003).
- [14] A. R. Liddle & D. H. Lyth, Cosmological Inflation and Large-Scale Structure, Cambridge U. Press: Cambridge, (2000)
- [15] M. Kamionkowski & A. R. Liddle, Phys.Rev.Lett. 84, 4525 (2000)
- [16] E. T. Kearns, Frascati Phys.Ser. 28 413 (2002); J. N. Bahcall & C. Pena-Garay, JHEP 0311, 004 (2003)
- [17] M. Tegmark et al, preprint [astro-ph/0310723] (2003)
- [18] N. E. Kassim & K. W. Weiler, Low Frequency Astrophysics from Space, Springer-Verlag: New-York, (1990); R. G. Stone et al., Radio Astronomy at Long Wavelengths, American Geophysical Union: Washington DC, (2000); see also, http://rsd-www.nrl.navy.mil/7213/weiler/lfraspce.html
- [19] U. Seljak & M. Zaldarriaga, Phys.Rev.Lett. 82, 2636, (1999) ; W. Hu, Astrophys. J. 556, 93 (2001); C.M. Hirata & U. Seljak, Phys.Rev. D 67, 043001(2003)
- [20] J. M. Maldacena, JHEP 0305, 013 (2003)