Sub-millimeter emission from type Ia supernova host galaxies at
Abstract
We present deep sub-millimetre observations of seventeen galaxies at , selected through being hosts of a type 1a supernova. Two galaxies are detected directly, and the sample is detected statistically with a mean m flux of 1.01mJymJy, which is higher than locally. We infer that the mean value of in normal galaxies at is comparable to or greater than the mean in local normal galaxies, in agreement with galaxy chemical evolution models and indirect observational evidence. Scaling from the local value given by Rowan-Robinson (2003) gives a mean extinction at of . The dust in the brightest sub-mm object in our sample is best interpreted as normal ‘cirrus’ dust similar to that seen locally. The detection rate of our sample suggests that some sources found in blank-field sub-mm surveys may not be high redshift starbursts, but rather cirrus galaxies at moderate redshifts and with lower star formation rates. Finally, an increase in host dust extinction with redshift may impact the cosmological results from distant supernova searches. This emphasizes the need to carefully monitor dust extinction when using type Ia supernovae to measure the cosmological parameters.
1 Introduction
In recent years, deep surveys have found galaxies and QSOs at redshifts greater than six, making it possible to trace the cosmic history of star formation and AGN activity from the epoch of reionization to the present day. In practice however, achieving these goals is difficult, as translating observations of light from galaxies into measures of stellar content and formation histories is affected by the obscuring effects of dust. Whilst dust obscuration is known to have a significant effect locally (e.g. Tresse & Maddox (1998)), the role of dust at higher redshifts is even more important. Chemical evolution models (Calzetti & Heckman, 1999; Pei et al, 1999) predict that dust obscuration should peak at 2-3 times the current value at , before slowly declining. Observationally, the importance of dust obscuration at high redshifts is exemplified by the very different cosmic star formation histories inferred from optical and infrared surveys. Infrared surveys produce star formation histories that rise more sharply from to , and show a slower decline at higher redshifts, than the star formation histories inferred from optical surveys (Lilly et al, 1996; Madau et al, 1996; Steidel et al, 1999; Rowan-Robinson et al, 1997; Hughes et al, 1998).
These surveys however do not examine extinction evolution in inactive galaxies. Blank-field infrared surveys are biased towards systems containing a dusty starburst or AGN, whereas Lyman Break galaxies are selected on rest-frame UV flux, which may bias them towards having high rates of unobscured star formation. In this paper, we present preliminary results from a program to use deep sub-millimetre observations to investigate the evolution of sub-mm emission and dust opacity with redshift in what should be normal galaxies; the host galaxies of distant type Ia supernovae. Observations and data analysis are described in §2, and results are presented in §3. We discuss mean extinction levels and dust properties in §4, and also mention some implications for deep sub-millimetre surveys and supernova cosmology. We assume , , , and .
2 Observations
The hosts of the type Ia supernovae discovered by the Supernova Cosmology Project (SCP, Perlmutter et al (1999)) and the High Redshift Supernova Search Team (HZT, Riess et al (1998)) are ideal targets for studying the evolution of dust opacity in normal galaxies; the galaxies have spectroscopic redshifts, the galaxies are selected independent of their apparent magnitudes as the discovery is based on the supernova rather than the host, and type Ia supernovae come from evolved stellar populations. Furthermore, since the supernova spectrum must be disentangled from the host galaxy spectrum, none of the host galaxies contain the signature bright emission lines of a starburst or AGN (Riess et al (1998); Perlmutter et al (1999), A Riess priv. comm., G Aldering priv. comm.).
We observed seventeen host galaxies of supernovae discovered by the SCP and the HZT. The only selection criteria were that the host galaxy redshifts should lie in a narrow interval around z=0.5, so that the fluxes could be coadded without -correcting to a common wavelength, and that the supernova in the host should be spectroscopically confirmed as a type Ia. The host galaxies were observed at m and m using the Sub-mm Common User Bolometer Array (SCUBA) on the James Clerk Maxwell Telescope (JCMT). All observations were performed in photometry mode. The atmospheric conditions were of exceptional quality, with a mean m sky opacity of . We note the possibility that sub-mm flux from any of the objects in our sample could in principle arise from a chance-aligned high redshift source, however assuming a sub-mm source density from recent blank-field sub-mm surveys (Eales et al, 1999; Scott et al, 2002; Fox et al, 2002; Borys et al, 2003) and a conservative search radius of (the jiggle offset on photometry mode observations with SCUBA) gives a probability that the flux from any one object in the sample comes from a chance-aligned sub-mm source of approximately 1 in 400. We therefore conclude that any sub-mm flux seen in our sample is most likely due to the target, rather than a background source. The data were reduced using the SCUBA User Reduction Facility (SURF) pipeline using standard methods.
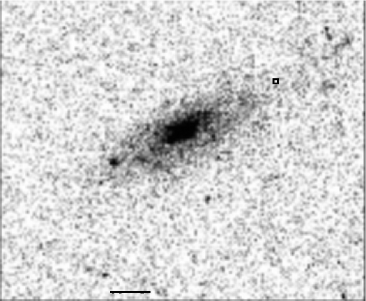
For one host galaxy, that of SN1997ey, we obtained Hubble Space Telescope (HST) imaging from the HST data archive. Observations were taken using the Space Telescope Imaging Spectrograph (STIS) using a clear filter. The data were reduced using the IRAF reduction package calstis. The final image is presented in Figure 1.
3 Results
The sample, their redshifts, and the sub-mm fluxes are presented in Table 1. One object (the host galaxy of SN 1997ey) is detected strongly at both m and m, one object (the host of SN2000eh) is detected at m only, the rest of the sample are undetected individually.
As our sample is randomly selected over a narrow redshift range, we can coadd the observed sub-mm fluxes to measure the mean sub-mm flux of normal galaxies at . We only consider the m fluxes, as the m calibration errors are large. The mean observed m flux for all 17 galaxies is 1.55mJy0.31mJy. The host galaxy of SN1997ey is however significantly brighter than the others, and it is probable that this source is an outlier, and that the flux of this galaxy will bias the mean value significantly. Assuming that the ‘true’ source flux distribution is a Gaussian, then the distribution of fluxes for the whole sample is consistent with a gaussian at only the level, whereas excluding the host of SN1997ey makes the distribution of fluxes consistent with a gaussian at , and excluding any of the remaining sources does not make the fit statistically better. We therefore also quote the error weighted mean flux of the 16 galaxies with the host of SN1997ey excluded, which is 1.01mJymJy, and use this value in the following analysis.
4 Discussion
We first review the origin of sub-mm flux from extragalactic sources, and the relation between sub-mm flux and optical extinction. In many cases sub-mm emission from extragalactic sources arises in starbursts; compact regions (kpc across) containing of dust, heated by young massive stars forming at a rapid rate (yr-1). Since sub-mm emission measures physical dust volume rather than the volume of space the dust is dispersed in, the same level of sub-mm emission can arise from a comparable mass of dust distributed in the disk of a galaxy, heated by the general interstellar radiation field. This type of sub-mm emission, known as ’cirrus’ emission, is seen locally, both in Galactic sources (Casey, 1991), and in nearby galaxies (Bianchi, Davies & Alton, 1999; Dunne et al, 2000). Furthermore, there is evidence that cirrus emission may be important in blank-field sub-mm sources (Efstathiou & Rowan-Robinson, 2003). As our targets contain a type Ia supernova, known to come from evolved stellar populations, and because none of the targets contain optical signatures of starbursts or AGN, we are confident that any sub-mm flux from our targets will be cirrus emission.
The relation between cirrus sub-mm emission and optical extinction has been discussed by Hildebrand (1983), Casey (1991) and Bianchi, Davies & Alton (1999). It turns out that the integrated sub-mm flux from a galaxy, with certain assumptions, scales linearly with . We summarize these arguments here. If the dust responsible for the sub-mm emission is also responsible for the optical extinction, then the ratio of the extinction efficiency in the V band to the emission efficiency in the sub-mm at some wavelength is equal to the ratio of the optical depths:
| (1) |
In the optically thin case, can be written:
| (2) |
where is the sub-mm intensity and is the dust temperature. Solving for gives (Bianchi et al, 1998):
| (3) |
where is the observed wavelength, is a reference wavelength, and is the extinction efficiency at the reference wavelength.
There are two important assumptions in this derivation, which may affect our results. Firstly, even though the fluxes lie within the Rayleigh-Jeans tail, the sub-mm flux still scales linearly with dust temperature, meaning that a mean increase in temperature could be responsible for increasing the sub-mm flux, rather than an increase in optical extinction. However, even assuming pure luminosity evolution between the local Universe and , the mean dust temperature will only increase as the 1/5th power of (i.e. increasing with the mean surface brightness). Furthermore, the predicted rise in dust temperature between z=0 and z=0.5 from chemical evolution models (Pei et al, 1999) is probably of the order 1K or less, insufficient to produce a significant rise in sub-mm flux. Secondly is the gas-to-dust ratio. When using this formula to compare optical extinctions between different objects, it is assumed that the gas-to-dust ratio for both objects is the same. When comparing local galaxies to galaxies at this criterion will not be satisfied; globally we expect significantly less star formation to have occurred by , which may lead to a higher mean gas-to dust ratio than locally. Based on indirect evidence (Pettini et al, 1999), we expect this rise to be no more than at , although at higher redshifts the change may be larger (Pei et al, 1991). As there is no published measure of the gas-to dust ratio in normal galaxies at , we have assumed that the change from the local mean value is negligible.
4.1 Dust opacity evolution in normal galaxies
To establish if the mean sub-mm flux of our sample differs from the mean sub-mm flux of local normal (i.e. inactive) galaxies, we would like to compare to a local sub-mm survey of galaxies selected on optical flux. Currently however, no such survey has been published. Therefore, to estimate the expected observed mean m flux at from normal galaxies if there had been no evolution in dust opacity between the local Universe and , we consider the local sub-millimetre survey of Dunne et al (2000). We have redshifted the mean m flux from this survey to z=0.5, with -corrections derived using the cirrus models from Efstathiou & Rowan-Robinson (2003). The resulting predicted observed m flux at is 0.8mJy mJy. This survey is however of galaxies from the IRAS Bright Galaxy Sample, which selects against galaxies with small dust masses, and is composed of spiral, irregular and interacting systems. The morphologies of the galaxies discovered by the supernova cosmology teams are however known to be spirals and irregulars, and ellipticals (Farrah et al, 2002b; Sullivan et al, 2003). As our sample is randomly selected from the SNeIa discovered by both the SCP and the HZT, it is reasonable to assume that the same morphological mix is present in our sample. In order to compare our value and the ‘no evolution’ value, we must correct the ‘no evolution’ value to reflect the morphological mix in our sample. If we assume that sub-mm emission from ellipticals is negligible, then this gives a predicted ‘no evolution’ flux estimate at of 0.56mJy mJy. Comparing our observed mean m flux of 1.01mJy mJy (i.e. excluding the host of SN1997ey) with this value, implies a rise in sub-mm flux from normal galaxies at compared to locally in the range ( errors). Therefore, our results imply that sub-mm emission from normal galaxies at is comparable to or higher than sub-mm emission from local normal galaxies.
We can use this mean sub-mm flux to estimate the mean value of in spiral and irregular galaxies at . The most recent estimate of mean extinction levels in local normal galaxies (i.e including only an optically thin cirrus component) is that of Rowan-Robinson (2003), who derives , and therefore . Hence, we obtain . This result is in good agreement with indirect observational evidence based on the star formation history of the Universe (Lilly et al, 1996; Rowan-Robinson et al, 1997). It is also in agreement with model predictions for the evolution in dust opacity with redshift (Calzetti & Heckman, 1999), which predict that the change in mean reddening between the local Universe and z=0.5 will be , with a corresponding increase in extinction of , and with chemical evolution models (Pei et al, 1999) which model the evolution of gas and dust mass with redshift.
4.2 Dust properties in spiral galaxies at z=0.5
We now examine the dust properties in the host galaxy of SN1997ey, which was detected at m and m. One possibility is that this galaxy harbours a dust enshrouded starburst that produces the sub-mm flux; such a system would be unsuitable for examining the properties of dust in normal galaxies at . This is however very unlikely, for two reasons. Firstly, as described earlier, none of the optical spectra of the supernova host galaxies from either the SCP or the HZT, from which this galaxy is selected, show signs of an AGN or starburst. Secondly, the HST STIS image for this galaxy, taken after the supernova had faded and presented in Figure 1, shows a disk galaxy with no signs of morphological disturbance that are seen in local (Surace et al, 1998; Farrah et al, 2001; Bushouse et al, 2002) or high redshift (Farrah et al, 2002a) starburst galaxies. We therefore conclude that the observed sub-mm flux comes from the host galaxy of SN 1997ey, and that this galaxy is a normal disk galaxy.
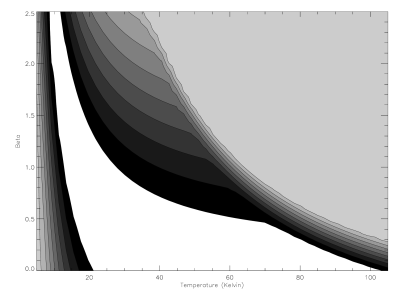
As there exists sub-mm data at only two wavelengths, the properties of the dust in this galaxy are best estimated using a simple greybody formula. Figure 2 shows a reduced distribution plot of and for the dust in the galaxy. Two particularly interesting cases are for , the cirrus or ‘Milky-Way’ type dust solution, and for , the ’grey’ dust solution. Whilst ‘grey’ dust has previously been proposed to exist at high redshifts (Aguirre, 1999), it is notable that, for , the dust temperature range is comparable to that seen locally, and consistent with the models of Pei et al (1999). We therefore find no observational evidence that the dust at high redshift differs fundamentally in nature from the dust seen in the local Universe, and conclude that the dust in the host galaxy of SN1997ey is normal cirrus dust.
4.3 Normal galaxies and sub-millimeter surveys
The detection of one object in our sample, with an m flux of mJy, highlights an alternative interpretation for the nature of some of the sources found in blank-field sub-mm surveys. We have observed 17 galaxies which have , and detected one of them at an m flux of mJy. There are approximately 3000 galaxies per sq deg at this magnitude, so our detection rate is per sq deg. Whilst statistics based upon one object are obviously not trustworthy, it is interesting that this detection rate agrees surprisingly well with the detection rate reported in previous blank-field sub-mm surveys to comparable depths (Scott et al, 2002; Fox et al, 2002), who find 19 objects to 8 mJy in 260 sq arc min, or 270 per sq deg.
The nature of our source, and the assumed nature of blank-field survey sub-mm sources, are different. Blank-field survey sub-mm sources are generally thought to lie at , and to be galaxies undergoing extreme bursts of dust-shrouded star formation (Fox et al, 2002). The redshift, luminosity and star formation rates are however in many cases estimated using only a limited set of photometric data. Our detection, which has a comparable flux to the sources found in these surveys, lies at and, judging by the coldness of the dust and morphology of the galaxy, is forming stars at a more sedate rate. Whilst some sub-mm sources do now have spectroscopic redshifts that put most of them at (Lilly et al, 1999; Chapman et al, 2003), it is reasonable to infer that some of the sub-mm sources in blank-field surveys are at lower redshifts than previously thought, and also have lower star formation rates. Whilst the star formation rates in these sources will be high, they still need to be carefully accounted for in current and future sub-mm surveys, to avoid overestimating the global history of star formation.
4.4 Implications for supernova cosmology
There is now strong, albeit indirect, evidence from observations of the cosmic microwave background (Jaffe et al, 2001; Spergel et al, 2003), and of large-scale structure (Peacock et al, 2001) that the total density of the Universe is dominated by ’dark energy’. To determine the nature of dark energy, it is necessary to track the evolution of dark energy with redshift directly, using a cosmological standard candle. Currently, the only method deployed to do this uses the luminosity distances of distant type Ia supernovae. The HZT and the SCP have performed surveys to find high redshift supernovae, and both groups claim that dark energy dominates the total density of the Universe, and that the expansion of the Universe is currently accelerating (Riess et al, 1998; Perlmutter et al, 1999). The HZT have further claimed (Riess et al, 2001) to have found an earlier epoch of decelerating expansion, based on an apparent relative brightening of SNeIa at and that accelerating expansion commenced at . This relative brightening supports a real, ’cosmological’ influence on the supernova magnitudes, as alternative explanations (e.g. ‘grey’ dust, progenitor evolution) do not readily predict this relative brightening at .
These results are based upon the distant supernovae being m = 0.40 dimmer (with a flat Universe prior) than if the expansion of the Universe was decelerating. There are alternative interpretations that can in principle account for this dimming, one of these being host galaxy extinction. The issue of extinction towards distant type Ia supernovae has been examined in detail by both the SCP and the HZT by measuring the reddening of the supernova light curves; the SCP by comparing the rest-frame colours of their low and high redshift samples, and the HZT by fitting to the light-curves via the MLCS method. The SCP find that the reddening of both their local and distant sample, after a small number of reddened supernovae are removed, has a small scatter with a mean value of close to zero. The HZT find that only a few of their distant supernovae are significantly reddened. An analysis of the colour excesses derived from the supernova light curves as a function of host galaxy morphology by the SCP (Sullivan et al, 2003) also found only a modest difference in extinction between the SNe in ellipticals and those SNe in spirals, with for the SNe in the ellipticals and for the SNe in spirals. Our result, of a mean value of in galaxies at that is higher than locally, does not cast any doubt on the supernova teams results, as this extinction level at lies within of the local value, and is derived from the mean extinction in each galaxy rather than the line of sight extinction towards the supernovae. It does however highlight the need for caution in general in using supernovae as probes of the expanding Universe, as our derived mean extinction, , implies a rise that is at face value comparable to the dimming ascribed to dark energy. Therefore, our result emphasizes the need to accurately monitor the extinction towards distant supernovae if they are to be used in measuring the cosmological parameters.
5 Summary
We have presented deep sub-mm observations of seventeen type Ia supernova host galaxies at , from which we conclude the following:
1) The mean observed-frame sub-mm flux of the sample, excluding one bright object, is mJymJy. Assuming that sub-mm flux scales linearly with optical extinction, then this implies a rise in optical extinctions in normal, inactive galaxies compared to locally of . Scaling from the local value of given by Rowan-Robinson (2003) for optically thin cirrus emission gives . This result is in good agreement with both chemical evolution models (Pei et al, 1999; Calzetti & Heckman, 1999) and with other, indirect, observational evidence (Lilly et al, 1996; Rowan-Robinson et al, 1997). The temperature and emissivity of the dust in the brightest sub-mm object in our sample are comparable to the temperature and emissivity of dust in local galaxies.
2) The discovery of a moderate redshift disk galaxy with a sub-milliimetre flux comparable to the sources found in blank-field sub-mm surveys suggests that some of these blank-field sources may not be high redshift starbursts, but lower redshift dusty disks. These sources must be carefully accounted for in current and future sub-mm surveys, to avoid overestimating the global history of star formation.
3) Our results, when combined with previous work, infer a level of extinction in galaxies at that could in principle produce a dimming that is comparable in size to the dimming ascribed to accelerated expansion, although the error on the value is large and the extinction level is the mean for the galaxy rather than the line of sight extinction towards the supernovae. This emphasizes the need to carefully monitor extinction levels towards distant supernovae if they are to be used to track the expansion rate history of the Universe.
References
- Aguirre (1999) Aguirre A., 1999, ApJ, 525, 583
- Bianchi et al (1998) Bianchi S., Alton P. B., Davies J. I., Trewhella M., 1998, MNRAS, 298, L49
- Bianchi, Davies & Alton (1999) Bianchi S., Davies J. I., Alton P. B., 1999, A&A, 344, L1
- Borys et al (2003) Borys C., Chapman S., Halpern M., Scott D., 2003, MNRAS, 344, 385
- Bushouse et al (2002) Bushouse H. A., et al, 2002, ApJS, 138, 1
- Calzetti & Heckman (1999) Calzetti D., Heckman T. M., 1999, ApJ, 519, 27
- Casey (1991) Casey S. C., 1991, ApJ, 371, 183
- Chapman et al (2003) Chapman S. C., Blain A. W., Ivison R. J., Smail I., 2003, Nat, 422, 695
- Dunne et al (2000) Dunne L., Eales S., Edmunds M., Ivison R., Alexander P., Clements D. L., 2000, MNRAS, 315, 115
- Eales et al (1999) Eales S.A., Lilly S.J., Gear W.K., Bond J.R., Dunne L., Hammer F., Le Fevre O., Crampton D., 1999, ApJ, 515, 518
- Efstathiou & Rowan-Robinson (2003) Efstathiou A., Rowan-Robinson M., 2003, MNRAS, 343, 322
- Farrah et al (2001) Farrah D., et al, 2001, MNRAS, 326, 1333
- Farrah et al (2002a) Farrah D., Verma A., Oliver S., Rowan-Robinson M., McMahon R., 2002a, MNRAS, 329, 605
- Farrah et al (2002b) Farrah D., Meikle W. P. S., Clements D., Rowan-Robinson M., Mattila S., 2002b, MNRAS, 336 L17
- Fox et al (2002) Fox M. J., et al, 2002, MNRAS, 331, 839
- Hildebrand (1983) Hildebrand R. H., 1983, QJRAS, 24, 267
- Hughes et al (1998) Hughes D. H., et al, 1998, Nat., 394, 241
- Jaffe et al (2001) Jaffe A. H., et al, 2001, PhRvL, 86, 3475
- Leibundgut (2001) Leibundgut B., 2001, ARA&A, 39, 67
- Lilly et al (1996) Lilly S. J., Le Fevre O., Hammer F., Crampton D., 1996, ApJ, 460, L1
- Lilly et al (1999) Lilly S.J., et al., 1999, ApJ, 518, 641
- Madau et al (1996) Madau P., Ferguson H. C., Dickinson M. E., Giavalisco M., Steidel C. C., Fruchter A., 1996, MNRAS, 283, 1388
- Peacock et al (2001) Peacock J., et al, 2001, Nat., 410, 169
- Pei et al (1991) Pei Y. C., Fall S. M., Bechtold J., 1991, ApJ, 378, 6
- Pei et al (1999) Pei Y. C., Fall S. M., Hauser M. G., 1999, ApJ, 522, 604
- Perlmutter et al (1999) Perlmutter S., et al, 1999, ApJ, 517, 565
- Pettini et al (1999) Pettini M., Ellison S. L., Steidel C. C., Bowen D. V., 1999, ApJ, 510, 576
- Phillips et al (1999) Phillips M. M., Lira P., Suntzeff N. B., Schommer R. A., Hamuy M., Maza J., 1999, AJ, 118, 1766
- Riess et al (1998) Riess A. G., et al, 1998, AJ, 116, 1009
- Riess et al (2001) Riess A. G., et al, 2001, ApJ, 560, 49
- Rowan-Robinson et al (1997) Rowan-Robinson M., et al, 1997, MNRAS, 289, 490
- Rowan-Robinson (2002) Rowan-Robinson M., 2002, MNRAS, 332, 352
- Rowan-Robinson (2003) Rowan-Robinson M., 2003, MNRAS, 344, 13
- Scott et al (2002) Scott S. E., et al, 2002, MNRAS, 331, 817
- Spergel et al (2003) Spergel D. N., et al, 2003, ApJS, 148, 175
- Steidel et al (1999) Steidel C. C., Adelberger K. L., Giavalisco M., Dickinson M., Pettini M., 1999, ApJ, 519, 1
- Sullivan et al (2003) Sullivan M., et al, 2003, MNRAS, 340, 1057
- Surace et al (1998) Surace J. A., Sanders D. B., Vacca W. D., Veilleux S., Mazzarella J. M., 1998, ApJ, 492, 116
- Tresse & Maddox (1998) Tresse L., Maddox S. J., 1998, ApJ, 495, 691
| Host | Origina | Redshift | ||||
|---|---|---|---|---|---|---|
| SN1994al | SCP | 0.42 | 5.49 | 47.08 | 3.01 | 2.70 |
| SN1995aq | SCP | 0.45 | 9.52 | 9.48 | -1.33 | 1.49 |
| SN1995as | SCP | 0.50 | -6.10 | 5.20 | -0.31 | 1.19 |
| SN1995ay | SCP | 0.48 | -4.10 | 4.13 | 0.87 | 1.17 |
| SN1995az | SCP | 0.45 | 9.23 | 8.45 | 2.56 | 1.45 |
| SN1996cg | SCP | 0.49 | 3.46 | 3.90 | -1.11 | 1.04 |
| SN1997f | SCP | 0.58 | 2.34 | 4.76 | 1.79 | 1.10 |
| SN1997l | SCP | 0.55 | -0.14 | 12.96 | 1.93 | 1.76 |
| SN1997em | SCP | 0.46 | 0.24 | 6.45 | -0.68 | 1.38 |
| SN1997ep | SCP | 0.48 | 4.12 | 4.09 | 2.01 | 1.06 |
| SN1997ey | SCP | 0.58 | 20.80 | 3.54 | 7.80 | 1.10 |
| SN1999fn | HZT | 0.47 | 1.87 | 7.04 | -0.12 | 1.28 |
| SN2000dz | HZT | 0.50 | -0.51 | 8.21 | 1.87 | 1.38 |
| SN2000ea | HZT | 0.42 | -10.90 | 13.80 | 2.45 | 2.02 |
| SN2000ee | HZT | 0.47 | 1.96 | 4.63 | 1.23 | 1.06 |
| SN2000eg | HZT | 0.54 | 5.92 | 4.20 | 1.29 | 1.16 |
| SN2000eh | HZT | 0.49 | 5.18 | 6.65 | 4.61 | 1.53 |
Fluxes are quoted in the observed frame and are given in mJy. Errors are . aGroup responsible for discovering the supernova: ‘SCP’ is the Supernova Cosmology Project, ‘HZT’ is the High Redshift Supernova Search Team.