11email: boschin,girardi@ts.astro.it 22institutetext: Instituto de Astrofisica de Canarias, E-38200 La Laguna, Tenerife, Spain
22email: rbarrena@ll.iac.es 33institutetext: INAF - Telescopio Nazionale Galileo, Roque de Los Muchachos, PO box 565, 38700 Santa Cruz de La Palma, Spain 44institutetext: INAF - Osservatorio Astronomico di Trieste, via Tiepolo 11, 34131 Trieste, Italy
44email: biviano,ramella@ts.astro.it 55institutetext: Istituto di Radioastronomia del C.N.R., via Gobetti 101, 40129 Bologna, Italy
55email: lferetti@ira.cnr.it
Internal dynamics of the radio–halo cluster A2219:
a
multi–wavelength analysis ††thanks: Based on observations made on the
island of La Palma with the Italian Telescopio Nazionale Galileo (TNG)
operated by the Centro Galileo Galilei of the INAF (Istituto Nazionale
di Astrofisica) and with the 1.0m Jacobus Kapteyn Telescope (JKT)
operated by the Isaac Newton Group at the Spanish Observatorio de
Roque de los Muchachos of the Instituto de Astrofisica de Canarias.
We present the results of the dynamical analysis of the rich, hot, and X–ray very luminous galaxy cluster A2219, containing a powerful diffuse radio–halo. Our analysis is based on new redshift data for 27 galaxies in the cluster region, measured from spectra obtained at the TNG, with the addition of other 105 galaxies recovered from reduction of CFHT archive data in a cluster region of radius ( Mpc at the cluster distance) centered on the cD galaxy. The investigation of the dynamical status is also performed by using X–ray data stored in the Chandra archive. Further, valuable information comes from other bands – optical photometric, infrared, and radio data – which are analyzed and/or discussed, too. We find that A2219 appears as a peak in the velocity space at , and select 113 cluster members. We compute a high value for the line–of–sight velocity dispersion, km s-1, consistent with the high average X–ray temperature of 10.3 keV. If dynamical equilibrium is assumed, the virial theorem leads to for the global mass within the virial region. However, further investigation based on both optical and X–ray data shows significant signs of a young dynamical status. In fact, we find strong evidence for the elongation of the cluster in the SE–NW direction coupled with a significant velocity gradient, as well as for the presence of substructure both in optical data and X–ray data. Moreover, we point out the presence of several active galaxies. We discuss the results of our multi–wavelength investigation suggesting a complex merging scenario where the main, original structure is subject to an ongoing merger with few clumps aligned in a filament in the foreground oriented along an oblique direction with respect to the line–of–sight. Our conclusion supports the view of the connection between extended radio emission and merging phenomena in galaxy clusters.
Key Words.:
Galaxies: clusters: general – Galaxies: clusters: individual: Abell 2219 – Galaxies: distances and redshifts – intergalactic medium – Cosmology: observations1 Introduction
In the hierarchical scenario for large–scale–structure formation, mergers are an essential ingredient of galaxy cluster evolution (e.g., White whi97 (1997); Evrard & Gioia evr02 (2002)).
One of the most recent aspects of the merging phenomenology is the possible connection of cluster mergers with the presence of extended, diffuse radio sources, halos and relics (Feretti fer99 (1999); Buote buo02 (2002); Giovannini & Feretti gio02 (2002)). Radio–halos are located at the cluster center, with typical sizes of 0.5 Mpc, regular shape, steep radio spectra and no significant polarization; while relics are located in peripheral regions of the clusters, with irregular shape and generally highly polarized spectra (e.g., Feretti & Giovannini fer96 (1996); Giovannini & Feretti gio02 (2002)). The synchrotron radio emission of halos and relics demonstrates the existence of large scale cluster magnetic fields, of the order of 0.1–1 G, and of widespread relativistic particles of energy density 10-14 – 10-13 erg cm-3. Although the properties of halos and relics are not well understood, several suggestions for the mechanism transferring energy to the relativistic electrons have been made (e.g., Ensslin ens00 (2000)).
Cluster mergers were suggested to provide the large amount of energy necessary for electron re–acceleration and magnetic field amplification (Feretti fer99 (1999); Feretti fer02 (2002); Sarazin sar02 (2002)). However, the precise radio–halo formation scenario is still debated (e.g., Ensslin & Röttgering ens02 (2002)). In fact, the diffuse radio sources are quite uncommon and only recently we can study these phenomena on the basis of a sufficient statistics ( clusters up to , e.g., Giovannini et al. gio99 (1999); see also Giovannini & Feretti gio02 (2002)).
Presently, growing evidence of connection between diffuse emission and cluster merging is based on X–ray data (e.g., Böhringer & Schuecker boh02 (2002); Buote buo02 (2002)). Studies based on a large number of clusters have found a significant relation between the radio and the X–ray surface brightness (Govoni et al. gov01 (2001)) and connections between the presence of radio–halos/relics and irregular and bimodal X–ray surface brightness distribution (Schuecker et al. sch01 (2001)). However, we are far from understanding the whole picture. Unfortunately, to date optical data is lacking or poorly exploited. Sparse literature concerns some few individual clusters (e.g., Colless & Dunn col96 (1996); Gómez et al. gom00 (2000); Barrena et al. bar02 (2002); Mercurio et al. mer03 (2003)).
Optical data are a powerful way to investigate the presence and the dynamics of cluster mergers (e.g., Girardi & Biviano gir02 (2002)), too. The spatial and kinematic analysis of member galaxies allow us to detect and measure the amount of substructure, to identify and analyze possible pre–merging clumps or merger remnants. This optical information is really complementary to X–ray information since galaxies and ICM react on different time scales during a merger (see numerical simulations by Roettiger et al. roe97 (1997)). Moreover, additional information comes from spectral types of member galaxies, since cluster mergers could stimulate star formation in cluster galaxies; thus the spectral signatures of past activity are useful to determine the relevant time–scales (e.g., Bekki bek99 (1999); Terlevich et al. ter99 (1999)).
To investigate the connection between diffuse radio sources and cluster mergers, we have performed spectroscopic observations at TNG and a multi–wavelength analysis of the Abell cluster A2219 (Abell et al. abe89 (1989)). This cluster shows the presence of a powerful radio–halo (Giovannini et al. gio99 (1999); Bacchi et al. bac03 (2003)) and is a rich, X–ray luminous, hot cluster at moderate redshift – Abell richness (Abell et al. abe89 (1989)); (0.1–2.4 keV)5 erg s-1 (Ebeling et al. ebe96 (1996)); 10 keV (Rizza et al. riz98 (1998)). Possible evidence of the young dynamical status of A2219 comes from the ROSAT/HRI X–ray data analysis and strong/weak lensing features (Rizza et al. riz98 (1998); Smail et al. sma95 (1995); Dahle et al. dah02 (2002)).
This paper is organized as follows. We present the new redshift data of A2219 in Sect. 2 and the analysis of optical data in Sect. 3. Our analysis of recent X–ray Chandra archival data is shown in Sect. 4. Active galaxies are analyzed and discussed on the basis of multi–wavelength data using also mid–IR and radio data in Sect. 5. Finally, in Sect. 6, we summarize and discuss our results suggesting a tentative picture of the dynamical status of A2219.
Unless otherwise stated, we give errors at the 68% confidence level (hereafter c.l.)
Throughout the paper, we assume a flat cosmology with and . For the sake of simplicity in rescaling we adopt a Hubble constant of 100 km s Mpc. In this context, 1 corresponds to Mpc.
2 Optical observations and data reduction
Multi–object spectroscopic observations of A2219 were carried out at the TNG telescope in May 2003 during the program of proposal AOT–7 ID:18. We used DOLORES/MOS with the LR–B Grism 1, yielding a dispersion of 187 Å/mm, and the Loral CCD of pixels (pixel size of 15 m). This combination of grating and detector results in dispersions of 2.8 Å/pix. We have taken 1 MOS mask with 39 slits. We acquired two exposures of 1800.0 s each. Wavelength calibration was done using arc lamps before or after each exposure (Helium–Argon).
Reduction of spectroscopic data was carried out with IRAF 111IRAF is distributed by the National Optical Astronomy Observatories, which are operated by the Association of Universities for Research in Astronomy, Inc., under cooperative agreement with the National Science Foundation.. The signal-to-noise ratio per pixel was computed from the ratio between the signal at 6000 Å and the noise within 4000-7000 Å. The resulting average signal-to-noise ratio of our spectra is S/N16.
Radial velocities are determined using the cross–correlation technique (Tonry & Davis ton79 (1979)) implemented in the RVSAO package (developed at the Smithsonian Astrophysical Observatory Telescope Data Center). Each spectrum is correlated against six templates for a variety of galaxy spectral types: E, S0, Sa, Sb, Sc, Ir (Kennicutt ken92 (1992)). The template producing the highest value of , i.e., the parameter given by RVSAO and related to the signal–to–noise of the correlation peak, is chosen. Moreover, all spectra and their best correlation functions are examined visually to verify the redshift determination. In some ambiguous cases, generally very late type galaxies, we use EMSAO package to confirm the estimated redshift, and in two cases we take the EMSAO redshift as a more reliable estimate of the redshift.
Out of the 39 spectra of objects, 9 turned out to be objects at (included alignment stars for masks), while for 3 cases, with , we cannot determine the redshift. Thus, we obtain spectra for 27 galaxies.
We added to our data observations stored in CFHT archive (proposal ID: 01AF37, P.I.: J.P. Kneib): 1 MOS mask of one 1800 s –exposure with 155 slits. We reduced the spectra with the same procedure adopted for TNG ones. We succeeded in obtaining spectra for 111 galaxies, 6 of which are in common with TNG galaxies. The average S/N of these CFHT spectra is 8.
In order to combine our TNG data with those from CFHT archive, we have to check for a possible zero–point correction. To this aim we use the six galaxies with double redshift determination. This allow us to obtain a more rigorous estimate for the redshift errors since the nominal errors as given by the cross–correlation are known to be smaller than the true errors (e.g., Malamuth et al. mal92 (1992); Bardelli et al. bar94 (1994); Ellingson & Yee ell94 (1994); Quintana et al. qui00 (2000)). Thus, for the six galaxies with double redshift determination, we fit the first determination vs. the second one by using a straight line and considering errors in both coordinates (e.g., Press et al. pre92 (1992)). The fitted line agrees with the one to one relation (slope=, intercept=), but the small value of –probability indicates a poor fit, suggesting that the nominal cross–correlation errors are underestimated. Only when nominal errors are multiplied by a factor the observed scatter can be explained. Therefore, hereafter we assume that true errors are larger than nominal cross–correlation errors by a factor 2.3. Slightly smaller correction factors are obtained for nearby clusters (e.g., Malamuth et al. mal92 (1992); Bardelli et al. bar94 (1994); Quintana et al. qui00 (2000)).
Our spectroscopic catalogue consists of 132 galaxies sampling a cluster region of 5 around the dominant galaxy (no. 65), which is a cD galaxy (e.g., Allen et al. all92 (1992)).
We also determined the equivalent widths (EW hereafter) of the emission line [OII] and the absorption line H, which are good indicators of current and recent star formation, respectively. Hereafter all the EW are in angstroms and are positive if the line is in absorption and negative if the line is in emission. We estimate minimum measurable EW as the width of a line spanning 2.8 Å(our dispersion) in wavelength, with an intensity three times the rms noise in the adjacent continuum.
A variety of spectroscopic–classification schemes are presented in the literature (see, e.g., Couch et al. cou94 (1994); Dressler et al. dre99 (1999) and refs. therein). We use a conservative approach leading to a sparse classification ( of the sample, see Table 1). We define –type galaxies those showing strong active star formation as indicated by the presence of an [OII] line with an equivalent width of EW([OII]) Å (e.g., Hammer et al. ham97 (1997); Postman et al. pos98 (1998)). Out of galaxies having S/N we define –type, those with strong Balmer absorption EW(H) Å (e.g., the “post–starburst” galaxies by Couch et al. cou94 (1994)). We find fourteen “active” galaxies: four of –type — measured EW([OII]) in the range Å; ten of –type — measured EW(H) in the range [4.0;12.4] Å. Out of non active galaxies with S/N those (37) with measured EW(H)3 Å are classified as passive galaxies (–type) and the remaining nine galaxies, intermediate between and are classified as –type. Non active galaxies do not show significant [OII] emission and only two –galaxies show a very small [OII] emission (-3.5Å).
As far as photometry is concerned, we obtained exposures on a unvignetted field centered on , (J2000) through B and R Harris filters using the CCD camera mounted on the 1m JKT telescope (at Roque de los Muchachos Observatory, La Palma) in July 2003. We performed several exposures for total integration times of 3000 and 7200 s in R and B band, respectively, with seeing conditions about 1.4. We carried out the image reduction (bias, flat and fringing corrections) using IRAF package and photometry using AUTOMAG SExtractor procedure (Bertin & Arnouts ber96 (1996)). This photometry was calibrated using Landolt’s standard fields at the JKT and TNG telescopes and transformed into the Johnson filter system. We estimate that our photometric sample is complete down to R= 19.7 and B=21.4 within the observed field.
We assign R magnitudes to 131 out of the 132 galaxies of our spectroscopic catalogue: the only exception is galaxy no. 52, which is too close to a very bright star. Out of these 131 galaxies, 129 have assigned magnitudes in B band, too. We measure redshift for galaxies down to mag, but a high level of completeness is obtained only for bright galaxies (66% completeness for R19.7 mag).
Note. The velocities and nominal cross–correlation errors (in km sec-1) for 6 galaxies spectroscopically observed both with the TNG and the CFHT, respectively, are given below:
#38 (10673073; 106738148); #53
(6833448; 6822759); #65 (6725931; 6737249); #98
(6676646; 6707449); #107 (6775835; 6792146); #108
(6746249; 6752934).
Table 1 lists the velocity catalogue222The coordinates of non-galaxy objects are available upon request. (see also Fig. 1): identification number of each galaxy, ID (Column 1); right ascension and declination, and (J2000, Column 2); R magnitudes (Column 3); B–R colours (Column 4); heliocentric radial velocities, (in km s-1, Column 5) with assumed errors, , i.e., the nominal ones given by cross–correlation technique multiplied by 2.3 (Column 6); the code for the spectral classification SC, where “I” and “R” indicate mid–IR and radio emitting galaxies, respectively (see Sect. 5), (Column 7); the telescope used to obtain the spectra (Column 8, T and C indicate TNG and CFHT, respectively).

3 Optical analysis
3.1 Member selection and global properties
According to the analysis of the redshift distribution based on the one–dimensional adaptive kernel technique (Pisani pis93 (1993), see also Fadda et al.’s fad96 (1996) and Girardi et al. gir96 (1996)) A2219 appears as a peak at in redshift space (Fig. 2). Out of 132 galaxies with redshift, fourteen are foreground objects and three are background objects. In particular, the foreground galaxies form two peaks, one of six galaxies at and one of eight galaxies at .
In order to reject possible interloper galaxies in the main peak we apply the procedure of the “shifting gapper” of Fadda et al. (fad96 (1996)), which combines velocity and position information. This procedure rejects galaxies that are too far in rest–frame velocity () from the main body of galaxies within a fixed radial bin shifted along the distance from the cluster center. According to Fadda et al. prescriptions, we use a gap of km sand a bin of 0.4 Mpc, or large enough to include 15 galaxies. As for the cluster center, based on the two–dimensional kernel analysis, we find that the densest peak is centered at R.A. and Decl. , very close to the cD galaxy position; thus hereafter we assume the cD position as the cluster center R.A. and Decl. . The shifting gapper procedure rejects two galaxies as non–members. They are indicated by crosses in Fig. 3, which shows the velocity histogram of the 113 selected cluster members. In order to check the reliability of the member selection procedure, we also apply the method by den Hartog & Katgert (den96 (1996)). Out of the initial 132 galaxies with redshift we find the same 113 cluster members.


The mean cluster velocity km sis computed by using the biweight estimator (ROSTAT package; Beers et al. bee90 (1990)). We estimate the line–of–sight velocity dispersion, , by using the biweight estimator and applying the cosmological correction and the usual correction for velocity errors (Danese et al. dan80 (1980)). We obtain km s-1, where errors are obtained with the bootstrap technique. Assuming that the system is in dynamical equilibrium, the value of leads to a value of the radius of the collapsed, quasi–virialized region of Mpc (Carlberg et al. car97 (1997)) and a virial mass estimate of , (Girardi et al. gir98 (1998); Girardi & Mezzetti gir01 (2001)).
The high value of is confirmed also if we apply a tighter member selection (i.e., using a bin of 0.25 Mpc in the shifting gapper): only another three galaxies are rejected –those with the lowest velocities– resulting in km s-1for the remaining galaxies. Moreover, we compute the differential and integral mean velocity and velocity dispersion profiles in Fig. 4: this analysis shows that the global values of and are already reached within the central cluster region of 0.1–0.2 Mpc. The conclusion of the above analyses is that contamination by obvious field interlopers and/or close cluster companions cannot explain the high value of the global velocity dispersion. More probably, this value is connected with the peculiarity of the internal dynamics of the cluster itself, which will be analyzed below.

3.2 Internal dynamics
As a first step in the study of internal dynamics we analyze the velocity distribution. We consider three estimators of Gaussianity: the kurtosis; the skewness, and the scaled tail index (see, e.g., Beers et al. bee91 (1991)). We find no significant evidence that the velocity distribution differs from a Gaussian. Moreover, we do not find any evidence of a peculiar velocity of the cD galaxy with respect to the average velocity of cluster members (see Gebhardt & Beers geb91 (1991)).
In order to investigate the velocity field we divide galaxies in a low and a high–velocity samples by using the median cluster velocity and check the difference between the two distributions of galaxy positions. Fig. 5 shows that low and high–velocity galaxies are segregated roughly along the E–W direction. The two distributions are different at the c.l. according to the two–dimensional Kolmogorov–Smirnov test (hereafter 2DKS–test; see Fasano & Franceschini fas87 (1987), as implemented by Press et al. pre92 (1992)). In order to estimate the direction of the velocity gradient we perform a multiple linear regression fit to the observed velocities with respect to the galaxy positions in the plane of the sky (see also den Hartog & Katgert den96 (1996); Girardi et al. gir96 (1996)): we find a PA degrees (measured counter–clock–wise from the North, see Fig. 5).

Moreover, we compute the mean velocity and LOS velocity dispersion separately for each one of the four samples corresponding to the NE, SE, SW and NW cluster sectors. Table 2 shows that mean velocities are larger in the Western than in the Eastern sectors in agreement with the above analyses. As for , this is largest in the SE sector and smallest in the NW sector: the difference is significant at the c.l. according to the F–test (Press et al. pre92 (1992)).
To check for the presence of three–dimensional substructure we compute the –statistics devised by Dressler & Schectman (dre88 (1988)) and establish its significance running 1000 Monte Carlo simulations, in which we randomly shuffle galaxy velocities. The signal of substructure is significant at the 95% c.l.. In Fig. 6 we plot the distribution on the sky of all galaxies, each marked by a circle: the larger the circle, the larger is the deviation of the local parameters from the global cluster parameters, i.e., there is more evidence for substructure. The most likely substructure lies close to the cluster center roughly to the SE of the cD galaxy.

3.3 Colour segregation and 2-D galaxy distribution
We check for possible colour segregation of galaxies by using the 110 member galaxies for which we have B–R colours. We obtain a correlation between and colour (at the c.l.). We divide the sample in two subsamples with colours bluer and respectively redder than the median B–R colour=2.12. We obtain that the velocity dispersions of the two subsamples differ at the c.l. ( and km sfor the B–R 2.12 and B–R 2.12 galaxies, respectively).

To further investigate the above difference we also use the colour–magnitude relation (hereafter CMR), which indicates the early–type galaxy locus,
| (1) |
obtained by using a 2 sigma–clipping fitting procedure (see Fig. 7). Blue objects are defined to be those galaxies at least 0.25 mag bluer in B–R than the colour of the CMR. These blue galaxies have typically B–R, thus include Sa spiral galaxies and exclude elliptical galaxies (according to the expected typical colours). The remaining objects, which we define the red sample, should consist most of ellipticals and lenticulars. Moreover, we further divide red galaxies in two subsamples: very red and not–very red galaxies, depending on their location above or below the CMR. Table 3 shows and estimates for blue and red galaxies, and separately for very and not–very red galaxies. We point out that the populations of very red and not–very red galaxies are different. In fact, the of not–very red galaxies is larger than the of very red ones (at the c.l. according to the F–test). Moreover, the mean velocity of not–very red galaxies is smaller than that of very red ones (at the c.l. according to the means–test).
We also analyze the two–dimensional spatial distribution of galaxies. First, we consider bright cluster members, i.e. the sample of 80 galaxies with R for which we have a good level of spatial completeness (see Sect. 2). Fig. 8 shows the presence of two clumps in the cluster center which defines a SE–NW elongated structure (PA): the main peak roughly coincides with the cD position, and the secondary peak – at the West – traces the filament of high velocity galaxies well visible in Fig. 1 (from no. 49 to no. 28). The cD also shows an elongation in the SE–NW direction described by the position angle on the celestial sphere PA degrees (Smail et al. sma95 (1995)).
Then, to study fainter galaxies and to work with a much more robust statistics, we consider the B and I photometric data of Smail et al. (sma98 (1998)) and define likely members using the CMR. Specifically, we select 484 likely cluster members considering objects (I, stellar index ) within 0.25 mag from the . The top panel of Fig. 9 shows a main structure centered on the cD galaxy and elongated in the SE–NW direction, with a PA of for the central region (along the filament described above) and a larger PA for the external region. A similar structure is also traced by the subsample of very red galaxies – those above the CMR (Fig. 9 middle panel). Instead, the distribution of not very red galaxies shows three main clumps aligned in the NE–SW direction (Fig. 9 bottom panel). In particular, the densest peak is located at about South–East of the cD, in the position of the substructure suggested by the Dressler–Schectman test (Sect. 3.2).


4 X–ray observation and analysis
The X–ray analysis of A2219 is performed on the archival data of the Chandra ACIS–S observation 800072 (exposure ID #896, P.I.: J. Houck). The pointing has an exposure time of 42.8 ks. Data reduction is performed by using the package CIAO333CIAO is freely available at http://asc.harvard.edu/ciao/ (Chandra Interactive Analysis of Observations) on chip S3 (field of view ). First, we remove events from the level 2 event list with a status not equal to zero and with grades one, five and seven. Then, we select all events with energy between 0.3 and 10 keV. In addition, we clean bad offsets and examine the data filtering out bad columns and removing times when the count rate exceeds three standard deviations from the mean count rate per 3.3 s interval. We then clean S3 chip for flickering pixels, i.e., times where a pixel has events in two sequential 3.3 s intervals. The resulting exposure time for the reduced data is 42.3 ks.
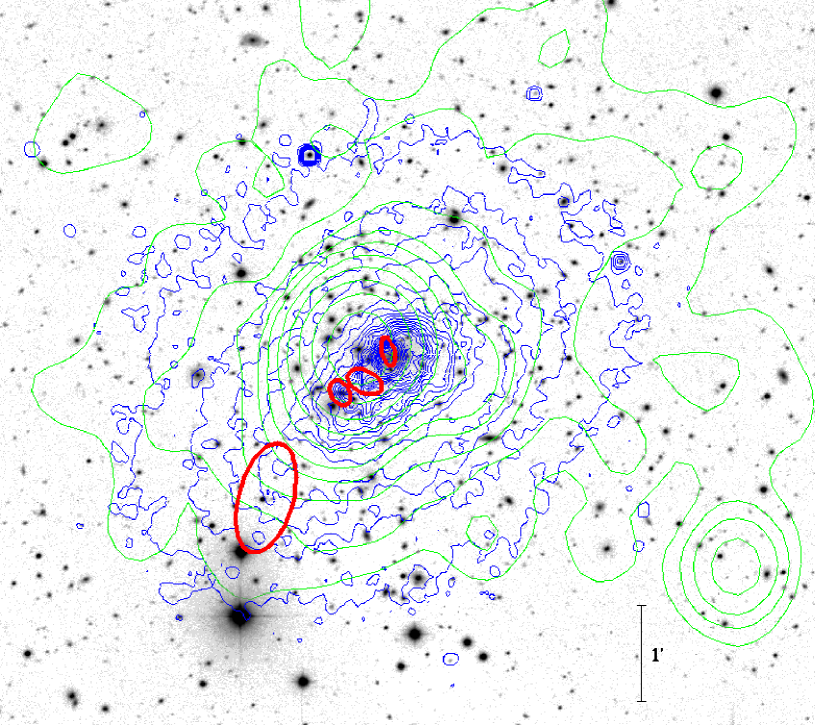
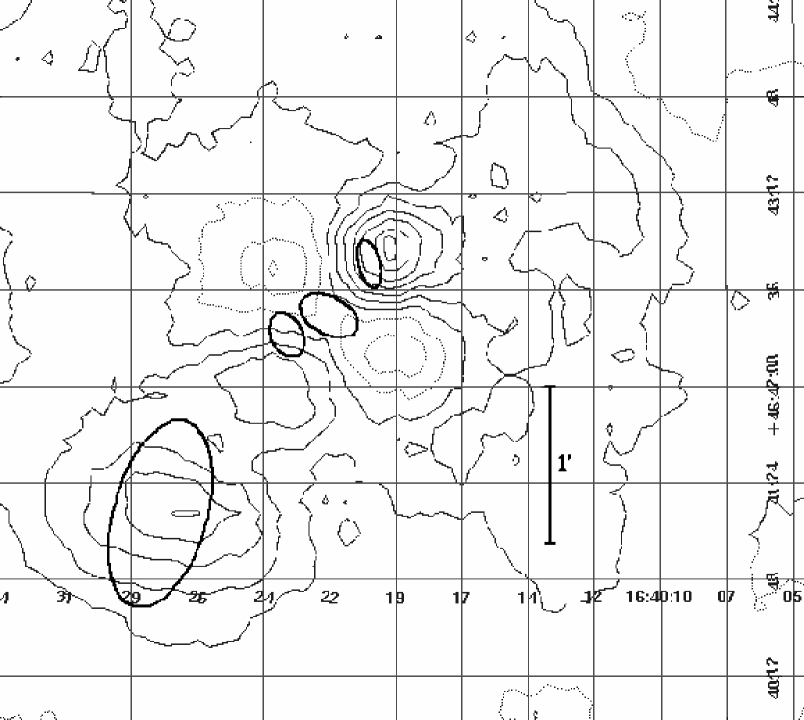
In Fig. 10 we plot an R–band image of the cluster with superimposed the X–ray contour levels of the Chandra image and the radio contour levels of a low–resolution VLA image by Bacchi et al. (bac03 (2003)). The elongated shape of the cluster is clearly visible. By using the CIAO package Sherpa we fit an elliptical Beta model to the X–ray photon distribution to quantify the departure from the spherical shape. The model is defined as follows:
| (2) |
where the radial coordinate is defined as , and . Here and are physical pixel coordinates on chip S3. The best fit centroid position is located 12 South–East of the dominant galaxy. The best fit core radius, the ellipticity and the position angle are 1.3 arcsec (1773 kpc), 0.006 and PA=128.80.6 degrees, respectively. The elongated shape of the cluster is also in agreement with Rizza et al’s (riz98 (1998)) result, who found evidence of elongations and excesses in the X-ray emission relative to a circular model on ROSAT data (see their Table 7).
In order to detect possible substructures in A2219 we perform a wavelet analysis by running the task CIAO/Wavdetect on the chip S3. The task was run on different scales in order to search for substructures with different sizes. The significance threshold444see § 11.2 of the CIAO Detect Manual (software release version 2.2.1, available at the WWW site http://cxc.harvard.edu/ciao/manuals.html) was set at . The results are shown in Fig. 10. Thick ellipses represent four significant substructures found by Wavdetect. The principal one, located at R.A. and Decl. , is centered on the cD galaxy. There are two more significant peaks in the core of the cluster located at R.A. and Decl. , and at R.A. and Decl. , respectively. Finally, outside the core, we find a fourth structure at R.A. and Decl. , about 2 South–East of the dominant galaxy. The presence of a photon excess in this position is also evident from Fig. 11, where we plot the residual map of the elliptical Beta model fit. A peak of positive residuals is observed at the position of the fourth structure.
Passing to the spectral analysis of the cluster X–ray photons, we first compute a global estimate of the ICM temperature. The temperature is computed from the spectrum of the cluster within a circular aperture of 3 radius around the cluster center. Fixing the absorbing galactic hydrogen column density at 1.751020 cm-2, computed from the HI maps by Dickey & Lockman (dic90 (1990)), we fit a Raymond–Smith (ray77 (1977)) spectrum using the CIAO package Sherpa with a statistics. We find a best fitting temperature of 10.3 keV, in agreement with previous estimates by Allen (all00 (2000)) and White (whi00 (2000)).
To detect the possible presence of temperature gradients in the cluster we divide the cluster in eight sectors, as shown in Fig. 12, and compute the temperature in each of them. We find a temperature gradient from the cooler SE sectors to the hotter NW ones. This pattern is also confirmed by a softness ratio analysis of the Chandra image. We define the softness ratio as , where is the number count of photons with soft energies in the range 0.5–2 keV, while is the number count of photons with hard energies in the range 2–7 keV. Then we count soft and hard photons in circles with 50 pixels aperture radius sliding on a 200200 pixels grid. Background photon counts are subtracted by using an ACIS background event file by M. Markevitch. The background subtracted values of the softness ratios are plotted in Fig. 13. In this figure different grey levels identify regions with different s. High (lower temperature) regions are concentrated mainly in sectors 1, 2, 3 and 4, in agreement with the temperature map shown in Fig. 12.
5 Active galaxies
The star formation properties of the galaxies in our sample are examined on the basis of the spectral classification introduced in Sect. 2 (see Table 1). Out of 60 classified galaxies, 46 are member galaxies: 29/37 –galaxies, 6/9 –galaxies, 1/4 –galaxy, and 10/10 –galaxies. The relative fraction of cluster –galaxies is . For different EW(H) levels we find and ( and Å, respectively). For comparison, Poggianti et al. (pog99 (1999)) found a of k+a/a+k galaxies with EW(H) Å and Balogh et al. (bal99 (1999)) found a fraction a of with EW(H)5 Å. An open question is whether or not strong H galaxies are typical of cluster environments (cf., e.g., Poggianti et al. pog99 (1999) with Balogh et al. bal99 (1999)) since these galaxies could be produced by a cluster merger (Bekki bek99 (1999)). Very interestingly, we find 0/14 –galaxies in the field against 10/46 in cluster environment.


We check for possible spectral segregations of cluster galaxies, both in position and in velocity space by comparing the dynamics of passive –galaxies with that of active – plus –galaxies. We find a larger velocity dispersion in the case of active galaxies, but the difference is not significant. Moreover, we verify that the two subsamples do not differ in the distribution of galaxy positions by using the 2DKS–test. Fig. 14 shows the distribution of spectroscopically–classified galaxies: 4/25 and 7/21 are classified as active in the central and external cluster regions (within and outside 2). As for central active galaxies, three are located in the NW filament of high velocity galaxies in the central region, corresponding to the NW subclump identified in the two–dimensional analysis of Sect. 3.3. The fourth galaxy (no. 81) lies at the SE of the cD galaxy.
As for the interpretation of spectra, the only detected –galaxy is very blue (the bluest within this sample) as generally found for starburst models. Nine of ten –galaxies are classified as blue according to our definition (see Fig. 7). Thus their spectra can be explained by “post–starburst” models which reproduce strong H EW and no significant emission lines in a quiescent phase soon after a starburst (about between a few Myr and 1.5 Gyr; e.g., Poggianti et al. pog99 (1999)). Alternatively, strong H EW could be obtained during a period of Gyr which follows the halting of the star formation after a 1 Gyr period of constant star formation (Morris et al. mor98 (1998)).

Galaxy no. 81 shows the strongest H EW, and it is therefore spectroscopically classified as ’a’. However, it also shows evidence of mild [OII] emission, EW Å. It would have been classified ’e(a)’ in the scheme of Poggianti et al. (pog99 (1999)). The galaxy coincides with one of the X–ray peaks, identified at the smallest wavelet scale. The X–ray emission could therefore be point–like, and consistent with emission from an AGN. The lack of strong emission lines could be explained if there is substantial dust obscuration. This interpretation is consistent with the fact that e(a) galaxies are generally associated with dusty star–forming galaxies (Poggianti et al. pog99 (1999)). The AGN emission should then be re–emitted in the infrared (IR). Although galaxy no. 81 was not detected at 15 m with ISOCAM by Barvainis et al. (bar99 (1999)), one can see in Fig. 4 of Barvainis et al. (bar99 (1999)) low–level isocontours of mid–IR emission centered on this galaxy. Given that their rms noise level is mJy, and their faintest detected source has a 15 m flux density of 0.53 mJy, the 15 m flux density of galaxy 81 should be –0.5 mJy.
Of the 5 mid–IR sources detected by Barvainis et al. (bar99 (1999)) in the field of A2219, three are in our spectroscopic sample. These are the galaxies no. 42, 45 and 72 (respectively no. 1, 2, and 3 in Barvainis et al.’s Table 1). Only galaxy no. 42 is a cluster member. The other two are foreground galaxies. Galaxy no. 42 is an a–type galaxy, with an H EW Å. Its spectrum shows evidence of a mild [OII] emission, EW Å. It would have been classified ’e(a)’ in the scheme of Poggianti et al. (pog99 (1999)). The flux in the [OII] line can be used to compute the star formation rate of the galaxy, using the relation of Kennicutt (ken98 (1998)). We find SFR yr-1.
We have examined the optical–mid–IR spectral energy distribution (SED) of galaxy no. 42, by comparing the observed data (taken from Barvainis et al. bar99 (1999)) with the GRASIL models of Silva et al. (sil98 (1998)). The GRASIL model takes into account the effects of several kinds of dust particles on the reprocessing and obscuration of the stellar radiation (see: http://web.pd.astro.it/granato/grasil/grasil.html). We find that the observed SED of galaxy no. 42 is best–fitted by a model of a young (3 Gyr–old) early–type spiral, with significant ongoing star formation (see Fig. 15). The best–fit model SED is used to compute the galaxy total IR luminosity, . The galaxy star formation rate, SFR, is derived from the total IR luminosity using the relation of Kennicutt (ken98 (1998)). We obtain SFR yr-1. This value is about 4 times higher than the estimate we obtain from the [OII] line flux. This is expected because of significant dust extinction at short wavelengths. As a matter of fact, from the best–fit model SED we estimate that dust extinction reduces the flux in the [OII] line by a factor .
We conclude that galaxy no. 42 is a dusty star–forming galaxy, rather than a post–starburst galaxy. We thus find that both e(a) galaxies of our sample are dusty, active galaxies, a finding that supports the interpretation given by Poggianti et al. (pog99 (1999)) for these kind of galaxies.

With our spectral classification of a subset of A2219 galaxies, we can try to shed light on the nature of the ’blue’ galaxies which are responsible for the Butcher–Oemler (BO, hereafter) effect (Butcher & Oemler but78 (1978)). We have translated the original Butcher & Oemler’s definition of ’blue’ galaxies to the cluster redshift and the B and R filters, by using the tables of Fukugita et al. (fuk95 (1995)), and taking into account the Galactic absorption in the direction of A2219 (as given in the NASA Extragalactic Database). The dotted lines in Fig. 7 delimit the region of the colour–magnitude diagram where the BO galaxies are located. One can see that the BO population is of a mixed nature. First, there is a substantial amount of field galaxies, of all spectroscopic types. Among BO cluster members, the dominant population is that of a–type galaxies. As we have shown, two of these a–type galaxies are in fact dusty active galaxies, rather than pure post–starburst objects. We thus conclude that the BO population of blue galaxies in the cluster A2219 is mostly composed of galaxies having experienced a recent starburst. In some of these galaxies the star–forming activity is not over yet, although partly hidden by dust.
As for radio galaxies in the cluster, Bacchi et al. (bac03 (2003)) confirm the presence of three radio galaxies at the cluster center of A2219 (see Owen et al. owe92 (1992)) identified in our catalogue with no. 51, 77, 85 (i.e. S3, S4, and S6 respectively in Fig. 9 by Bacchi et al. bac03 (2003)). The northernmost galaxy no. 77, which lies in the low–velocity tail of the cluster velocity distribution ( km s-1), shows a tailed structure pointing towards NW direction, with a sharp bend towards the NE (see Owen & Ledlow owe97 (1997)). The galaxy no. 85 is the second brightest galaxy of the cluster ( 17 R mag) and lies at SE separation from the cD galaxy.
6 Discussion and conclusion
We analyze the internal dynamics of A2219 on the basis of spectroscopic data for 132 galaxies in a cluster region of ( Mpc at the cluster distance) centered on the cD galaxy. Out of 132 spectra, 27 galaxies come from new observations carried out at the TNG. We find that A2219 appears as a peak in the velocity space at , and select 113 cluster members. The investigation of the dynamical status is also performed by using X–ray data stored in the Chandra archive. Further valuable information comes from other bands – optical photometric, infrared, and radio data – which are analyzed and/or discussed, too.
The value we obtain for the line–of–sight velocity dispersion km sis in the high–tail of the distribution of cluster velocity dispersions (see Fadda et al. fad96 (1996); Mazure et al. maz96 (1996); Girardi & Mezzetti gir01 (2001)). This global value of is consistent with the average value of keV coming from the X–ray analysis (=1.10, see also Fig. 4) and with the value of erg s-1 (Ebeling et al. ebe96 (1996)), converted in erg s-1 (see – relation by, e.g., Wu et al. wu99 (1999), and Girardi & Mezzetti gir01 (2001)).
Therefore, on the basis of global properties only, we would conclude that A2219 is not far from the dynamical equilibrium and would trust the large virial mass estimate Mpc . However, the high values of , , and could be due to the expected increase during a cluster–merging phase (e.g., Schindler & Böhringer sb93 (1993); Schindler & Müller sm93 (1993)). Their agreement could be a mere coincidence, and our virial mass estimate an overestimate of the true value.
We find observational evidence that the cluster is not dynamically relaxed. Our optical and X–ray analyses show that A2219 is elongated in the SE–NW direction. This elongation is seen in: the spatial distribution of the colour–selected likely cluster members; the shape of the cD galaxy; the X–ray contour levels of the Chandra image; the gradient in the velocity dispersion and in the X–ray temperature. In particular the ellipticity of X–ray isophotes is significantly higher than 0 and corresponds to an axis-ratio=0.66, which is much lower than the usual value for galaxy clusters (median axis-ratio with 99% c.l. errors= from Mohr et al. moh95 (1995)). Note that Dahle et al. (dah02 (2002)) found that the mass distribution of this cluster recovered from a weak lensing analysis appears even more elongated than the light and galaxy number density distribution.
Very interestingly, the optical data show a somewhat smaller PA than X–ray data ( and , respectively). A different direction in the elongation of light and hot gas distribution could be the result of a cluster merger in an advanced phase as shown by numerical simulations where collisional and collisionless components react in different way (e.g., Ricker & Sarazin ric01 (2001); Schindler sch02 (2002)). In fact, the evidence of an ongoing merger in the cluster core was first suggested by Smail et al. (sma95 (1995)) to explain the difference they find in the orientation of the mass and gas distributions (PA=115 and 128 degrees), as obtained from gravitational lensing analysis and ROSAT/HRI X–ray data, respectively.
As for the presence of the velocity gradient roughly in the E–W direction, this suggests that the structures are moving into the plane of the sky at (e.g., Quintana et al. qui96 (1996); Roettiger & Flores roe00 (2000)). In fact, intermediate angles are the most suitable to allow detection of the cluster elongation and contemporary the velocity gradient during a merging phase.
The hypothesis of an advanced–phase merging is also supported by the lack of a cool center in the cluster (see also Allen & Fabian all98 (1998)), as expected since strong cluster mergers disrupt the cool cores (Peres et al. per98 (1998); Roettiger et al. roe96 (1996)), and the existence in the core of several star–forming or post–starburst galaxies, whose activity could be produced by the cluster merger (e.g., Bekki bek99 (1999)). In particular, three of these active galaxies are part of the filament at NW of the cD, also visible as a cool component in the X–ray softness ratio map (see Fig. 8 and Fig. 13), suggesting that this structure might be already involved in a merger event. Moreover, the shape of the radio tail of the radio galaxy no. 77 indicates that the velocity of this galaxy was originally pointing towards the cluster center (cD galaxy), but has rather suddenly changed the motion direction, probably because of the cluster merger.
The structure we find in the cluster core could be related to the cluster merger, too. Considering optical data, the Dressler–Schectman test shows the possible existence of a substructure located at SE, very close to the cD galaxy. As for X–ray data, our wavelet multi–scale analysis puts in evidence three significant emission peaks located within 1 from the cluster center. Of these, two peaks are possibly connected to intrinsic X–ray emission from the cD and the active galaxy no. 81, but no optical counterpart is found for the third, intermediate peak. Our wavelet X–ray analysis also detects an external diffuse substructure located 2 SE of the cD galaxy. We suggest that this structure is a premerging clump. In fact, it coincides with the cold SE X–ray region and thus could be well explained by the two–dimensional superposition of a cold clump in the foreground of the main cluster. The presence of this foreground clump could also explain why, on average, the velocity at the East is lower than in the West since at least for some galaxies the low velocity is of cosmological rather than of kinematic origin. These anomalous low velocity galaxies could also produce a spurious enhancement of the observed velocity dispersion in the SE region (see Table 2). A population of very close foreground galaxies could also explain why very red galaxies strangely differ from not–very red galaxies both in kinematic and spatial properties (see Sect. 3.3). In fact, while the former are really associated with the main structure of A2219, the latter could be mixed with the clump members, i.e. a population of foreground – and thus less red – galaxies. Unfortunately, we have very poor redshift information in the SE region to confirm our hypothesis and identify clump members.
On a much larger scale, the cluster is not so well isolated in the redshift space, and a next possible merging clump might be the one at (see Fig. 2).
Summarizing the above evidence, we suggest a complex merging scenario for A2219 involving many clumps, possibly in different dynamical states. We suggest that the main, original structure (hosting the cD galaxy) is subject to an ongoing merger with few clumps aligned in a foreground filament obliquely oriented with respect to the line–of–sight; the filament projected on the sky lies in the SE–NW direction. In this scenario, the merging with one or more clumps are already in a very advanced phase, well after the first core passage, while one or more clumps are still in a pre–merging phase.
In the context of the above scenario, we argue that the presence of a radio–halo in A2219 is related to the existence of an ongoing, very advanced phase of merging between the main cluster and one or more groups. In fact, the elongation of radio map contours (see Fig. 10) has the same direction of the X–ray surface brightness contours. Moreover, the time necessary to re–accelerate the electrons producing the radio–halo as a consequence of the cluster merger (1 Gyr) is comparable to that needed to obtain post–starburst spectral signatures in galaxies of which A2219 is rich (see Sect. 5).
In conclusion, our scenario supports the view of the connection between extended radio emission and merging phenomena in galaxy clusters.
Acknowledgements.
We thank Luca di Fabrizio for B and R calibration observations at the TNG telescope and the anonymous referee for useful suggestions and comments. We particularly thank Ian Smail for providing us accurate Palomar 5–m telescope photometry. Work partially supported by the Italian Ministry of Education, University, and Research (MIUR, grant COFIN2001028932 ”Clusters and groups of galaxies, the interplay of dark and baryonic matter”), by the Italian Space Agency (ASI), and by INAF (Istituto Nazionale di Astrofisica) through grant D4/03/IS. This publication makes use of data accessed as Guest User at the Canadian Astronomy Data Center, which is operated by the Dominion Astrophysical Observatory for the National Research Council of Canada’s Herzberg Institute of Astrophysics (http://cadcwww.dao.nrc.ca/cfht/cfht.html), as well as of data obtained from the Chandra data archive at the NASA Chandra X–ray center (http://asc.harvard.edu/cda/).References
- (1) Abell, G.O., Corwin, H.G. Jr., & Olowin, R.P. 1989, ApJS, 70, 1
- (2) Allen, S.W., Edge, A.C., Fabian, A.C., et al. 1992, MNRAS, 259, 67
- (3) Allen, S.W., & Fabian, A.C. 1998, MNRAS, 297, L57
- (4) Allen, S.W. 2000, MNRAS, 315, 269
- (5) Bacchi, M., Feretti, L., Giovannini, G., & Govoni, F. 2003, A&A, 400, 465
- (6) Balogh, M.L., Morris, S.L., Yee, H.K.C., Carlberg, R.G., & Ellingson, E. 1999, ApJ, 527, 54
- (7) Bardelli, S., Zucca, E., Vettolani, G., et al. 1994, MNRAS, 267, 665
- (8) Barrena, R., Biviano, A., Ramella, M., Falco, E.E., & Seitz, S. 2002, A&A, 386, 816
- (9) Barvainis, R., Antonucci, R., & Helou, G. 1999, AJ, 118, 645
- (10) Beers, T.C., Flynn, K., & Gebhardt, K. 1990, AJ, 100, 32
- (11) Beers, T.C., Forman, W., Huchra, J.P., Jones, C., & Gebhardt, K. 1991, AJ, 102, 1581
- (12) Bekki, K. 1999, ApJ, 510, L15
- (13) Bertin, E., & Arnouts, S. 1996, A&AS, 117, 393
- (14) Böhringer, H., & Schuecker, P. 2002, in “Merging Processes in Galaxy Clusters”, eds. L. Feretti, I.M. Gioia, & G. Giovannini, Kluwer Ac. Pub., The Netherlands, in press: Observational signatures and statistics of galaxy cluster mergers
- (15) Buote, D.A. 2002, in “Merging Processes in Galaxy Clusters”, eds. L. Feretti, I.M. Gioia, & G. Giovannini, Kluwer Ac. Pub., The Netherlands, in press: Optical Analysis of Cluster Mergers
- (16) Butcher, H., & Oemler, A., Jr. 1978, ApJ, 219, 18
- (17) Carlberg, R.G., Yee, H.K.C., Ellingson, E., et al. 1997, ApJ, 476, L7
- (18) Colless, M., & Dunn, A.M. 1996, ApJ, 458, 435
- (19) Couch, W.J., Ellis, R.S., Sharples, R.M., & Smail, I. 1994, ApJ, 430, 121
- (20) Dahle, H., Kaiser, N. Irgens, R.J., Lilje, P.B., & Maddox, S. J. 2002, ApJS, 139, 313
- (21) Danese, L., De Zotti, C., & di Tullio, G. 1980, A&A, 82, 322
- (22) den Hartog, R., & Katgert, P. 1996, MNRAS, 279, 349
- (23) Dickey, J.M., & Lockman, F.J. 1990, ARA&A, 28, 215
- (24) Dressler, A., & Shectman, S.A. 1988, AJ, 95, 985
- (25) Dressler, A., Smail, I., Poggianti, B.M., et al. 1999, ApJS, 122, 51
- (26) Ebeling, H., Voges, W., Böhringer, H., et al. 1996, MNRAS, 281, 799
- (27) Ellingson, E., & Yee, H.K.C. 1994, ApJS, 92, 33
- (28) Ensslin, T.A. 2000, in “Cluster Mergers and their Connection to Radio Sources”, 24th meeting of the IAU, Joint Discussion 10, August 2000, Manchester, England.
- (29) Ensslin, T.A., & Röttgering, H. 2002, A&A, 396, 83
- (30) Evrard, A.E. & Gioia, I.M. 2002, in “Merging Processes in Galaxy Clusters”, eds. L. Feretti, I.M. Gioia, & G. Giovannini, Kluwer Ac. Pub., The Netherlands: Clusters, Cosmology and Mergers
- (31) Fadda, D., Girardi, M., Giuricin, G., Mardirossian, F., & Mezzetti, M. 1996, ApJ, 473, 670
- (32) Fasano, G., & Franceschini, A. 1987, MNRAS, 225, 155
- (33) Feretti, L., & Giovannini, G. 1996, “Extragalactic radio sources”, proceedings of the 175th Symposium of the International Astronomical Union, held in Bologna, Italy, 10-14 October 1995. Edited by Ron D. Ekers, C. Fanti, and L. Padrielli. Published by Kluwer Academic Publishers, p. 333.
- (34) Feretti, L. 1999, MPE Report No. 271
- (35) Feretti, L. 2002, “The Universe at Low Radio Frequencies”, Proceedings of IAU Symposium 199, held 30 Nov - 4 Dec 1999, Pune, India. Edited by A. Pramesh Rao, G. Swarup, and Gopal-Krishna, 2002., p.133
- (36) Fukugita, M., Shimasaku, K., & Ichikawa, T. 1995, PASP, 107, 945
- (37) Gebhardt, K., & Beers, T.C. 1991, ApJ, 383, 72
- (38) Giovannini, G., Tordi, M., & Feretti, L. 1999, New Astronomy, 4, 141
- (39) Giovannini, G., & Feretti, L. 2002, in “Merging Processes in Galaxy Clusters”, eds. L. Feretti, I.M. Gioia, & G. Giovannini, Kluwer Ac. Pub., The Netherlands: Diffuse Radio Sources and Cluster Mergers
- (40) Girardi, M., Fadda, D., Giuricin, G. et al. 1996, ApJ, 457, 61
- (41) Girardi, M., Giuricin, G., Mardirossian, F., Mezzetti, M., & Boschin, W. 1998, ApJ, 505, 74
- (42) Girardi, M., & Mezzetti, M. 2001, ApJ, 548, 79
- (43) Girardi, M., & Biviano, A. 2002, in “Merging Processes in Galaxy Clusters”, eds. L. Feretti, I.M. Gioia, & G. Giovannini, Kluwer Ac. Pub., The Netherlands: Optical Analysis of Cluster Mergers
- (44) Gómez, P.L., Hughes, J.P., & Birkinshaw, M. 2000, ApJ, 540, 726
- (45) Govoni, F., Feretti, L.; Giovannini, G., et al. 2001, A&A, 376, 803
- (46) Hammer, F., Flores, H., Lilly, S.J., et al. 1997, ApJ, 481, 49
- (47) Kennicutt, R.C. 1992, ApJS, 79, 225
- (48) Kennicutt, R.C. 1998, ARA&A, 36, 189K
- (49) Malamuth, E.M., Kriss, G.A., Dixon, W. Van Dyke, Ferguson, H.C., & Ritchie, C. 1992, AJ, 104, 495
- (50) Mazure, A., Katgert, P., den Hartog, P., et al. 1996, A&A, 310, 31
- (51) Mercurio, A., Girardi, M., Boschin, W., Merluzzi, P., & Busarello, G. 2003, A&A, 397, 431
- (52) Mohr, J.J., Evrard, A.E., Fabricant, D.G., & Geller, M.J. 1995, ApJ, 447, 7
- (53) Morris, S.L., Hutchings, J.B., Carlberg, R.G., et al. 1998, ApJ, 507, 84
- (54) Owen, F.N., White, R.A., & Burns, J.O. 1992, ApJS, 80, 501
- (55) Owen, F.N., & Ledlow, M.J. 1997, ApJS, 108, 41O
- (56) Peres, C.B., Fabian, A.C., Edge, A.C., et al. 1998, MNRAS, 298, 416
- (57) Pisani, A. 1993, MNRAS, 265, 706
- (58) Pisani, A. 1996, MNRAS, 278, 697
- (59) Poggianti, B.M., Smail, I., Dressler, A., et al. 1999, ApJ, 518, 576
- (60) Postman, M., Lubin, L.M., & Oke, J.B. 1998, AJ, 116, 560
- (61) Press, W.H., Teukolsky, S.A., Vetterling, W.T., & Flannery, B.P. 1992, in “Numerical Recipes” (Second Edition), (Cambridge University Press)
- (62) Quintana, H., Carrasco, E.R., & Reisenegger, A. 2000 AJ, 120, 511
- (63) Quintana, H., Ramirez, A., & Way, M.J. 1996, AJ, 112, 36
- (64) Raymond, J.C., & Smith, B.W. 1977, ApJS, 35, 419
- (65) Ricker, P.M., & Sarazin, C.L. 2001, ApJ, 561, 621
- (66) Rizza, E., Burns, J.O., Ledlow, M.J., et al. 1998, MNRAS, 301, 328
- (67) Roettiger, K., Burns, J.O., & Loken, C. 1996, ApJ, 473, 651
- (68) Roettiger, K., Loken, C., & Burns, J.O. 1997, ApJS, 109, 307
- (69) Roettiger, K., & Flores, R. 2000, ApJ, 538, 92
- (70) Sarazin, C.L. 2002, in “Merging Processes in Galaxy Clusters”, eds. L. Feretti, I.M. Gioia, & G. Giovannini, Kluwer Ac. Pub., The Netherlands: The Physics of Cluster Mergers
- (71) Schindler, S., & Böhringer, H. 1993, A&A, 269, 83
- (72) Schindler, S., & Müller, E. 1993, A&A, 272, 137
- (73) Schindler, S. 2002, in “Merging Processes in Galaxy Clusters”, eds. L. Feretti, I.M. Gioia, & G. Giovannini, Kluwer Ac. Pub., The Netherlands: Mergers of Galaxy Clusters in Numerical Simulations
- (74) Schuecker, P., Böhringer, H., Reiprich, T.H., & Feretti, L. 2001, A&A, 378, 408
- (75) Silva, L., Granato, G.L., Bressan, A., & Danese, L. 1998, ApJ, 509, 103
- (76) Smail, I., Hogg, D.W., Blandford, R., et al. 1995, MNRAS, 277, 1
- (77) Smail, I., Edge, A.C., Ellis, R.S., & Blandford, R.D. 1998, MNRAS, 293, 124
- (78) Terlevich, A.I., Kuntschner, H., Bower, R.G., Caldwell, N., & Sharples, R.M., MNRAS, 310, 445
- (79) Tonry, J., & Davis, M. 1979, ApJ, 1511
- (80) White, D.A. 2000, MNRAS, 312, 663
- (81) White, S.D.M. 1997, in “The Evolution of the Universe”, report of the Dahlem Workshop on the Evolution of the Universe, Berlin, September 10-15, 1995. Edited by G. Borner and S. Gottlober. New York : J. Wiley, 1997., p.227
- (82) Wu, X.–P., Xue, Y.–J., & Fang, L.–Z. 1999, ApJ, 524, 22