The Recent Cluster Formation Histories of NGC 5253 and NGC 3077: Environmental Impact on Star Formation 11affiliation: Based on observations obtained with the NASA/ESA Hubble Space Telescope at the Space Telescope Science Institute, which is operated by the Association of Universities for Research in Astronomy, Inc., under NASA contract NAS5-26555.
Abstract
We present multicolor photometry of bright star cluster candidates in the nearby starburst galaxies NGC 3077 and NGC 5253, observed with the Hubble Space Telescope Wide Field and Planetary Camera 2 in both broadband (F300W, F547M and F814W) and narrowband (F487N and F656N) filters. By comparing the photometry with theoretical population synthesis models, we estimate the age and mass of each star cluster, which provides constraints on the recent star formation histories of the host galaxies. We compare the star cluster populations in these dwarf starburst galaxies to those of the nuclear starburst in the barred spiral M 83, and discuss implications for our understanding of the nature and evolution of starburst events.
1 Introduction
Throughout the Universe’s history, a significant fraction of star formation has apparently occurred in high-intensity bursts. These rapid star-formation events play important roles in the ionization, chemical enrichment, and overall evolution of their host galaxy. Such starburst events are often seen in interacting galaxies, and it seems reasonable to infer a causal connection between galaxy interactions and starburst activity. However, interactions are probably not the only causal agent for starburst activity; internal dynamics can also play an important role (e.g., M 83). Combined with the dynamic merger histories predicted by the standard hierarchical collapse model of galaxy formation, it is likely that much of a typical galaxy’s stellar content was formed during starburst events. Despite this ubiquity, we currently have only a rudimentary understanding of the cause, nature and evolution of starburst events, and in particular, of the physical processes which connect the external environment to the internal star formation rate.
Nearby starburst galaxies provide important laboratories for investigating the processes involved in galactic-scale star-formation events in detail. Local starburst galaxies appear to be similar to the active galaxies seen at high-redshift () in UV colors (Meurer et al., 1997, 1999; Adelberger & Steidel, 2000) and spectral morphology (Steidel et al., 1996; Lowenthal et al., 1997; Pettini et al., 2000), although the high-redshift systems typically have star-formation rates that are several times higher than local starbursts. Because of their similarity, we can reasonably expect that detailed photometric and spectroscopic studies of local starbursts will lead to a general understanding of the starburst phenomenon at all redshifts. In particular, we wish to address the following questions regarding the physical processes governing the starburst phenomenon: (1) Are starburst properties determined by the global properties of the host galaxies? (2) How long do starbursts last? (3) What are the mechanisms that cause and sustain starbursts? (4) Does star-formation activity propagate across galaxies? If so, what is the propagation mechanism? (5) On what timescale do star clusters dissolve in starbursts? (6) Is the field stellar population composed primarily of evaporated cluster stars, or is there a significant population that is native to the diffuse field?
To investigate these questions, we are undertaking a multi-band photometric survey of nearby starburst galaxies using the Hubble Space Telescope (HST) Wide Field and Planetary Camera 2 (WFPC2). The program’s goal is to survey the stellar populations and gas content of nearby starburst galaxies spanning a range of internal properties (mass, metallicity, internal dynamics) and external environments, in order to understand better what role these factors play in determining the nature and evolution of the galaxies’ starbursts. The focus of the present work is to constrain the recent star-cluster formation histories of two nearby dwarf galaxies (NGC 3077 and NGC 5253) which have similar mass () and luminosity (), but large contrasts in metallicity and external environment. Until recently, it was thought that NGC 3077 and NGC 5253 were both interacting satellites of large spiral galaxies. NGC 3077’s membership in the M 81 group is not in doubt, but recent Cepheid distance measurements place NGC 5253 about 600 kpc from its nearest neighbor, M 83 (Karachentsev et al., 2002b; Schmidt et al., 1994), making it unlikely that M 83 has influenced NGC 5253’s recent history.
We also compare their recent star-cluster formation histories to that of the large spiral galaxy M 83 (NGC 5236), which was studied in Paper 1 of this series (Harris et al., 2001). The global properties of NGC 3077, NGC 5253 and M 83 are compared in Table 1.
The paper is organized as follows. We present the observations and data reduction in Section 2. In Section 3, we present the photometric catalogs, the extinction corrections, the star/cluster separation analysis, and our estimates of the star cluster ages and masses, based on both broad-band photometry and the equivalent width of the emission line. We interpret and discuss the results in Section 4 and summarize the work in Section 5.
2 Observations and Data Reduction
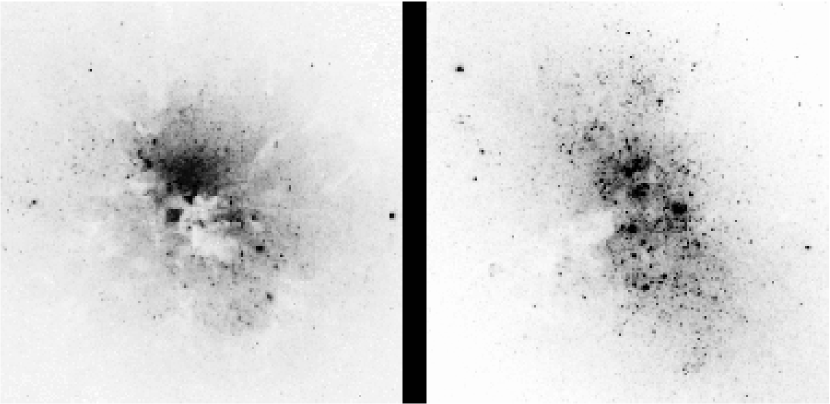
The nearby dwarf starburst galaxies NGC 3077 and NGC 5253 were observed with the HST WFPC2 instrument, in the broad-band filters F300W, F547M, and F814W (see Figure 1), and in the narrow-band filters F656N and F487N on three visits between 1996 and 2001 (see Table 2 for exposure information). Images were also taken in the narrow-band filters F502N and F673N; these data are discussed in a companion paper (Calzetti et al., 2003). In each exposure, the starburst region was centered on the WF3 chip. This provided a field of view wide enough to cover the optical starburst region in each galaxy, at the expense of the poorer angular resolution of the WF chip.
The data were reduced by the STScI calibration pipeline, which includes flagging of bad pixels, A/D conversion, bias and dark current subtraction, and flatfielding. Hot pixels were removed or flagged using the STSDAS routine WARMPIX, which uses hot pixel information from dark frames obtained around the time of the science observations to perform the correction.
In each of the filters, two or three separate exposures were obtained to aid in cosmic ray rejection. Cosmic ray rejection and co-addition were performed using the STSDAS routine CRREJ (Williams et al., 1996), with a rejection threshold of 4 for the cosmic rays and 2.4 for the adjacent pixels. NGC 3077’s CR-split exposures in F547M and F814W have orientations which differ by approximately 0.5°(see Table 2), and there is also a non-integer pixel translation offset between these exposures. These registration offsets degrade the effective PSF of the F547M and F814W images after registering them for CR cleaning. Visual inspection of the radial profiles of star-like objects indicates that the FWHM is typically enlarged by 40–50% in the CR-cleaned images, compared to the original CR-split exposures. While this does not have a large effect on our photometry, our star/cluster determination analysis must be performed on the CR-split images, where the full angular resolution of WFPC2 has not been compromised (see Section 3.2).
The absolute photometric calibration of the images is obtained from the zero-points listed in HST Data Handbook (Mobasher, 2002), and have about 2–5% accuracy in the medium and broad-band filters (Casertano, 1997). The effect of contaminant buildup onto the WFPC2 window is negligible at optical wavelengths, but not for F300W. The F300W images were taken 7 and 13 days after the previous decontamination procedure (for NGC 3077 and NGC 5253, respectively), so we applied contamination flux corrections of 1.6% and 3%. The well-known Charge-Transfer Efficiency (CTE) problem of WFPC2 (Stetson, 1998; Whitmore et al., 1999a; Dolphin, 2002) presents some challenges for our analysis. Most of the analysis of the CTE problem to date has focused on point sources; however, recently Riess (2000) studied the CTE effect on extended objects, and found that the reduction of flux was greatly mitigated compared to point sources. The primary effect on extended sources is to make the profile shape asymmetric in the direction of the readout. Because our objects are slightly resolved, we believe the standard CTE formulae derived for stars may be inappropriate in this case. In addition, our broad-band images have an elevated background level, which reduces the CTE effect, because charge-traps are already filled by the background flux. Even in the narrow-band images, the background is highly variable, and our sources are preferentially found around the image center, which makes the ramp correction less significant. In light of these uncertainties, we simply apply a 2% correction to the total counts in our narrow-band images, approximatel equal to the stellar CTE correction for the center of a WFPC2 chip.
The construction of line-emission and images from the narrow-band F656N and F487N images is discussed in detail in Calzetti et al. (2003). Briefly, we subtract off the underlying stellar continuum emission and remove contaminating [N II] flux from the images. We make an additional correction for underlying stellar absorption in the images (stellar absorption is considered negligible for the images).
3 Photometry and Analysis
In Harris et al. (2001), we presented a method for determining the photometry of star clusters from WFPC2 images of nearby galaxies. Our method involves convolving each image with a small Gaussian kernel (–2 pixels), and determining a best-fit PSF-like cluster profile model for each image. Profile-fitting photometry is preferable to aperture photometry due to the crowded conditions of the frames, and to the highly variable backgrounds. The Gaussian convolution is necessary in order to homogenize the variable cluster profiles to the point that they can be described well by a single model.
In the present cases of NGC 3077 and NGC 5253, we found that the above procedure was insufficient for obtaining accurate cluster photometry. Many of the objects left a circular discontinuity in the model-subtracted residual image, indicating a poor fit by the profile model. Also, the objects showed a wide distribution of apparent aperture corrections, suggesting significant variation among the cluster profiles, despite our convolution with a Gaussian kernel. We attempted to account for this variation by fitting two independent profile models: one optimized for broader clusters, the other for more compact clusters. This improved the residual images significantly, but did not completely solve the variable-profile issues.
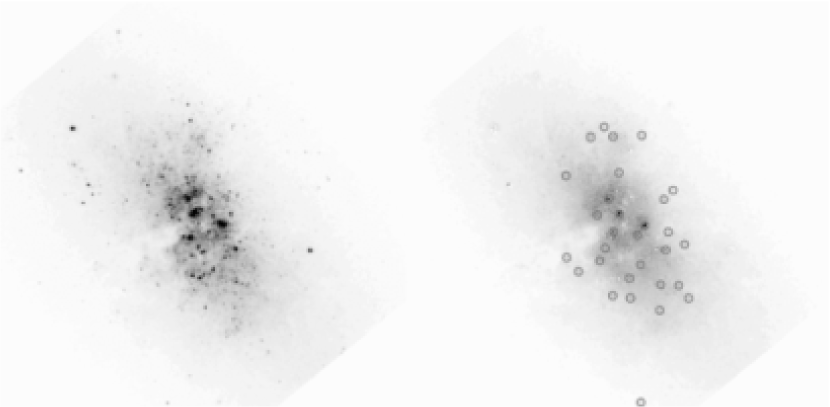
For these reasons, we have modified our cluster photometry method. Since we cannot obtain a cluster profile model that fits all objects well, we revert to aperture photometry, which does not require a uniform cluster profile shape. However, we perform our aperture photometry on “neighbor-cleaned” images to avoid contaminating flux from nearby objects. To construct neighbor-cleaned images, we first divide the list of objects into groups such that there are no pairs of objects with an angular separation less than 20 WF pixels () in any single group. For each group, we then construct an image in which all objects except those in the current group have been fitted with the best (albeit imperfect) profile model and subtracted from the image. The result is a series of images, each of which contains only isolated objects (see Figure 2). We then measure aperture photometry for each object in the neighbor-cleaned image in which the object was left unsubtracted.
We have cleaned the apertures of contaminating flux from neighboring objects, but the problems of variable background levels and non-uniform profile shapes remain, making it impossible to determine proper aperture corrections. In our analysis of M 83, we were able to compute the mean aperture correction for artificial objects added to empty image regions, using the best-fit radial profile model. However, since the clusters in our current galaxies have non-uniform profile shapes (even after our attempt to homogenize them through convolution with a Gaussian kernel), we cannot derive a usable aperture correction from a model profile.
Without aperture corrections, photometry suffers from systematic errors, since some unknown fraction of the object’s total flux falls outside the photometric aperture. The solution to this is to increase the photometric aperture size, thereby reducing the fraction of flux outside the aperture to a negligible level. However, when the background is variable or otherwise poorly-determined, larger apertures add significant random errors to the photometry (which is why average aperture corrections derived from isolated objects are so useful). We attempt a balance between the systematic errors imposed by small apertures and the random errors imposed by large apertures by adopting an intermediate aperture size of 5 pixels, which is approximately twice as large as a typical cluster’s FWHM size.
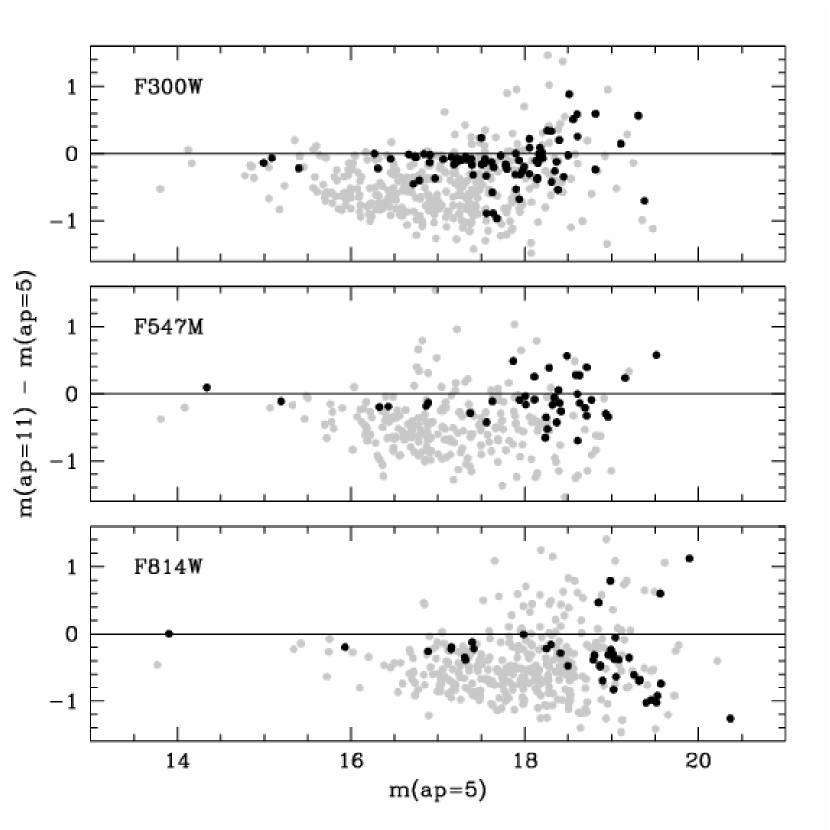
In Figure 3, we show the 5-pixel aperture corrections for all detected objects in the three neighbor-cleaned broad-band images of NGC 3077. The distribution of aperture corrections is very wide, confirming our assertion that variable cluster profile shapes and background levels make applying a standard background correction impossible. However, we highlight objects which are located outside the dense, central regions of NGC 3077; the aperture corrections of these more isolated objects are much more tightly distributed, especially among the brighter objects. The mean aperture correction of the bright, isolated objects is 0.1–0.2 mag in all three filters, but the numbers of such objects are small, making a direct empirical determination difficult. We simply adopt the 0.1 mag 5-pixel aperture correction appropriate for point sources, as a gross approximation of our mean aperture correction. It is likely that there remains a systematic error in the photometry of order 0.1 mag associatied with the fact that the cluster profiles are not point sources.
3.1 Dust Extinction
As in our analysis of M 83, we rely on the ratio of to to estimate the extinction toward the clusters. We construct an ratio image after rebinning the emission-line images using a boxcar kernel to remove small registration errors. We compute a per-bin estimate using the standard formula for dust in starburst galaxies (Calzetti, 1997). We compare the distributions of inferred values in NGC 3077 and NGC 5253 in Figure 4. The average extinction in NGC 3077 is about twice that in NGC 5253. In Figure 5, we present the maps for NGC 3077 and NGC 5253. The maps illustrate the complex distribution of dust in these galaxies. Note that we have imposed a 5 signal-to-noise cut on both and , which biases the maps against extremely high extinction values. NGC 3077, in particular, contains some obviously highly extincted regions near its center that appear as zero-values in the map.
We estimate the extinction toward each cluster by applying the same two-component extinction model that we used for M 83:
| (1) | |||
| (2) | |||
| (3) |
(Calzetti et al., 1994, 2000; Harris et al., 2001). is the foreground Galactic extinction estimate, equal to 0.07 mag for NGC 3077 and 0.06 mag for NGC 5253 (Schlegel et al., 1998).
3.2 Star/Cluster Separation
The biggest challenge in this analysis is in determining whether a given source is a star cluster, or an individual star. We can easily make a luminosity cut at mag (where is the extinction-corrected absolute magnitude in ), since individual stars are not expected to be more luminous than this (Whitmore et al., 1999b). However, this cut alone will not remove contamination by foreground Galactic stars, and it will also remove real clusters, which may well be fainter than this luminosity.
We therefore must rely on the high angular resolution provided by WFPC2 to provide shape information of the sources. The WF PSF has a FWHM of about 0.13 arcsec, which corresponds to pc at the characteristic distance of these galaxies (3.3–3.8 Mpc). This is slightly smaller than the typical scale radius for young star clusters, so star clusters should be very slightly resolved in our images.
Since the clusters are only slightly larger than the instrumental PSF, we cannot use the Gaussian-convolved images which were used for determining the photometry; the star/cluster separation must be an independent analysis performed on the original, unblurred images. We attempted a variety of methods to determine whether a given source was resolved or not, but eventually settled on a simple measurement of the objects’ FWHM using the IRAF RADPROF tool, coupled with a visual examination of the objects’ profiles using IRAF’s IMEXAMINE tool.
We note that in the case of NGC 3077, we could not use the cosmic-ray (CR) cleaned images for this analysis, because position-angle offsets among the CR-split images degrade the PSFs (see Table 2 and Section 2 for details). We instead performed FWHM measurements for NGC 3077 on the individual CR-split exposures. In order to remove CR hits from our FWHM detection lists, we reject detections which are not present in each of the CR-split frames. This provided us with two (or three) independent FWHM measurements for the real objects in each image. We adopted the mean FWHM value for each object, unless it was determined that one of the values was affected by a coincident cosmic ray.
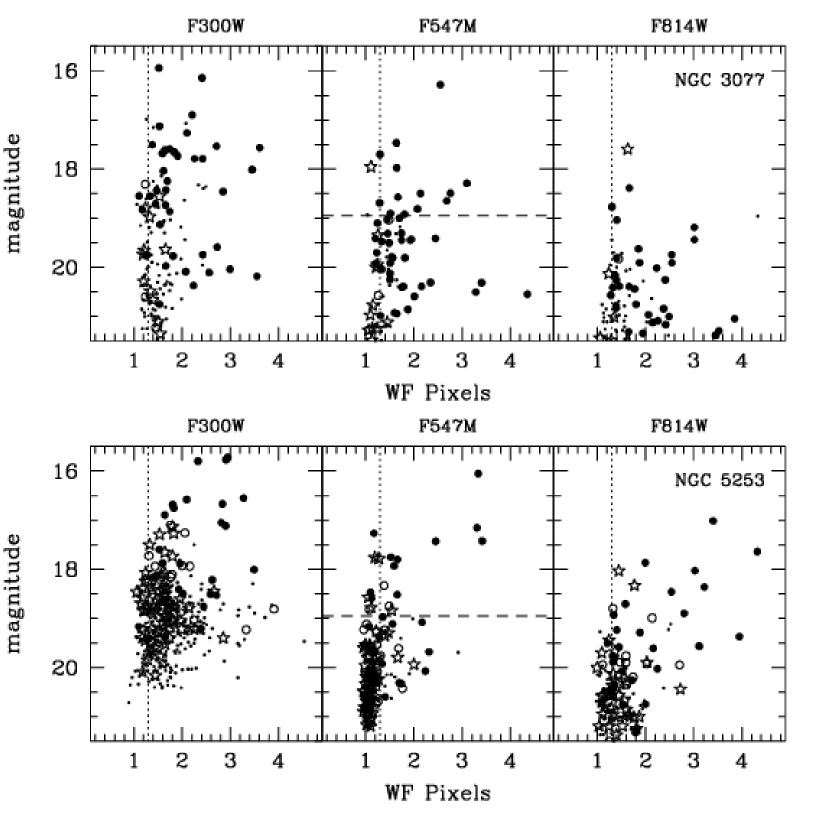
In Figure 6 we present the FWHM measurements in each band, as a function of extinction-corrected magnitude. The magnitude corresponding to mag is indicated; everything brighter than this is either a star cluster or a foreground Galactic star. Note that objects brighter than the mag cutoff are generally resolved, confirming that they are clusters. Note also that NGC 3077 and NGC 5253 each contain only a handful of objects brighter than mag; a marked contrast to M 83, in which we found 33 objects brighter than this limit.
Upon inspecting the cluster profile shapes using the IRAF IMEXAMINE tool, we found that the FWHM values sometimes failed to reflect the true cluster profile shape. For example, an object with a FWHM indicating a PSF-like profile might have a radial profile that is clearly larger than a stellar profile. We therefore base our final star/cluster classification on a manual comparison of the radial profile of each cluster candidate to that of a known star in the same image, using the measured FWHM values as a supplement and guide. Those objects whose profiles were unambiguously resolved in our visual inspection are flagged as clusters (indicated by solid circles in Figure 6); we find 55 and 33 clusters in NGC 3077 and NGC 5253, respectively (see Figures 7 and 8). Objects whose profiles are indistinguishable from the stellar profiles are flagged as stars (indicated with star symbols in Figure 6), and marginally-resolved or questionable objects are flagged as ambiguous (indicated by open circles in Figure 6). We did not attempt a detailed star/cluster classification for objects which were detected in only one of the three broad-band images; these partially-detected objects are represented as small points in Figure 6.
3.3 Determining Ages and Masses of the Star Clusters
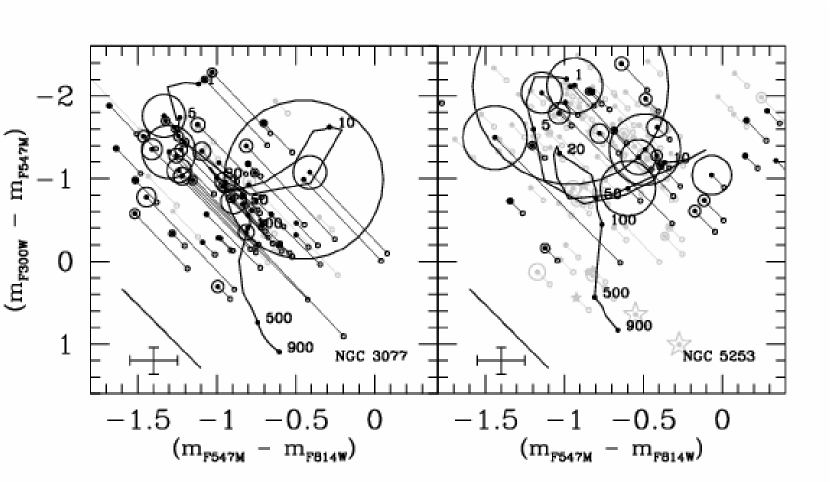
In Figure 9, we present the two-color diagrams for all objects in NGC 3077 and NGC 5253 which were detected in all three broad-band filters (65 objects in NGC 3077, and 117 in NGC 5253). The Figure shows both the observed and extinction-corrected photometry of each object, connected by a straight line. The objects which we determined to be resolved clusters are highlighted.
We employ the Starburst99 population synthesis models (Leitherer et al., 1999) to estimate the age and mass of each cluster. We select instantaneous-burst Starburst99 models with an appropriate metallicity: Z=0.02 and Z=0.008 for NGC 3077 and NGC 5253 , respectively (Calzetti et al., 2003; Martin, 1997). The models provide full spectral-energy distributions (SEDs); to obtain model HST photometry, we multiply the SED of each model point by the appropriate HST filter bandpass functions. The model tracks are shown as the looping curve in each panel of Figure 9. Age increases along the model track from the upper left (bluer colors) to the lower right (redder colors). The objects which we determined to be clusters follow the Starburst99 model track reasonably well. Note that both NGC 3077 and NGC 5253 contain bright clusters whose photometry places them on the –20 Myr “red loop” portion of the model track, which is dominated by red supergiant stars. The colors of these clusters have a large degree of intrinsic uncertainty, due to Poisson noise in the number of luminous red supergiants present in each cluster, and to uncertainties in the evolutionary tracks themselves (Starburst99 models are based on evolutionary tracks from the Geneva group; see Leitherer et al., 1999, for references).
The age estimate for each cluster is derived by matching the extinction-corrected photometry of each cluster to the point along the Starburst99 model with the most similar colors. The effective “search area” for each cluster traces an ellipse in the two-color diagram, extended along the reddening line, whose shape is determined by the extent of the photometric and reddening errors. This “search area” technique allows us to identify a plausible range of ages for each cluster, in addition to the best-fit age.
Once we have estimated the age of a cluster, we then estimate its mass by assuming that the flux ratio of each cluster to its best-matched model point is equal to their mass ratio. Each model point represents a stellar population with a mass of M⊙, but this assumes a Salpeter IMF over a limited mass range (). We apply a correction factor of 1.91 to obtain model cluster masses for the full range of stellar masses (), using the cluster IMF presented by Kroupa (2001). We obtain the plausible range of masses for each cluster by examining the flux ratio of the observed cluster to the model points at each end of the plausible age range. The extinction-corrected photometry and age and mass estimates for each cluster candidate in NGC 3077 and NGC 5253 are presented in Tables 3 and 4, respectively.
3.4 Age Constraints from
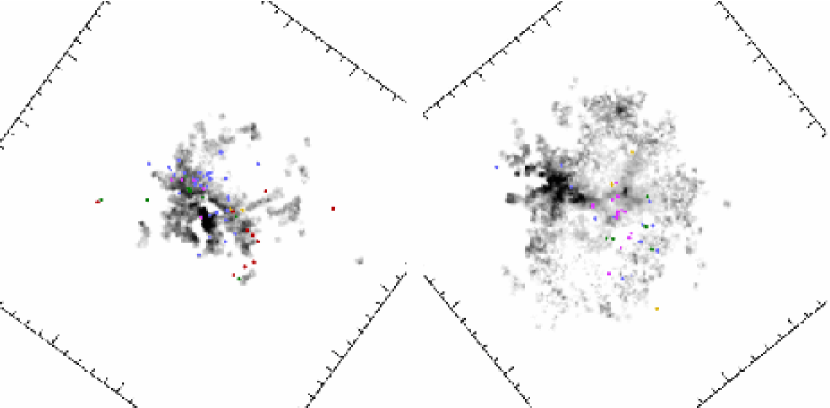
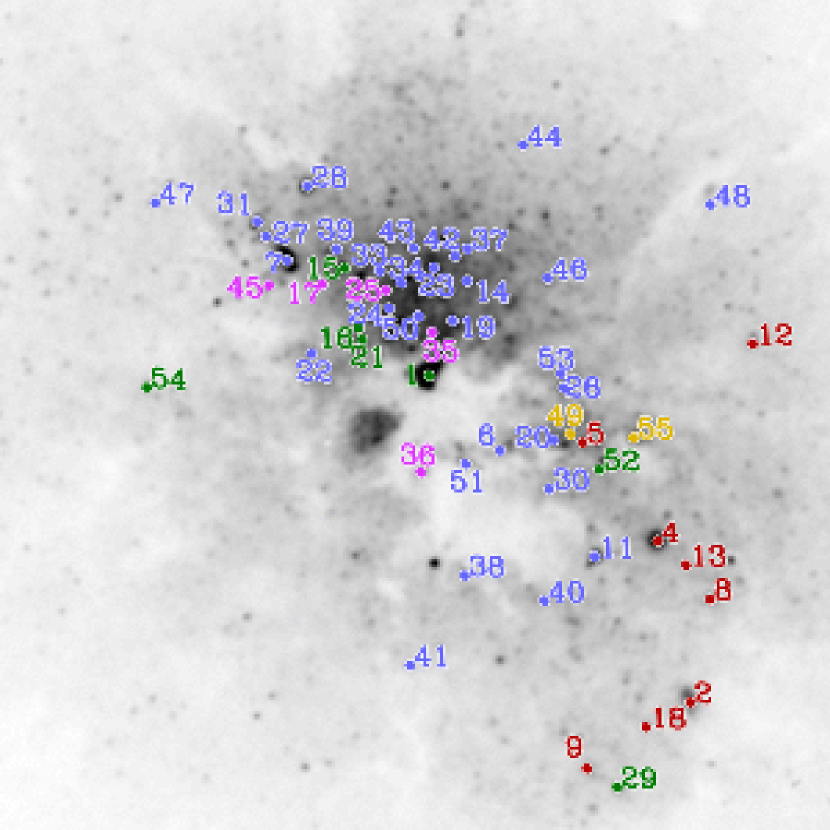
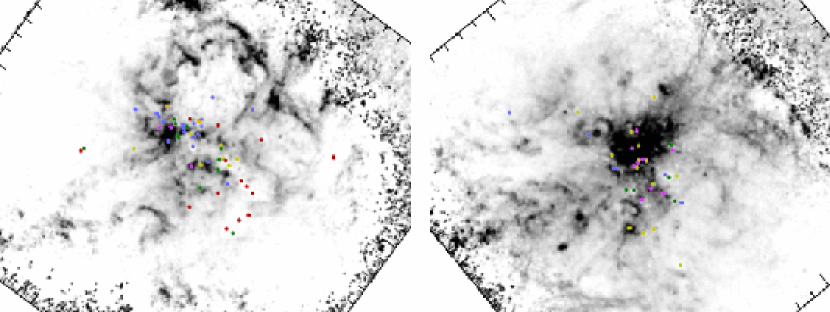
Because the flux-density of ionizing photons is a steeply decreasing function of stellar population age, the equivalent-width of the emission line () provides a reliable age indicator for stellar populations aged less than 10–20 Myr. In order to construct maps of our WFPC2 fields, we use the same rebinned, [N II]-cleaned, continuum-subtracted image that we constructed for our extinction analysis. The images for NGC 3077 and NGC 5253 are shown in Figure 10. The positions of our cluster candidates are overplotted on the images.
In order to assign an value to each cluster candidate, we perform simple aperture photometry at the position of each cluster, both in the image and in an -continuum image. The continuum image is constructed by interpolating between the F547M and F814W images, and renormalizing the interpolated image to the width of the F656N filter. Since the and continuum images are binned 3x3, we first transform the clusters’ pixel coordinates appropriately, and use a photometric aperture of 2 binned pixels. The for each cluster is simply the ratio of the flux at the cluster position to that in the continuum image.
We note that this procedure inherently assumes that all of the flux that is coincident with the cluster position is ionized by the cluster population itself. It is troubling, in the context of this assumption, that there appears to be little correlation between cluster positions and peaks in the -emitting gas. In both galaxies (but especially in NGC 3077), some of the gas is distributed in large-scale filaments (see Figure 10), suggesting that the interstellar media of these galaxies is not necessarily opaque to ionizing photons. In addition, supernovae and massive star winds in young clusters can evacuate their local region of interstellar gas, which could lead to an abnormally low measurement for a cluster of a given young age. For these reasons, it is difficult to associate any lump of ionized gas with its ionizing source. Nevertheless, young clusters do emit ionizing photons, so at some level there must be a correlation between local flux and the presence of an underlying young stellar population, despite these caveats. We therefore retain our simple coincident-aperture measurement as a first-order indicator of the photoionization strength of each cluster.
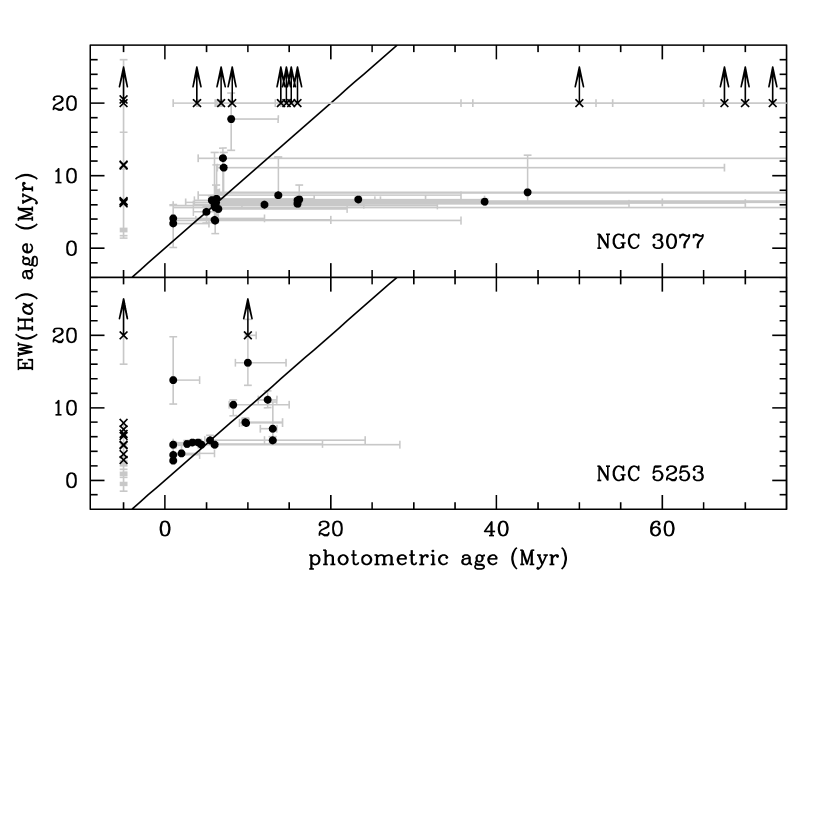
Tables 3 and 4 present our estimates for the cluster candidates in NGC 3077 and NGC 5253, along with -derived age estimates. The age estimates employ the -age relations provided by the Starburst99 models. As we did for the photometric ages, we present the plausible range of ages in addition to the best-fit age, by accounting for the photometric errors in the images. In Figure 11, we show the correlation between the photometric ages, and the ages derived from . The two age estimates are generally consistent with each other, when the plausible age ranges are taken into account.
In a few cases, we found that the photometric age estimate was much older than the age. We believe the most likely explanation for these discrepant ages is an underestimate of the extinction toward these clusters. Because of the shape of the Starburst99 evolutionary track, it is entirely possible for a young, heavily-extincted cluster to be mistaken for a cluster on the red- supergiant loop with low reddening. However, the large flux associated with the young clusters reveals their true age. We manually apply a supplemental extinction to the photometry of 11 clusters in NGC 3077, and 3 clusters in NGC 5253, to bring their intrinsic colors into agreement with their large flux (see Tables 3 and 4).
Once we have estimated cluster ages using both broad-band photometry and , we manually inspect the pair of plausible age ranges for each cluster to derive an overall best age and mass estimate for each cluster. In most cases, the best photometric and ages are in agreement. When they are not, we adopt either the best-fit photometric or age, whichever one falls within the plausible age range of its complement. If neither best-fit age is acceptable, we choose a characteristic age from the intersection of the two age ranges. When the overall best age has been selected, we recompute a mass for the new best age. These overall best age and mass estimates are listed in Tables 3 and 4, for NGC 3077 and NGC 5253, respectively.
3.5 Photometry of Non-Clusters
The majority of the detected objects in the broad-band images could not be classified as clusters; we refer to these objects collectively as “non-clusters” despite the fact that the nature of many of these objects is indeterminate. The extinction-corrected photometry of 243 non-cluster objects in NGC 3077 is presented in Table 5. The photometry of 391 non-cluster objects in NGC 5253 is presented in Table 6.
33 of the non-cluster objects in NGC 3077 were rejected on the basis of their profile shape; the radial profiles were either indistinguishable from a stellar profile, or were sufficiently disturbed or otherwise indeterminate that no classification could be attempted. Similarly, 106 of the non-cluster objects in NGC 5253 were rejected on the basis of profile shape. The remaining non-cluster objects, the majority of the total detection count in each galaxy, were not shape-classified because they were detected in only one of the three broad-band images.
In Figure 12, we show two-color diagrams for objects which were undetected in either F300W or F814W (but were detected in the other two images). These objects have one measured color and one color limit. The color limits are determined by assigning the 50% completeness magnitude to the non-detected band. Objects which are 1.8 mag brighter than the faint limit in F547M are highlighted. These objects tend to have extremely blue colors or extremely red colors. It is possible that the F300W-dropouts are heavily-extincted objects, but they do have rather blue () colors, so it is difficult to place them along the Starburst99 model, even when any arbitrary extinction value is addopted.
4 Discussion
4.1 Cluster Formation Histories
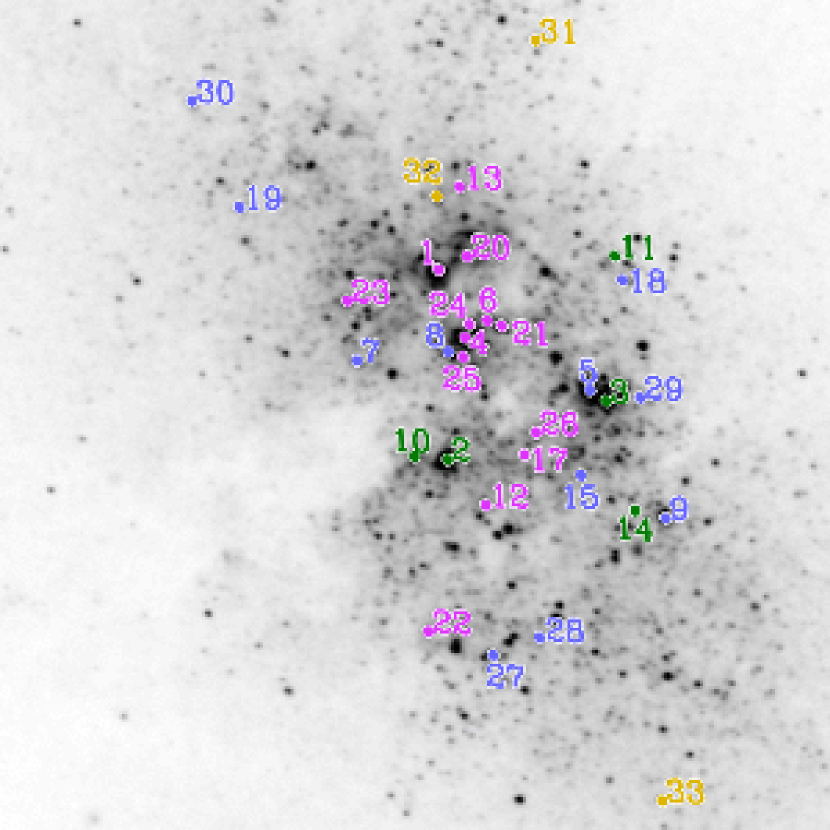
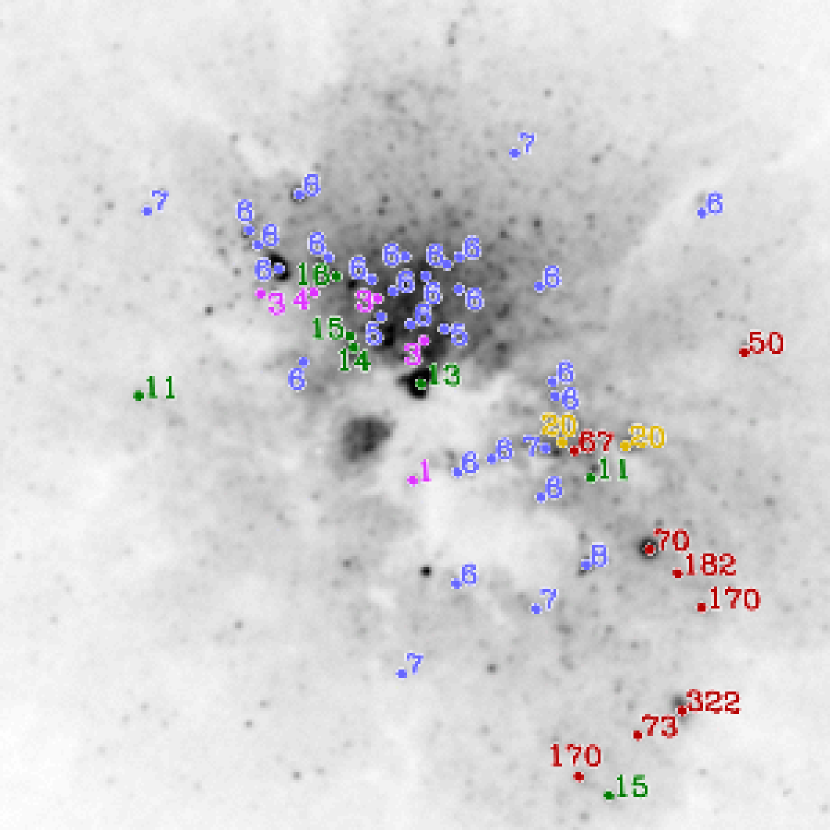
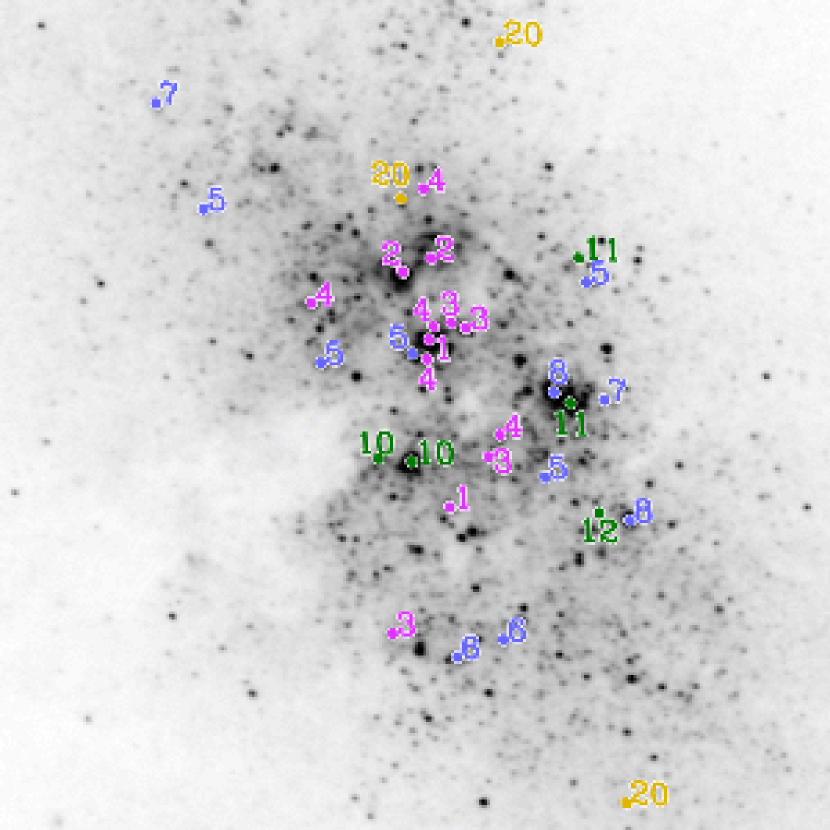
The spatial distributions of our cluster-age estimates for NGC 3077 and NGC 5253 are shown in Figures 13 and 14, respectively. Each cluster position in the F547M image is labeled with its best age estimate, in Myr.
The starburst region in NGC 3077 is dominated by a heavily-extincted central dust cloud (see Figure 1). There is a large group of clusters younger than 10 Myr in a diffuse fan-shaped clump to the north of the central dust cloud. Many of these clusters appear to be nearly coeval, with ages between 5 and 7 Myr. The most massive of these is strikingly apparent as a blue knot to the northeast of the dusty core in Figure 1 (object #12 in Table 3).
The youngest cluster in our NGC 3077 sample (aged 1 Myr) lies inside the central dust cloud (object #43 in Table 3); there are also two objects nearby that are so heavily extincted that they were undetected in the F300W image; these objects are likely also very young clusters that have yet to emerge from the surrounding dust cloud.
There are several clusters in NGC 3077 aged between 10 and 20 Myr, and these are scattered throughout the central starburst region. The visually brightest cluster in our NGC 3077 sample falls in this age range (object #3 in Table 3, aged 13 Myr), and is located adjacent to the central dust cloud. This cluster’s heavy extinction ( mag) and close proximity to the central dust cloud suggest that its age may be overestimated. Indeed, if we adopted an even larger extinction, it would be possible to place the cluster on the youngest portion of the Starburst99 model track in Figure 9. However, the cluster has a very low (see Table 3), making it more likely that its present age estimate is the correct one. NGC 3077 contains several clusters older than 20 Myr, up to 300 Myr old. Most of these are located to the west and southwest of the central dust cloud, and are relatively far from the galaxy’s center.
In NGC 5253, we see a tight group of very young (age Myr) clusters near the center of the galaxy, and there are similarly young clusters scattered throughout the central starburst region, including the ”super star cluster candidate” of Calzetti et al. (1997); object #1 in Table 4.
In contrast to NGC 3077, the clusters with ages between 5 and 10 Myr in NGC 5253 are scattered throughout the starburst region, with no obvious concentrations. Looking at slightly older objects, there are two very bright clusters or groups of clusters in NGC 5253 that have ages around 10 Myr.
The cluster populations in NGC 3077 and NGC 5253 suggest that star formation has proceeded in discrete, highly-correlated regions of activity producing tight groups of clusters which dissipate their parent molecular cloud on a timescale of a few Myr. However, there appears to be a more diffuse component as well, since some of the very young clusters are isolated. The clusters themselves are probably not bound, and will likely dissipate on a short timescale (see Section 4.3).
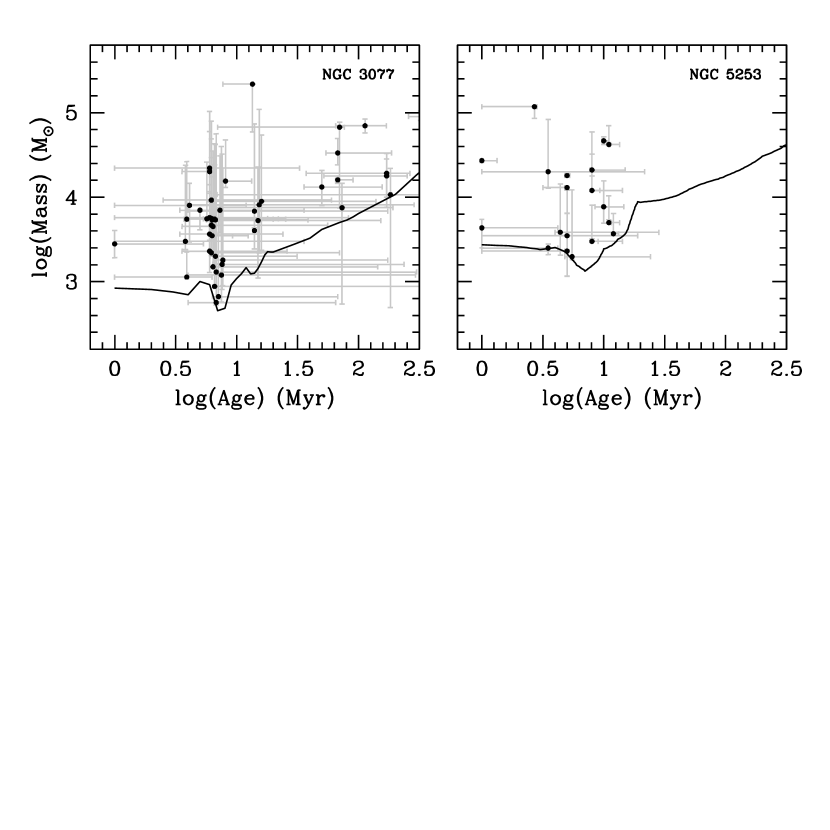
In Figure 15, we plot our best estimate of each cluster’s age against its best mass estimate. The curves in Figure 15 represent the mass corresponding to the 90% completeness limit as a function of cluster age. To construct this curve, we first determine the 90% completeness magnitude, , in each band using artificial object tests. We then scale the mass of each model cluster along the Starburst99 track until its magnitude is . The artificial objects are generated using the best-fit cluster profiles which we used to subtract objects for our series of neighbor-cleaned images (see Section 3). Artificial clusters are distributed randomly in each image, but only within a central subregion where most of the real clusters are found. The completeness curves indicate that evolutionary fading biases our sample against old, low-mass clusters: roughly half of the young (age Myr) clusters would be unobservable if they were 100-200 Myr old. When the possiblility of mass-loss by evaporation is considered, the bias with age becomes even more significant. Figure 15 also indicates that while NGC 3077 contains many more clusters than NGC 5253, the distribution of cluster masses appears to be similar in both galaxies.
We plot the distribution of cluster ages in Figure 16. The shaded histograms are the ages of clusters brighter than M mag. Both galaxies show a strong peak of clusters with ages between 1 and 20 Myr, but the peak in NGC 3077 is much sharper. It has around 20 clusters aged 5–7 Myr, while NGC 5253 has only a few clusters in this age range. NGC 3077 has a number of clusters older than 20 Myr, but there are no clusters in this age range in NGC 5253.
4.2 The Interstellar Medium
NGC 3077 and NGC 5253 exhibit some interesting contrasts in the relationship between their cluster populations and their interstellar gas and dust content. NGC 3077 appears to be a dustier galaxy overall, as can be seen in Figures 1, 4 and 5 (the two regions of apparently-zero extinction at the center of NGC 3077 in Figure 5 are actually extremely extincted; the flux is too low in these regions to obtain an extinction estimate). Furthermore, Figure 5 suggests that the clusters in NGC 3077 are more likely to be found in substantially extincted regions, compared to the clusters in NGC 5253.
The distribution of -emitting gas in these galaxies (Figure 10) reveals more contrasts between these galaxies. The gas in NGC 3077 exhibits a shell/bubble morphology (Martin, 1998), and the largest peak in its is adjacent to (but not coincident with) the location of a grouping of several young clusters. NGC 5253 has much more emission overall (note the different greyscales used in the panels of Figure 10), and it is strongly concentrated into a single, dominant clump of gas. The super star cluster candidate of Calzetti et al. (1997) lies at the very center of this concentration (object #1 in Table 4).
The larger flux from NGC 5253 suggests a larger population of very young stars. Yet we actually observe a smaller population of young clusters in NGC 5253. Since NGC 5253 contains many more objects which may be individual stars in a diffuse field component, one might expect that a substantial portion of the may have been ionized by this diffuse population. However, Tremonti et al. (2001) concluded from long-slit UV STIS spectra that the intercluster field in NGC 5253 is devoid of the massive O stars that are largely responible for photoionization. NGC 5253 contains several “hotspots”, peaks that have no optical counterpart whatsoever. These hotspots are likely extremely young clusters that have yet to emerge from the molecular cloud complexes from which they formed. These embedded young clusters may explain the apparent overabundance of in NGC 5253.
4.3 Cluster Dissolution Timescales and the Diffuse Field Population
Determining cluster dissolution timescales and studying the field stellar populations of starburst galaxies can provide constraints on important questions regarding the origin of field populations. Are the field populations of galaxies composed of dissolved clusters, or did they form in situ, from a diffuse field mode of star formation? Is the origin of the field population different for different galaxies?
In NGC 5253, we observe a complete lack of clusters older than Myr, while NGC 3077 contains many such clusters, and several which are older than 100 Myr. This contrast cannot be entirely understood as a difference in the completeness rates in the two galaxies. Applying NGC 5253’s completeness curve to NGC 3077’s cluster population in Figure 15 results in seven clusters older than 10 Myr becoming unobservable, which is less than half the total number of its clusters in this age range. Does the lack of older clusters in NGC 5253 indicate that cluster dissolution is more efficent in NGC 5253, or simply that the star-formation episode in NGC 5253 began only Myr ago? We examine the dynamic environments of the two galaxies to address this question.
As Tremonti et al. (2001) already determined, evaporation timescales for clusters in the center of NGC 5253 are around 20 Myr, using the figures of Kim et al. (1999) for the Milky Way rescaled to the case of NGC 5253. Although NGC 5253 is about two orders of magnitudes less massive than the Milky Way, the evaporation timescales for stellar clusters within 100-150 pc from its center are only 4 times longer than for our Galaxy under the same conditions. The main reason resides in the large velocity dispersion measured by Caldwell & Phillips (1989), 50 km s-1, in the center of the dwarf galaxy, much larger than for instance, its central rotation velocity (a few km s-1). By applying the virial theorem to this central dispersion velocity, we obtain an estimate for the mass contained within the central 100 pc of NGC 5253, which is only 15 times smaller than the mass contained within the same radius in the Milky Way (Kim et al., 1999). This suprisingly large central mass concentration leads to small predicted evaporation timescales for the star clusters in the center of NGC 5253. For the range of cluster masses we detect, the evaporation timescales are in the range 16–50 Myr. These values may be uncertain by as much as a factor of two, because of the uncertainty in the techniques used to model the evolution of clusters (e.g. Portegies Zwart et al., 2002). In addition, mass segregation can contribute to accelerate tidal evaporation of clusters (Kim et al., 1999). Combining the cluster dissolution information with the lack of massive stellar populations in the intercluster field of NGC 5253 (Tremonti et al., 2001) suggests that most stars in NGC 5253 form in star clusters, which then dissolve into the field population on a timescale of Myr. The two large clusters in NGC 5253 which are Myr old are interesting in this context; perhaps these objects are massive enough to survive the harsh dynamical environment of NGC 5253’s core.
NGC 3077 appears to have a comparable rotation velocity to that of NGC 5253, but a much smaller central dispersion velocity; direct measurements from broadening of stellar features are not available for this galaxy; the small dispersion is inferred from molecular clouds velocities (Walter et al., 2002). If these velocities are representative, the central dispersion in this galaxy is 20 km s-1, or about a factor 2.5 smaller than in NGC 5253. Because of the strong tidal fields in the environments of the cluster populations, we associate the evaporation timescale of star clusters with the dynamical time of the star cluster’s orbit in the host galaxy (see Eq. 2 in Kim et al., 1999). Under this assumption, the difference in central velocity dispersions implies that cluster evaporation timescales are 2.5 times longer in NGC 3077, compared to NGC 5253, which can perhaps account for the older clusters present in NGC 3077.
4.4 Comparing to the Starburst in M 83
It is instructive to compare the nature of the starbursts in the dwarf galaxies NGC 3077 and NGC 5253 to the nuclear starburst of the grand-design spiral galaxy, M 83. While the three starburst regions contain similar total numbers of clusters, the M 83 starburst has many more bright clusters (33 clusters with mag); than NGC 3077 or NGC 5253, which have 12 and 11, respectively. Since M 83 is 5–10 times more massive than these dwarf galaxies, it is perhaps not suprising that its starburst contains a proportionately larger number of massive star clusters. However, while the mass distribution is more top-heavy in M 83, we note that the mass of the largest star clusters in all three galaxies is about the same: (see Figure 15 and Figure 11 in Harris et al. (2001)).
Furthermore, we find no correlation between the physical size of the starburst region and the size of the galaxy. In all three galaxies, the starburst regions (as defined by the presence of young clusters) span pc. In M 83, this amounts to only the innermost few percent of the galaxy’s total radial extent; while in NGC 3077 and NGC 5253, the starburst regions encompass a much larger fraction of each galaxy’s optical extent. This contrast in the starburst’s significance to the whole galaxy may point to a fundamental difference in the nature of the starbursts. In M 83 it is likely that gas and dust are funneled into the nuclear region by the galaxy’s bar instability, creating a localized region overdense with prestellar material, and ripe for intense star formation. However, these dynamical conditions do not exist in the dwarf galaxies NGC 3077 and NGC 5253, so the conditions leading them to starburst may be fundamentally different.
Another interesting contrast between M 83 and these dwarf galaxies is in the spatial distribution of their youngest clusters. In Harris et al. (2001), we noted the presence of an “active ringlet”; a semicircular annulus centered on the optical nucleus of the galaxy. This ringlet contains the bulk of the young clusters in M 83’s starburst, and also appears to be a hot cavity of ionized interstellar material, surrounded by denser gas. The young clusters span a very narrow range in age (5–10 Myr), and appear to be more-or-less uniformly distributed throughout the ringlet. There is some evidence that a handful of even younger clusters are distributed along the rim of the cavity, perhaps partially embedded in the surrounding denser gas. The history implied by this evidence is of a highly-correlated star formation event that formed most of the clusters in the ringlet at about the same time. In NGC 3077 and NGC 5253, on the other hand, we see starburst regions that are not so well-defined, and cluster populations spanning a slightly wider range of ages (1–20 Myr). In addition, we see discrete groups of coeval star clusters, distinctly younger than the ages of the more diffusely distributed clusters. The history implied is one where cluster formation is more stochastic in these dwarf galaxies; small groups of clusters form together in the densest regions of the interstellar material, which is then dispersed by the energy output of the clusters after only a few Myr.
5 Summary
We present HST photometry of stars and star clusters in the nearby dwarf starburst galaxies NGC 3077 and NGC 5253. We use standard aperture photometry in our analysis, but the photometry is performed on images in which nearby neighbors have been subtracted using a best-fit profile model. We separate star clusters from individual stars using the profile-shape information provided by the WFPC2 images. We have measured photometry in the F300W, F547M, nd F814W bands for 55 star clusters in NGC 3077 and 33 star clusters in NGC 5253. The photometry is extinction-corrected using the ratio of to .
By comparing the extinction-corrected cluster photometry to Starburst99 population synthesis models, we derive age and mass estimates for each cluster. We also measure toward each cluster, which provides an additional age constraint for young clusters. Both galaxies have abundant populations of star clusters with ages less than 20 Myr, and masses between a few thousand and .
We discuss some interesting contrasts between these two cluster populations. NGC 3077 has more clusters overall, and about half of them lie in the very narrow age range between 5 and 7 Myr. These coeval clusters are distributed in a loose, fan-shaped region to the northeast of the central dust cloud in NGC 3077. NGC 5253 has a large number of very young (age Myr) star clusters, and about half of these are in one tight clump near the center of the galaxy. NGC 3077 has only five clusters younger than 5 Myr, and they don’t appear to be spatially correlated. However, the youngest cluster in NGC 3077 lies within the central dust cloud, and there is some evidence for other young objects nearby that have yet to fully emerge from the dusty core. NGC 3077 contains several intermediate-age clusters, up to several hundred Myr old (although all clusters older than Myr are relatively far from the galaxy’s center). In contrast, NGC 5253 contains no clusters older than Myr. This difference is possibly due to the different cluster dissolution timescales in these two galaxies. We estimate that typical dissolution timescales are times longer in NGC 3077 than in NGC 5253.
The star cluster populations suggest that star formation has proceeded in discrete, highly-correlated clumps in these galaxies, and that this initial structure is dissipated on a short timescale (of order 20 Myr in NGC 5253) by the harsh dynamic environment of the galaxies’ centers.
We compare the star clusters in these dwarf starburst galaxies to the clusters in the nuclear starburst of M 83, a giant spiral galaxy. The three cluster populations have similar age distributions, and they cover similar ranges in mass. However, the clusters in M 83 have a mass distribution that is more top-heavy. Furthermore, the spatial distribution of clusters in M 83 is much more structured than in either dwarf. Most of its clusters lie within a distinct annular ring structure centered on M 83’s nucleus. This contrast may result from a fundamental difference in the conditions that lead these galaxies to starburst. M 83’s strong bar feature is likely funneling material into the nuclear region, creating a localized region rich in gas and dust; an environment ripe for vigorous star formation. No such internal dynamics mechanism exists in the dwarf galaxies, so something else must have caused them to starburst. External interactions seem like a likely candidate for NGC 3077, given its well-known interactions within the M 81 group. However, NGC 5253 may be too isolated to have been recently triggered by an interaction, so the cause for its current starburst activity is less clear.
Acknowledgements: This work has been supported by the NASA LTSA grant NAG5-9173 and by the NASA HST grant GO-9144.01-A.
References
- Adelberger & Steidel (2000) Adelberger, K. L. & Steidel, C. C.: 2000, ApJ 544, 218
- Caldwell & Phillips (1989) Caldwell, N. & Phillips, M. M.: 1989, ApJ 338, 789
- Calzetti (1997) Calzetti, D.: 1997, AJ 113, 162
- Calzetti et al. (2000) Calzetti, D., Armus, L., Bohlin, R. C., Kinney, A. L., Koornneef, J., & Storchi-Bergmann, T.: 2000, ApJ 533, 682
- Calzetti et al. (2003) Calzetti, D., Harris, J., Gallagher, J. S., Smith, D. A., & Conselice, C. J.: 2003, The Structure and Morphology of Ionized Gas in Starburst Galaxies: NGC 3077/5253, in preparation
- Calzetti et al. (1994) Calzetti, D., Kinney, A. L., & Storchi-Bergmann, T.: 1994, ApJ 429, 582
- Calzetti et al. (1997) Calzetti, D., Meurer, G. R., Bohlin, R. C., Garnett, D. R., Kinney, A. L., Leitherer, C., & Storchi-Bergmann, T.: 1997, AJ 114, 1834+
- Casertano (1997) Casertano, S.: 1997, in The 1997 HST Calibration Workshop with a new generation of instruments /edited by Stefano Casertano, Robert Jedrzejewski, Charles D. Keyes, and Mark Stevens. Baltimore, MD : Space Telescope Science Institute (1997) QB 500.268 C35 1997, p. 327., pp 327+
- de Vaucouleurs (1979) de Vaucouleurs, G.: 1979, AJ 84, 1270
- de Vaucouleurs et al. (1991) de Vaucouleurs, G., de Vaucouleurs, A., Corwin, H. G., Buta, R. J., Paturel, G., & Fouque, P.: 1991, Third Reference Catalogue of Bright Galaxies, Volume 1-3, XII, 2069 pp. 7 figs.. Springer-Verlag Berlin Heidelberg New York
- Dolphin (2002) Dolphin, A. E.: 2002, in The 2002 HST Calibration Workshop : Hubble after the Installation of the ACS and the NICMOS Cooling System, Proceedings of a Workshop held at the Space Telescope Science Institute, Baltimore, Maryland, October 17 and 18, 2002. Edited by Santiago Arribas, Anton Koekemoer, and Brad Whitmore. Baltimore, MD: Space Telescope Science Institute, 2002., p.303, pp 303–+
- Freedman et al. (2001) Freedman, W. L., Madore, B. F., Gibson, B. K., Ferrarese, L., Kelson, D. D., Sakai, S., Mould, J. R., Kennicutt, R. C., Ford, H. C., Graham, J. A., Huchra, J. P., Hughes, S. M. G., Illingworth, G. D., Macri, L. M., & Stetson, P. B.: 2001, ApJ 553, 47
- Harris et al. (2001) Harris, J., Calzetti, D., Gallagher, J. S., Conselice, C. J., & Smith, D. A.: 2001, AJ 122, 3046
- Karachentsev et al. (2002a) Karachentsev, I. D., Dolphin, A. E., Geisler, D., Grebel, E. K., Guhathakurta, P., Hodge, P. W., Karachentseva, V. E., Sarajedini, A., Seitzer, P., & Sharina, M. E.: 2002a, A&A 383, 125
- Karachentsev et al. (2002b) Karachentsev, I. D., Sharina, M. E., Dolphin, A. E., Grebel, E. K., Geisler, D., Guhathakurta, P., Hodge, P. W., Karachentseva, V. E., Sarajedini, A., & Seitzer, P.: 2002b, A&A 385, 21
- Kim et al. (1999) Kim, S. S., Morris, M., & Lee, H. M.: 1999, ApJ 525, 228
- Kroupa (2001) Kroupa, P.: 2001, MNRAS 322, 231
- Leitherer et al. (1999) Leitherer, C., Schaerer, D., Goldader, J. D., Delgado, R. M. G. ., Robert, C., Kune, D. F., de Mello, D. . F., Devost, D., & Heckman, T. M.: 1999, ApJS 123, 3
- Lowenthal et al. (1997) Lowenthal, J. D., Koo, D. C., Guzman, R., Gallego, J., Phillips, A. C., Faber, S. M., Vogt, N. P., Illingworth, G. D., & Gronwall, C.: 1997, ApJ 481, 673+
- Martin (1997) Martin, C. L.: 1997, ApJ 491, 561
- Martin (1998) Martin, C. L.: 1998, ApJ 506, 222
- Meurer et al. (1999) Meurer, G. R., Heckman, T. M., & Calzetti, D.: 1999, ApJ 521, 64
- Meurer et al. (1997) Meurer, G. R., Heckman, T. M., Lehnert, M. D., Leitherer, C., & Lowenthal, J.: 1997, AJ 114, 54
- Mobasher (2002) Mobasher, B. (ed.): 2002, HST Data Handbook for WFPC2, Vol. 1, Space Telescope Science Institute, 4.0 edition
- Pettini et al. (2000) Pettini, M., Steidel, C. C., Adelberger, K. L., Dickinson, M., & Giavalisco, M.: 2000, ApJ 528, 96
- Portegies Zwart et al. (2002) Portegies Zwart, S. F., Makino, J., McMillan, S. L. W., & Hut, P.: 2002, ApJ 565, 265
- Riess (2000) Riess, A.: 2000, WFPC2 Instrument Science Report 00-04
- Schlegel et al. (1998) Schlegel, D. J., Finkbeiner, D. P., & Davis, M.: 1998, ApJ 500, 525+
- Schmidt et al. (1994) Schmidt, B. P., Kirshner, R. P., Eastman, R. G., Phillips, M. M., Suntzeff, N. B., Hamuy, M., Maza, J., & Aviles, R.: 1994, ApJ 432, 42
- Steidel et al. (1996) Steidel, C. C., Giavalisco, M., Pettini, M., Dickinson, M., & Adelberger, K. L.: 1996, ApJ 462, L17
- Stetson (1998) Stetson, P. B.: 1998, PASP 110, 1448
- Tammann & Sandage (1968) Tammann, G. A. & Sandage, A.: 1968, ApJ 151, 825
- Tremonti et al. (2001) Tremonti, C. A., Calzetti, D., Leitherer, C., & Heckman, T. M.: 2001, ApJ 555, 322
- Walter et al. (2002) Walter, F., Weiss, A., Martin, C., & Scoville, N.: 2002, AJ 123, 225
- Whitmore et al. (1999a) Whitmore, B., Heyer, I., & Casertano, S.: 1999a, PASP 111, 1559
- Whitmore et al. (1999b) Whitmore, B. C., Zhang, Q., Leitherer, C., Fall, S. M., Schweizer, F. ., & Miller, B. W.: 1999b, AJ 118, 1551
- Williams et al. (1996) Williams, R. E., Blacker, B., Dickinson, M., Dixon, W. V. D., Ferguson, H. C., Fruchter, A. S., Giavalisco, M., Gilliland, R. L., Heyer, I., Katsanis, R., Levay, Z., Lucas, R. A., McElroy, D. B., Petro, L., Postman, M., Adorf, H., & Hook, R.: 1996, AJ 112, 1335+
- Zaritsky et al. (1994) Zaritsky, D., Kennicutt, R. C., & Huchra, J. P.: 1994, ApJ 420, 87


| Galaxy | Morph.aaMorphological and photometric data from the RC3 (de Vaucouleurs et al., 1991). | D | MBaaMorphological and photometric data from the RC3 (de Vaucouleurs et al., 1991). | angular size aaMorphological and photometric data from the RC3 (de Vaucouleurs et al., 1991). | linear size | bbSchlegel et al. (1998) | 12(O/H) |
|---|---|---|---|---|---|---|---|
| Name | Type | (Mpc) | (mag) | (arcmin) | (kpc) | (mag) | |
| NGC 3077 | I0 pec | ccTammann & Sandage (1968); ddTip of the Red Giant Branch (TRGB); Karachentsev et al. (2002a) | 5.6 | 0.07 | iiCalzetti et al. (2003) | ||
| NGC 5253 | Im pec | eeCepheid Variables; Freedman et al. (2001); ffTRGB; Karachentsev et al. (2002b) | 5.6 | 0.06 | iiCalzetti et al. (2003); jjMartin (1997) | ||
| NGC 5236 (M 83) | SAB(s)c | ggde Vaucouleurs (1979); hhSupernova Expanding Photosphere; Schmidt et al. (1994) | 16 | 0.07 | kkZaritsky et al. (1994) |
| Exposure | Target | Date | Filter | Position Angle | |
|---|---|---|---|---|---|
| Name | YYYY-MM-DD | (sec) | (°) | ||
| u6eu0301 | NGC 3077 | 2001-05-22 | F300W () | 800 | 143.88 |
| u6eu0302 | NGC 3077 | 2001-05-22 | 800 | 143.88 | |
| u6eu0303 | NGC 3077 | 2001-05-22 | 800 | 143.88 | |
| u6eu0304 | NGC 3077 | 2001-05-22 | F547M () | 600 | 143.88 |
| u6eu0401 | NGC 3077 | 2001-05-23 | 600 | 143.37 | |
| u6eu0305 | NGC 3077 | 2001-05-22 | F814W () | 300 | 143.88 |
| u6eu0402 | NGC 3077 | 2001-05-23 | 400 | 143.37 | |
| u6eu0306 | NGC 3077 | 2001-05-22 | F487N () | 700 | 143.88 |
| u6eu0307 | NGC 3077 | 2001-05-22 | 700 | 143.88 | |
| u6eu0403 | NGC 3077 | 2001-05-23 | 1300 | 143.37 | |
| u6eu0406 | NGC 3077 | 2001-05-23 | 700 | 143.37 | |
| u6eu030c | NGC 3077 | 2001-05-23 | F656N () | 300 | 143.88 |
| u6eu030d | NGC 3077 | 2001-05-23 | 800 | 143.88 | |
| u6eu0405 | NGC 3077 | 2001-05-23 | 800 | 143.37 | |
| u65r2602r | NGC 5253 | 2000-07-24 | F300W () | 1000 | 156.40 |
| u65r2603r | NGC 5253 | 2000-07-24 | 800 | 156.40 | |
| u3760107 | NGC 5253 | 1996-05-08 | F547M () | 200 | 129.34 |
| u3760108 | NGC 5253 | 1996-05-08 | 600 | 129.34 | |
| u3760109 | NGC 5253 | 1996-05-08 | 200 | 129.34 | |
| u376010a | NGC 5253 | 1996-05-08 | 600 | 129.34 | |
| u3760105 | NGC 5253 | 1996-05-08 | F814W () | 400 | 129.34 |
| u3760106 | NGC 5253 | 1996-05-08 | 180 | 129.34 | |
| u376010b | NGC 5253 | 1996-05-08 | 180 | 129.34 | |
| u376010c | NGC 5253 | 1996-05-08 | 400 | 129.34 | |
| u3760101 | NGC 5253 | 1996-05-08 | F487N () | 1200 | 129.34 |
| u3760102 | NGC 5253 | 1996-05-08 | 1300 | 129.34 | |
| u376010f | NGC 5253 | 1996-05-09 | 1300 | 129.34 | |
| u376010g | NGC 5253 | 1996-05-09 | 1300 | 129.34 | |
| u3760103 | NGC 5253 | 1996-05-08 | F656N () | 500 | 129.34 |
| u3760104 | NGC 5253 | 1996-05-08 | 1500 | 129.34 | |
| u376010d | NGC 5253 | 1996-05-08 | 500 | 129.34 | |
| u376010e | NGC 5253 | 1996-05-08 | 1100 | 129.34 |
| ID | (2000) | (2000) | E(B-V) | Phot. MassaaMass and Age estimates from broad-band photometry. There are no estimates for points which are farther than 5 from the Starburst99 model track. | Mass range | Phot. AgeaaMass and Age estimates from broad-band photometry. There are no estimates for points which are farther than 5 from the Starburst99 model track. | Age rangeaaMass and Age estimates from broad-band photometry. There are no estimates for points which are farther than 5 from the Starburst99 model track. | EW(H) | H AgebbAge estimates from EW(H). There is no estimate when EW(H) is not detected, although these clusters are likely older than 10–20 Myr. | Age rangebbAge estimates from EW(H). There is no estimate when EW(H) is not detected, although these clusters are likely older than 10–20 Myr. | MassccFinal Mass and Age estimates, combining constraints from the broad-band photometry and EW(H). | AgeccFinal Mass and Age estimates, combining constraints from the broad-band photometry and EW(H). | |||
|---|---|---|---|---|---|---|---|---|---|---|---|---|---|---|---|
| (STMAG) | (STMAG) | (STMAG) | (mag) | () | () | Myr | Myr | () | (Myr) | (Myr) | () | (Myr) | |||
| 1 | 10h 3m 19.15s | 68° 44′ 2.17″ | 15.294 | 16.282 | 16.732 | 0.70 | 69 | 59– 219 | 8 | 8– 14 | 2 | 18 | 14– 21 | 218 | 14 |
| 2 | 10h 3m 17.42s | 68° 43′ 50.42″ | 19.384 | 19.079 | 20.073 | 0.06 | 90 | 81– 105 | 322 | 257– 389 | 0 | 90 | 322 | ||
| 3 | 10h 3m 14.75s | 68° 44′ 0.17″ | 18.460 | 18.810 | 19.624 | 0.06 | 70 | 57– 84 | 113 | 65– 170 | 0 | 70 | 113 | ||
| 4 | 10h 3m 17.64s | 68° 43′ 56.21″ | 17.565 | 18.289 | 19.184 | 0.28 | 67 | 7– 77 | 70 | 7– 77 | 0 | 67 | 70 | ||
| 5 | 10h 3m 18.14s | 68° 43′ 59.75″ | 19.585 | 19.789 | 20.391 | 0.06 | 33 | 24– 50 | 68 | 54– 187 | 0 | 33 | 68 | ||
| 6 | 10h 3m 18.69s | 68° 43′ 59.47″ | 16.145 | 17.467 | 18.769 | 1.65 | 22 | 12– 104 | 6 | 1– 33 | 217 | 6 | 6– 6 | 22 | 6 |
| 7 | 10h 3m 20.09s | 68° 44′ 6.30″ | 15.943 | 17.700 | 19.034 | 0.06 | 16 | 11– 20 | 6 | 4– 6 | 44 | 7 | 7– 7 | 20 | 6 |
| 8 | 10h 3m 17.29s | 68° 43′ 54.12″ | 20.036 | 20.314 | 21.291 | 0.06 | 19 | 8– 33 | 170 | 37– 264 | 0 | 19 | 170 | ||
| 9 | 10h 3m 18.11s | 68° 43′ 48.06″ | 20.106 | 20.390 | 21.382 | 0.06 | 18 | 10– 28 | 170 | 52– 250 | 0 | 18 | 170 | ||
| 10 | 10h 3m 22.69s | 68° 44′ 1.39″ | 20.182 | 20.502 | 21.001 | 0.06 | 16 | 15– 18 | 68 | 65– 90 | 0 | 16 | 68 | ||
| 11 | 10h 3m 18.06s | 68° 43′ 55.67″ | 16.898 | 17.974 | 18.385 | 0.70 | 16 | 13– 48 | 8 | 8– 13 | 0 | 16 | 8 | ||
| 12 | 10h 3m 17.02s | 68° 44′ 3.29″ | 19.968 | 20.408 | 21.120 | 0.21 | 13 | 8– 21 | 50 | 36– 157 | 0 | 13 | 50 | ||
| 13 | 10h 3m 17.45s | 68° 43′ 55.35″ | 20.750 | 20.981 | 22.072 | 0.06 | 11 | 0– 22 | 183 | 7– 378 | 0 | 11 | 183 | ||
| 14 | 10h 3m 18.91s | 68° 44′ 5.56″ | 17.227 | 18.326 | 19.565 | 0.69ddThe E(B-V) estimate for this object was manually adjusted to bring its photometric age estimate into agreement with its EW(H). | 9 | 6– 80 | 6 | 3– 60 | 93 | 6 | 4– 9 | 9 | 6 |
| 15 | 10h 3m 19.71s | 68° 44′ 6.03″ | 18.546 | 19.446 | 20.410 | 0.36 | 9 | 2– 54 | 16 | 6– 139 | 0 | 9 | 16 | ||
| 16 | 10h 3m 19.62s | 68° 44′ 3.88″ | 18.713 | 19.473 | 20.385 | 0.44 | 8 | 2– 109 | 15 | 4– 286 | 0 | 8 | 15 | ||
| 17 | 10h 3m 19.86s | 68° 44′ 5.46″ | 17.128 | 19.410 | 20.439 | 0.51 | 4 | 3– 15 | 1 | 1– 12 | 518 | 4 | 3– 6 | 8 | 4 |
| 18 | 10h 3m 17.72s | 68° 43′ 49.54″ | 20.368 | 20.925 | 21.726 | 0.06 | 7 | 1– 15 | 73 | 7– 191 | 0 | 8 | 73 | ||
| 19 | 10h 3m 19.00s | 68° 44′ 4.14″ | 17.265 | 18.917 | 20.037 | 0.35ddThe E(B-V) estimate for this object was manually adjusted to bring its photometric age estimate into agreement with its EW(H). | 7 | 4– 7 | 5 | 3– 6 | 442 | 5 | 4– 6 | 7 | 5 |
| 20 | 10h 3m 18.33s | 68° 43′ 59.85″ | 17.604 | 18.999 | 19.813 | 0.81 | 10 | 4– 31 | 14 | 4– 36 | 24 | 7 | 6– 13 | 7 | 7 |
| 21 | 10h 3m 19.60s | 68° 44′ 3.47″ | 18.435 | 19.505 | 20.265 | 0.43 | 7 | 2– 74 | 14 | 4– 174 | 0 | 7 | 14 | ||
| 22 | 10h 3m 19.93s | 68° 44′ 2.97″ | 17.681 | 19.031 | 20.257 | 0.63ddThe E(B-V) estimate for this object was manually adjusted to bring its photometric age estimate into agreement with its EW(H). | 6 | 3– 60 | 6 | 1– 83 | 360 | 6 | 4– 6 | 6 | 6 |
| 23 | 10h 3m 19.12s | 68° 44′ 6.04″ | 17.625 | 18.901 | 20.157 | 0.25ddThe E(B-V) estimate for this object was manually adjusted to bring its photometric age estimate into agreement with its EW(H). | 6 | 5– 17 | 6 | 6– 18 | 32 | 7 | 6– 12 | 6 | 6 |
| 24 | 10h 3m 19.42s | 68° 44′ 4.58″ | 17.315 | 18.646 | 19.741 | 0.49 | 6 | 6– 26 | 6 | 5– 22 | 400 | 5 | 4– 6 | 6 | 6 |
| 25 | 10h 3m 19.44s | 68° 44′ 5.24″ | 17.141 | 18.496 | 19.907 | 0.60ddThe E(B-V) estimate for this object was manually adjusted to bring its photometric age estimate into agreement with its EW(H). | 8 | 5– 26 | 6 | 4– 20 | 555 | 4 | 4– 6 | 6 | 4 |
| 26 | 10h 3m 18.27s | 68° 44′ 1.72″ | 17.657 | 18.687 | 19.906 | 0.61ddThe E(B-V) estimate for this object was manually adjusted to bring its photometric age estimate into agreement with its EW(H). | 13 | 5– 24 | 16 | 6– 25 | 47 | 7 | 6– 7 | 6 | 7 |
| 27 | 10h 3m 20.23s | 68° 44′ 7.17″ | 17.590 | 19.100 | 20.564 | 0.06 | 4 | 4– 5 | 6 | 6– 6 | 74 | 6 | 6– 7 | 5 | 6 |
| 28 | 10h 3m 19.96s | 68° 44′ 8.98″ | 17.534 | 18.491 | 19.436 | 0.27ddThe E(B-V) estimate for this object was manually adjusted to bring its photometric age estimate into agreement with its EW(H). | 29 | 5– 42 | 23 | 7– 39 | 38 | 7 | 7– 7 | 5 | 7 |
| 29 | 10h 3m 17.91s | 68° 43′ 47.38″ | 19.741 | 20.309 | 20.965 | 0.06 | 5 | 1– 23 | 15 | 7– 152 | 0 | 5 | 15 | ||
| 30 | 10h 3m 18.36s | 68° 43′ 58.10″ | 17.792 | 18.569 | 20.014 | 0.80 | 14 | 5– 49 | 16 | 6– 56 | 140 | 6 | 6– 6 | 5 | 6 |
| 31 | 10h 3m 20.29s | 68° 44′ 7.71″ | 17.732 | 19.429 | 20.753 | 0.06ddThe E(B-V) estimate for this object was manually adjusted to bring its photometric age estimate into agreement with its EW(H). | 3 | 2– 4 | 6 | 4– 6 | 46 | 7 | 6– 7 | 5 | 6 |
| 32 | 10h 3m 22.58s | 68° 44′ 1.81″ | 18.864 | 20.042 | 20.844 | 0.06 | 4 | 4– 4 | 14 | 14– 14 | 0 | 4 | 14 | ||
| 33 | 10h 3m 19.48s | 68° 44′ 5.92″ | 18.010 | 19.448 | 20.653 | 0.37ddThe E(B-V) estimate for this object was manually adjusted to bring its photometric age estimate into agreement with its EW(H). | 4 | 2– 14 | 6 | 3– 24 | 170 | 6 | 6– 6 | 4 | 6 |
| 34 | 10h 3m 19.34s | 68° 44′ 5.50″ | 18.034 | 19.705 | 20.408 | 0.22 | 9 | 6– 10 | 12 | 9– 12 | 192 | 6 | 6– 6 | 4 | 6 |
| 35 | 10h 3m 19.13s | 68° 44′ 3.73″ | 17.790 | 19.302 | 20.544 | 0.51 | 4 | 2– 24 | 6 | 1– 36 | 613 | 4 | 2– 6 | 3 | 4 |
| 36 | 10h 3m 19.21s | 68° 43′ 58.70″ | 17.505 | 19.701 | 20.778 | 0.56 | 3 | 2– 4 | 1 | 1– 5 | 911 | 3 | 0– 6 | 3 | 1 |
| 37 | 10h 3m 18.90s | 68° 44′ 6.72″ | 18.549 | 19.914 | 21.551 | 0.18 | 2 | 1– 9 | 6 | 4– 26 | 48 | 7 | 4– 13 | 2 | 6 |
| 38 | 10h 3m 18.92s | 68° 43′ 54.99″ | 18.432 | 19.414 | 20.566 | 0.56 | 7 | 2– 30 | 16 | 6– 70 | 124 | 6 | 6– 6 | 2 | 6 |
| 39 | 10h 3m 19.77s | 68° 44′ 6.72″ | 18.827 | 19.807 | 21.323 | 0.15 | 5 | 2– 10 | 16 | 6– 31 | 42 | 7 | 6– 9 | 2 | 7 |
| 40 | 10h 3m 18.39s | 68° 43′ 54.08″ | 19.772 | 20.388 | 21.166 | 0.06 | 9 | 1– 22 | 44 | 7– 174 | 18 | 8 | 7– 13 | 2 | 8 |
| 41 | 10h 3m 19.28s | 68° 43′ 51.77″ | 19.681 | 20.249 | 21.315 | 0.26ddThe E(B-V) estimate for this object was manually adjusted to bring its photometric age estimate into agreement with its EW(H). | 14 | 1– 32 | 165 | 6– 236 | 19 | 8 | 7– 13 | 2 | 8 |
| 42 | 10h 3m 18.98s | 68° 44′ 6.46″ | 19.128 | 19.920 | 20.756 | 0.11 | 11 | 1– 35 | 39 | 6– 143 | 69 | 6 | 6– 7 | 2 | 6 |
| 43 | 10h 3m 19.26s | 68° 44′ 6.75″ | 19.467 | 19.805 | 21.087 | 0.06 | 27 | 1– 56 | 161 | 7– 300 | 64 | 7 | 5– 12 | 1 | 7 |
| 44 | 10h 3m 18.54s | 68° 44′ 10.44″ | 19.856 | 20.591 | 21.343 | 0.31 | 1 | 1– 40 | 7 | 4– 293 | 8 | 12 | 8– 14 | 1 | 8 |
| 45 | 10h 3m 20.21s | 68° 44′ 5.42″ | 18.243 | 20.125 | 21.805 | 0.21 | 1 | 1– 2 | 4 | 1– 6 | 0 | 1 | 4 | ||
| 46 | 10h 3m 18.37s | 68° 44′ 5.66″ | 20.087 | 20.548 | 21.045 | 0.15 | 14 | 1– 43 | 80 | 7– 322 | 92 | 6 | 6– 7 | 1 | 7 |
| 47 | 10h 3m 20.97s | 68° 44′ 8.40″ | 19.936 | 20.858 | 21.655 | 0.06 | 1 | 1– 7 | 7 | 6– 68 | 13 | 11 | 7– 13 | 1 | 7 |
| 48 | 10h 3m 17.30s | 68° 44′ 8.28″ | 19.753 | 20.945 | 21.932 | 0.12 | 1 | 1– 7 | 7 | 4– 65 | 0 | 1 | 7 | ||
| 49 | 10h 3m 19.22s | 68° 44′ 4.31″ | 19.035 | 20.259 | 99.999 | 0.15 | 123 | 6 | 6– 7 | 6 | |||||
| 50 | 10h 3m 18.91s | 68° 43′ 58.99″ | 99.999 | 19.174 | 20.036 | 0.35 | 78 | 6 | 6– 7 | 6 | |||||
| 51 | 10h 3m 18.28s | 68° 44′ 2.24″ | 99.999 | 19.372 | 20.395 | 0.42 | 65 | 7 | 6– 7 | 7 | |||||
| 52 | 10h 3m 18.03s | 68° 43′ 58.78″ | 99.999 | 20.041 | 20.839 | 0.41 | 12 | 11 | 7– 15 | 11 | |||||
| 53 | 10h 3m 21.02s | 68° 44′ 1.76″ | 18.733 | 19.310 | 20.829 | 0.46 | 11 | 12 | 7– 15 | 12 | |||||
| 54 | 10h 3m 17.80s | 68° 43′ 59.93″ | 99.999 | 20.493 | 21.454 | 0.06 | 1 | 21 | 5– 30 | 21 | |||||
| 55 | 10h 3m 18.22s | 68° 44′ 0.06″ | 99.999 | 19.649 | 19.445 | 0.06 | 0 |
| ID | (2000) | (2000) | E(B-V) | Phot. MassaaMass and Age estimates from broad-band photometry. There are no estimates for points which are farther than 5 from the Starburst99 model track. | Mass range | Phot. AgeaaMass and Age estimates from broad-band photometry. There are no estimates for points which are farther than 5 from the Starburst99 model track. | Age rangeaaMass and Age estimates from broad-band photometry. There are no estimates for points which are farther than 5 from the Starburst99 model track. | EW(H) | H AgebbAge estimates from EW(H). There is no estimate when EW(H) is not detected, although these clusters are likely older than 10–20 Myr. | Age rangebbAge estimates from EW(H). There is no estimate when EW(H) is not detected, although these clusters are likely older than 10–20 Myr. | MassccFinal Mass and Age estimates, combining constraints from the broad-band photometry and EW(H). | AgeccFinal Mass and Age estimates, combining constraints from the broad-band photometry and EW(H). | |||
|---|---|---|---|---|---|---|---|---|---|---|---|---|---|---|---|
| (STMAG) | (STMAG) | (STMAG) | (mag) | () | () | Myr | Myr | () | (Myr) | (Myr) | () | (Myr) | |||
| 1 | 13h 39m 56.01s | -31° 38′ 25.05″ | 13.940 | 16.054 | 17.015 | 0.96ddThe E(B-V) estimate for this object was manually adjusted to bring its photometric age estimate into agreement with its EW(H). | 103 | 86– 120 | 1 | 1– 1 | 1981 | 3 | 3– 3 | 118 | 3 |
| 2 | 13h 39m 55.98s | -31° 38′ 31.87″ | 15.800 | 17.152 | 17.641 | 0.06 | 46 | 42– 52 | 10 | 10– 11 | 0 | 46 | 10 | ||
| 3 | 13h 39m 55.53s | -31° 38′ 29.75″ | 16.756 | 17.799 | 17.866 | 0.06 | 58 | 44– 70 | 12 | 11– 14 | 14 | 11 | 10– 12 | 42 | 11 |
| 4 | 13h 39m 55.93s | -31° 38′ 27.48″ | 15.301 | 17.424 | 18.359 | 0.13 | 27 | 26– 27 | 1 | 1– 1 | 505 | 5 | 5– 5 | 27 | 1 |
| 5 | 13h 39m 55.58s | -31° 38′ 29.36″ | 16.551 | 17.431 | 18.029 | 0.06 | 22 | 18– 59 | 8 | 8– 15 | 17 | 10 | 9– 11 | 21 | 8 |
| 6 | 13h 39m 55.87s | -31° 38′ 26.87″ | 15.718 | 17.755 | 18.898 | 0.70ddThe E(B-V) estimate for this object was manually adjusted to bring its photometric age estimate into agreement with its EW(H). | 16 | 13– 83 | 2 | 1– 6 | 884 | 4 | 4– 5 | 20 | 4 |
| 7 | 13h 39m 56.24s | -31° 38′ 28.33″ | 15.771 | 17.267 | 18.676 | 0.65ddThe E(B-V) estimate for this object was manually adjusted to bring its photometric age estimate into agreement with its EW(H). | 17 | 17– 19 | 6 | 4– 6 | 438 | 5 | 5– 5 | 18 | 5 |
| 8 | 13h 39m 55.98s | -31° 38′ 27.99″ | 16.681 | 18.470 | 19.503 | 0.06 | 12 | 6– 12 | 3 | 3– 5 | 324 | 5 | 5– 5 | 13 | 5 |
| 9 | 13h 39m 55.37s | -31° 38′ 33.96″ | 16.667 | 17.928 | 18.458 | 0.06 | 20 | 18– 32 | 10 | 9– 14 | 34 | 8 | 8– 9 | 12 | 8 |
| 10 | 13h 39m 56.08s | -31° 38′ 31.77″ | 17.887 | 19.164 | 19.579 | 0.06 | 8 | 5– 16 | 10 | 9– 15 | 3 | 16 | 13– 22 | 8 | 10 |
| 11 | 13h 39m 55.51s | -31° 38′ 24.52″ | 18.758 | 20.033 | 19.888 | 0.06 | 9 | 5– 10 | 13 | 12– 14 | 61 | 7 | 6– 11 | 5 | 11 |
| 12 | 13h 39m 55.87s | -31° 38′ 33.51″ | 17.599 | 19.652 | 20.495 | 0.06 | 4 | 3– 5 | 1 | 1– 4 | 6 | 14 | 11– 20 | 4 | 1 |
| 13 | 13h 39m 55.94s | -31° 38′ 22.07″ | 18.124 | 19.705 | 20.390 | 0.06 | 4 | 2– 14 | 4 | 4– 28 | 554 | 5 | 5– 5 | 4 | 4 |
| 14 | 13h 39m 55.45s | -31° 38′ 33.69″ | 19.382 | 20.598 | 20.258 | 0.06 | 6 | 4– 6 | 13 | 12– 13 | 242 | 6 | 5– 6 | 4 | 12 |
| 15 | 13h 39m 55.61s | -31° 38′ 32.41″ | 18.407 | 20.326 | 21.319 | 0.06 | 2 | 1– 6 | 3 | 1– 19 | 410 | 5 | 5– 6 | 4 | 5 |
| 16 | 13h 39m 57.58s | -31° 38′ 19.25″ | 18.526 | 19.681 | 20.073 | 0.14 | 5 | 3– 8 | 10 | 9– 14 | 36 | 8 | 8– 8 | 3 | 8 |
| 17 | 13h 39m 55.76s | -31° 38′ 31.69″ | 17.877 | 19.924 | 20.747 | 0.11 | 3 | 2– 3 | 1 | 1– 4 | 1056 | 4 | 3– 5 | 3 | 4 |
| 18 | 13h 39m 55.49s | -31° 38′ 25.40″ | 18.007 | 20.069 | 21.923 | 0.06 | 1 | 1– 2 | 4 | 1– 5 | 296 | 5 | 5– 6 | 2 | 5 |
| 19 | 13h 39m 56.57s | -31° 38′ 22.82″ | 18.156 | 19.556 | 20.758 | 0.06 | 2 | 2– 12 | 5 | 5– 24 | 234 | 6 | 5– 6 | 2 | 6 |
| 20 | 13h 39m 55.92s | -31° 38′ 24.56″ | 17.807 | 19.404 | 99.999 | 0.27 | 1820 | 3 | 3– 3 | 3 | |||||
| 21 | 13h 39m 55.83s | -31° 38′ 27.05″ | 17.048 | 18.593 | 19.371 | 0.13 | 920 | 4 | 3– 5 | 4 | |||||
| 22 | 13h 39m 56.04s | -31° 38′ 38.06″ | 18.215 | 19.917 | 19.764 | 0.13 | 970 | 4 | 4– 4 | 4 | |||||
| 23 | 13h 39m 56.26s | -31° 38′ 26.18″ | 99.999 | 19.008 | 19.225 | 0.06 | 682 | 5 | 4– 5 | 5 | |||||
| 24 | 13h 39m 55.92s | -31° 38′ 27.00″ | 16.581 | 18.971 | 19.609 | 0.19 | 463 | 5 | 5– 5 | 5 | |||||
| 25 | 13h 39m 55.94s | -31° 38′ 28.18″ | 17.116 | 19.077 | 19.562 | 0.06 | 454 | 5 | 5– 5 | 5 | |||||
| 26 | 13h 39m 55.73s | -31° 38′ 30.89″ | 17.499 | 19.472 | 99.999 | 0.06 | 623 | 5 | 3– 6 | 5 | |||||
| 27 | 13h 39m 55.86s | -31° 38′ 38.90″ | 16.895 | 18.515 | 18.927 | 0.06 | 143 | 6 | 6– 6 | 6 | |||||
| 28 | 13h 39m 55.72s | -31° 38′ 38.26″ | 19.209 | 19.368 | 20.490 | 0.06 | 105 | 6 | 6– 7 | 6 | |||||
| 29 | 13h 39m 55.44s | -31° 38′ 29.62″ | 18.492 | 20.309 | 20.025 | 0.06 | 65 | 7 | 7– 7 | 7 | |||||
| 30 | 13h 39m 56.70s | -31° 38′ 19.02″ | 18.943 | 19.766 | 99.999 | 0.06 | 37 | 8 | 7– 9 | 8 | |||||
| 31 | 13h 39m 55.73s | -31° 38′ 16.78″ | 18.505 | 19.112 | 19.286 | 0.14 | 0 | ||||||||
| 32 | 13h 39m 56.01s | -31° 38′ 22.41″ | 18.381 | 19.118 | 19.233 | 0.13 | 0 | ||||||||
| 33 | 13h 39m 55.38s | -31° 38′ 44.11″ | 19.166 | 19.896 | 21.239 | 0.06 | 0 |
| ID | (2000) | (2000) | E(B-V) | Type aa1=star; 2=questionable star/cluster classification; 3=detected in only one filter | |||
|---|---|---|---|---|---|---|---|
| (STMAG) | (STMAG) | (STMAG) | (mag) | ||||
| 1 | 10h 03m 22.74s | 68° 44′ 27.26″ | 21.354 | 17.954 | 17.596 | 0.06 | 1 |
| 2 | 10h 03m 18.25s | 68° 43′ 59.75″ | 18.069 | 19.030 | 19.825 | 0.81 | 2 |
| 3 | 10h 03m 19.12s | 68° 43′ 55.41″ | 18.797 | 19.346 | 20.129 | 0.27 | 1 |
| 4 | 10h 03m 21.37s | 68° 44′ 17.47″ | 18.553 | 19.940 | 21.011 | 0.06 | 1 |
| 5 | 10h 03m 19.64s | 68° 43′ 55.69″ | 18.972 | 20.001 | 21.435 | 0.22 | 1 |
| 6 | 10h 03m 20.37s | 68° 44′ 6.16″ | 18.310 | 20.573 | 22.397 | 0.47 | 2 |
| 7 | 10h 03m 20.55s | 68° 44′ 4.81″ | 20.285 | 20.769 | 21.483 | 0.06 | 1 |
| 8 | 10h 03m 18.61s | 68° 44′ 7.49″ | 20.663 | 20.970 | 21.677 | 0.06 | 1 |
| 9 | 10h 03m 17.58s | 68° 43′ 57.11″ | 20.604 | 20.970 | 24.160 | 0.20 | 2 |
| 10 | 10h 03m 19.05s | 68° 44′ 8.98″ | 20.513 | 21.117 | 22.394 | 0.18 | 1 |
| ID | (2000) | (2000) | E(B-V) | Type aa1=star; 2=questionable star/cluster classification; 3=detected in only one filter | |||
|---|---|---|---|---|---|---|---|
| (STMAG) | (STMAG) | (STMAG) | (mag) | ||||
| 1 | 13h 39m 57.59s | -31° 38′ 12.97″ | 18.766 | 17.760 | 18.033 | 0.06 | 1 |
| 2 | 13h 39m 54.35s | -31° 38′ 34.19″ | 18.424 | 17.781 | 18.330 | 0.06 | 1 |
| 3 | 13h 39m 55.88s | -31° 38′ 27.78″ | 17.099 | 18.329 | 18.799 | 0.12 | 2 |
| 4 | 13h 39m 55.96s | -31° 38′ 38.62″ | 17.653 | 18.569 | 19.446 | 0.06 | 1 |
| 5 | 13h 39m 55.68s | -31° 38′ 28.18″ | 18.880 | 18.751 | 19.922 | 0.06 | 2 |
| 6 | 13h 39m 55.43s | -31° 38′ 27.78″ | 19.217 | 18.778 | 19.702 | 0.06 | 1 |
| 7 | 13h 39m 55.81s | -31° 38′ 34.37″ | 17.940 | 18.821 | 19.765 | 0.11 | 2 |
| 8 | 13h 39m 55.67s | -31° 38′ 37.61″ | 17.270 | 18.836 | 19.672 | 0.06 | 1 |
| 9 | 13h 39m 57.38s | -31° 38′ 22.72″ | 19.178 | 19.077 | 19.895 | 0.06 | 1 |
| 10 | 13h 39m 55.99s | -31° 38′ 11.59″ | 19.288 | 19.118 | 19.941 | 0.06 | 2 |