Mass Segregation in Young Magellanic Clouds Star Clusters: Four Clusters observed with HST.
We present the results of our investigation on the phenomenon of mass segregation in young star clusters in the Magellanic Clouds. HST/WFPC2 observations on NGC 1818, NGC 2004 & NGC 2100 in the Large Magellanic Cloud and NGC 330 in the Small Magellanic Cloud have been used for the application of diagnostic tools for mass segregation: i) the radial density profiles of the clusters for various mass groups and ii) their mass functions (MFs) at various radii around their centres. All four clusters are found to be mass segregated, but each one in a different manner. Specifically not all the clusters in the sample show the same dependence of their density profiles on the selected magnitude range, with NGC 1818 giving evidence of a strong relation and NGC 330 showing only a hint of the phenomenon. NGC 2004 did not show any significant signature of mass segregation in its density profiles either. The MFs radial dependence provides clear proof of the phenomenon for NGC 1818, NGC 2100 and NGC 2004, while for NGC 330 it gives only indications. An investigation of the constraints introduced by the application of both diagnostic tools is presented. We also discuss the problems related to the construction of a reliable MF for a cluster and their impact on the investigation of the phenomenon of mass segregation. We find that the MFs of these clusters as they were constructed with two methods are comparable to Salpeter’s IMF. A discussion is given on the dynamical status of the clusters and a test is applied on the equipartition among several mass groups in them. Both showed that the observed mass segregation in the clusters is of primordial nature.
Key Words.:
galaxies: star clusters – Magellanic Clouds – stars: luminosity function, mass function
1 Introduction
Mass segregation nowadays is a well known phenomenon, which manifests itself as a strong concentration of the heaviest stars towards the centre of the cluster. This phenomenon has been extensively observed during the last decade in a plethora of young open clusters (Jones & Stauffer 1991; Pandey et al. 1992; Shu et al. 1997; Raboud & Mermilliod 1998; Hillenbrand & Hartmann 1998), as well as old globular clusters in the Galaxy (Cote et al. 1991; Pandey et al. 1992; Paresce et al. 1995; King et al. 1995; de Marchi & Paresce 1996; Ferraro et al. 1997; Sosin 1997; Andreuzzi et al. 2000; Howell et al. 2000). Young star clusters in the Magellanic Clouds (MCs) have also recently been investigated for mass segregation (Malumuth & Heap 1994; Brandl et al. 1996; Fischer et al. 1998; Kontizas et al. 1998; Santiago et al. 2001; de Grijs et al. 2002a,b,c; Sirianni et al. 2002). Last, but not least noticeable, is the work by Stolte et al. (2002), who found mass segregation in the Arches cluster, a young, massive star cluster and one of the densest in the Milky Way.
Galactic globulars show mass segregation due to their dynamical evolution, through which equipartition of kinetic energy among different mass groups in the cluster can be achieved. According to Spitzer (1969) this leads to stars of different masses being found in different “layers” with the heavier stars gravitating toward the centre, and thus mass stratification occurs. This phenomenon is mostly known as Dynamical Mass Segregation (for reviews see Lightman & Shapiro 1978; Meylan & Heggie 1997). Earlier studies (King 1966; Da Costa 1982; Bolte & Marleau 1989) showed that low-mass stars predominate the galactic globulars. This implies a time-scale for energy equipartition of the order of the relaxation time of the clusters (the time the system needs to reach a quasi-Maxwellian equilibrium in its interior). For typical globular clusters the relaxation time (at the half-mass radius) is significantly shorter than the cluster age. In consequence, since the cluster had the time to relax, it exhibits dynamical mass segregation.
The discovery of mass segregation in young clusters (see review by Clarke et al. 2000) in the MCs introduced new problems concerning its interpretation, since it can be either the signature of the initial conditions and loci, where massive stars are formed (e.g. Hillenbrand & Hartmann 1998; Bonnell & Davies 1998), or it can be the result – at least partially – of early dynamics (e.g. Malumuth & Heap 1994; Brandl et al. 1996). This phenomenon is usually referred to as Primordial Mass Segregation. Observations and theoretical predictions on the formation of massive stars emphasise the role of early dynamics. An example has been given by Fischer et al. (1998), who suggest that the steepening of the mass function they observed at larger radii from the centre of NGC 2157 is most likely an initial condition of the cluster formation, since interactions among the protostellar cloudlets play a crucial role in the massive-star-forming process.
| Cluster | Age | Metallicity | Met. | |||||
|---|---|---|---|---|---|---|---|---|
| Name | (yr) | ref. | [Fe/H] | ref. | (arcmin) | (L⊙) | (M⊙) | (M⊙ pc-3) |
| NGC 330 | 7.50 | 1,2,3 | 4 | 0.15 0.01 | 5.46 | 4.41 | 1.84 | |
| NGC 2004 | 7.20 | 1,5 | 6 | 0.11 0.01 | 5.37 | 4.27 | 2.32 | |
| NGC 1818 | 7.40 | 1,7 | 0.00 to 0.40 | 7,8 | 0.17 0.01 | 5.11 | 4.01 | 1.55 |
| NGC 2100 | 7.20 | 1,5 | 6 | 0.08 0.01 | 5.46 | 4.31 | 2.64 |
References: (1) Keller et al. (2000); (2) Chiosi et al. (1995); (3) Da Costa & Hatzidimitriou (1998); (4) Hill (1999); (5) Elson (1991); (6) Jasniewicz & Thévenin (1994); (7) de Grijs et al. (2002b); (8) Johnson et al. (2001)
In addition, according to the cluster formation model proposed by Murray & Lin (1996) cloudlets fall toward the central region of the protocluster cloud, and cohesive collisions cause their masses to grow. More massive stars are subject to many dissipative mergers (Larson 1991) and so they are preferably formed in the cluster centre (Bonnell & Davies 1998), leading to an initial mass segregation. Models suggesting enhanced accretion rates, which grow with the mass of the accreting protostar (Behrend & Maeder 2001), or high collision probabilities in dense cluster centres (Bonnell et al. 1998) predict the formation of stars up to 100 M⊙ in the densest central regions of a rich star cluster. Furthermore the total mass and the maximum stellar mass of a cluster strongly depends on the star formation rate and local density (Elmegreen 2001), which is enhanced by gravitational collapse or cloud collisions in high-density environments (Elmegreen 1999, 2001). In conclusion, protoclusters with high central density are more prone to exhibit primordial mass segregation.
We investigate the phenomenon of mass segregation in four young star clusters in the Magellanic Clouds: NGC 1818, NGC 2004 and NGC 2100 in the Large Magellanic Cloud (LMC) and NGC 330 in the Small Magellanic Cloud (SMC) with the use of HST/WFPC2 observations (Keller et al. 2000). These clusters, which are among the younger in the MCs with ages between 10 and 50 Myr, cover a range of metallicities (see Table 1). This study is based on a consistent set of HST observations, which allowed us to search for mass segregation in a uniform manner and to investigate the differences among the clusters concerning the phenomenon. No such investigation seems to be available in the literature except for the case presented by de Grijs et al. (2002a,b,c). In the sample of their clusters these authors include NGC 1818, while Sirianni et al. (2002) recently presented their result on the low-mass IMF and mass segregation in NGC 330. The results of both these studies are based on different data sets than our HST observations on these clusters. Under these circumstances it would be interesting to compare our results, which have been preliminarily presented by Keller et al. (2001) with theirs.
This article is laid out as follows. In Sect. 3 we use our observations to examine the radial density profiles of the clusters and their dependence on the selected magnitude range, as an indication of stellar stratification. Our data were also used in Sect. 4 to derive the mass functions of the clusters and examine their radial dependence, which is a widely used method for the detection of mass segregation. The results of both investigations are given in Sect. 5 and a discussion on the nature of the observed mass segregation concerning its dynamical origin is presented in Sect. 6. Finally, Sect. 7 highlights our conclusions.

2 Observations and Data Reduction
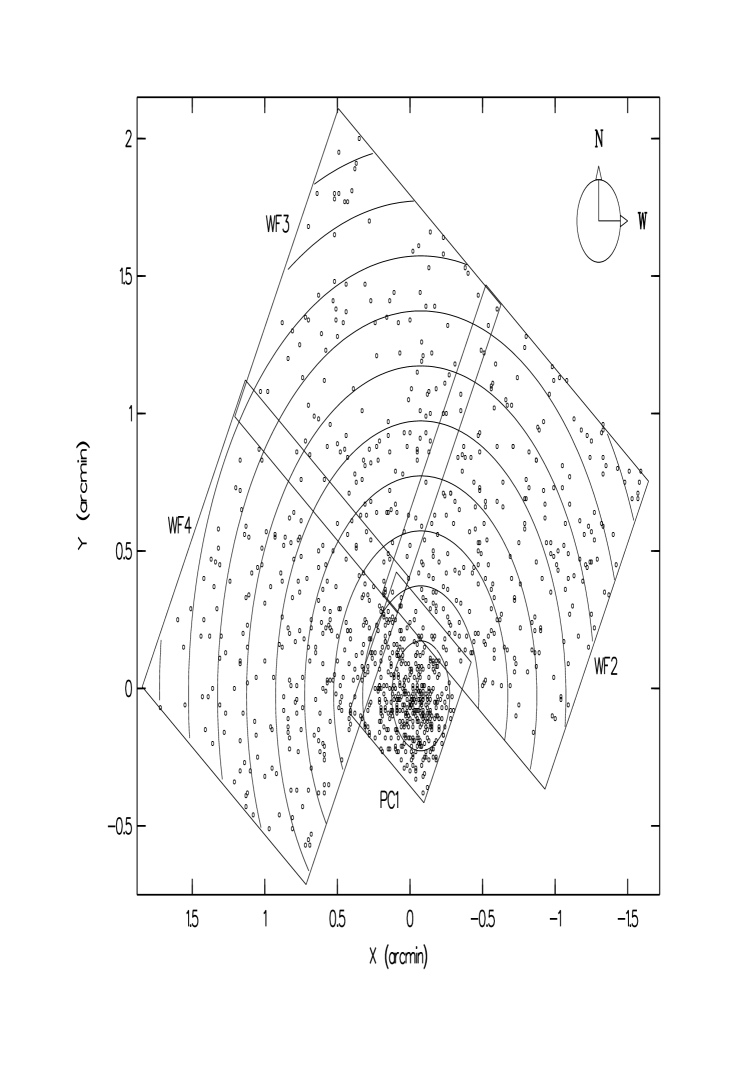
The observations of the clusters have been discussed in Keller et al. (2000), where more details on the photometric reductions are also given, together with the magnitudes and errors for each frame and filter. The raw frames were bias-subtracted and flat-fielded in the usual way using the standard WFPC2 pipeline. For the present study we consider the star counts and luminosity functions derived from the (). In Sect. 4.2 we also use the ( far-) to examine the population on the upper main sequence. An example of the HST/WFPC2 field of view (FOV) of these observations is given in Fig. 1 for NGC 2100.
2.1 Completeness Corrections
We establish a quantitative estimation of the degree of completeness through extensive artificial star tests. A set of 100 artificial stars was generated within each of the four frames of the WFPC2 images for every cluster with a range of magnitudes. In addition, the distribution of objects on the original frame was used to determine the placement of artificial stars within the frame. This was repeated 10 times. A reduction procedure was performed on the enriched frames identical to that performed on the original frames. An artificial star was considered as “recovered” if the recovered image centroid agrees with the actual position to within 1 pixel and if the recovered magnitude is within 0.2 mag of the actual magnitude. The completeness factor is the ratio between the number of artificial stars recovered to the number of stars originally simulated.
Using the above procedure, we have measured the completeness within our F555W frames for various radial distances from the centre of each cluster. Completeness factors are shown in Fig. 2, in which one can see that completeness is a moderate function of radius but mostly a function of magnitude. This is probably because the cluster cores are not excessively crowded at the scale of the WFPC2. We use these factors for the completeness corrections applied to the observational luminosity and mass functions and star counts. It should be noted that only data for which the completeness is better than 70% were actually used in the analysis that follows.
3 Surface Density Profiles of the Clusters
To investigate the variation in the radial density profiles of the clusters for stars of different magnitudes we have performed star counts at selected radial distances and several magnitude slices for each cluster. The surface stellar density is derived as the number of stars per unit area corrected for i) incompleteness as defined in the previous section, and ii) for the field contribution, as shown in the following section.
3.1 Field Star Contamination
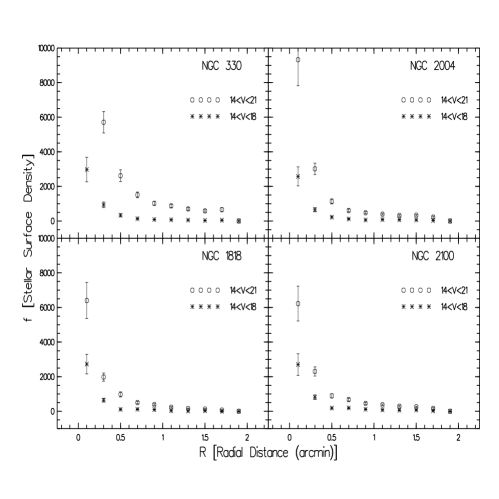
Our observations did not include offset field frames from the purpose of field star subtraction. Thus, in order to estimate the contribution of field stellar density (background density) to the profiles of the clusters we plotted the number of counted stars per unit area (in arcmin2), , corrected for incompleteness at selected radial rings. As is expected, the surface stellar density, , drops as a function of distance, , from the centre of the cluster. This is shown in Fig. 3 of the profiles of all four clusters for stars in two selected magnitude ranges. The density numbers are normalised to the same surface area.
In Fig. 3 it is shown that for all the clusters beyond a radius 15, the number of stars per unit area drops to a uniform level, which might be considered as a good approximation of the background density. Considering that the WFPC2 FOV on our clusters is not wide enough to check if the density profiles are still flat further away than 15, one should expect the value of the background density to be overestimated. We checked the validity of our determination for the field contribution on NGC 1818, for which offset field data exist (Santiago et al. 2001), which we reduced in the same manner. In each magnitude range considered in Fig. 3 we found, within the uncertainties, the same number of field stars with the one found for radial distance 15 in our frames. Furthermore, Vallenari et al. (1994) found that the radius of NGC 330 is about 95′′and Sirianni et al. (2002) assumed that the measured stars in the most external region of their WFPC2 FOV beyond this distance from the centre of the cluster represent an estimate of the background field. This radial distance of 158 is in good agreement with our selected limit of the cluster.
It should be noted that the background density, shown in Fig. 3 for distances larger than 15 from the centre of each cluster, does not seem to differ significantly from one cluster to the other, being very small and representing for both selected magnitude ranges about 1 to 2% of the total population. Mackey & Gilmore (2003a,b) report that their detailed surface profiles of these clusters derived from HST observations, seem to have a maximum extent of 72′′ for NGC 330 and 76′′ for the other three LMC clusters. The two measurements are very close to each other and well below our selected radial limit of 15. All the above gives confidence that we have not significantly overestimated the field population with this technique. Having so defined the contribution of the background () we subtract it from the completeness corrected star counts per unit area () to estimate the corresponding surface stellar density defined now as . All numbers are normalised to the same surface area.
3.2 Density profiles
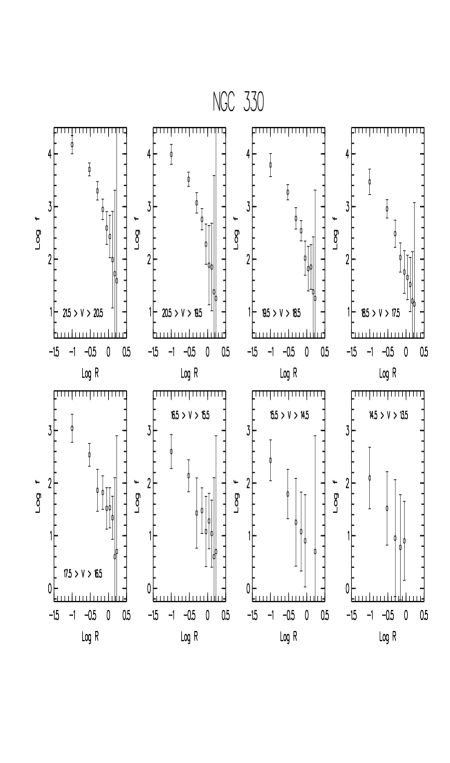
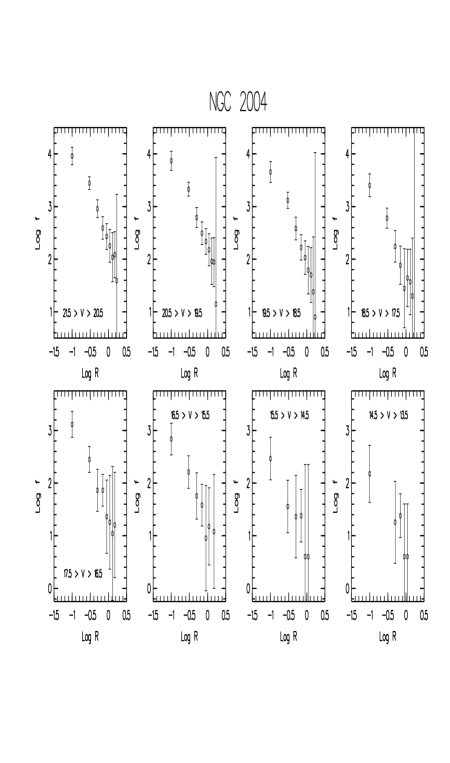
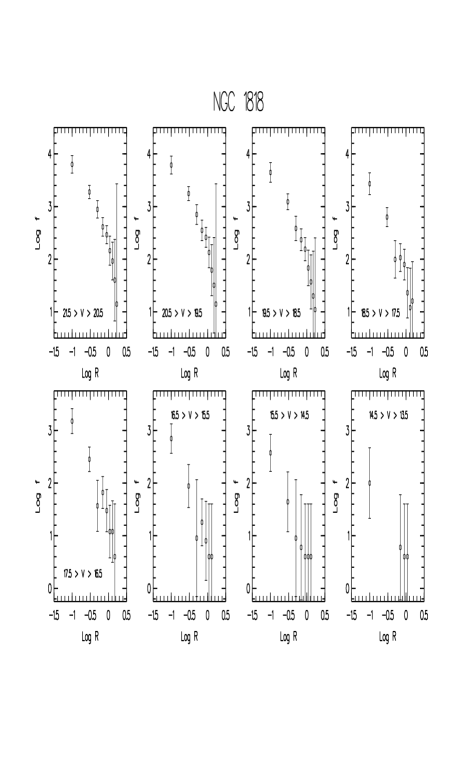
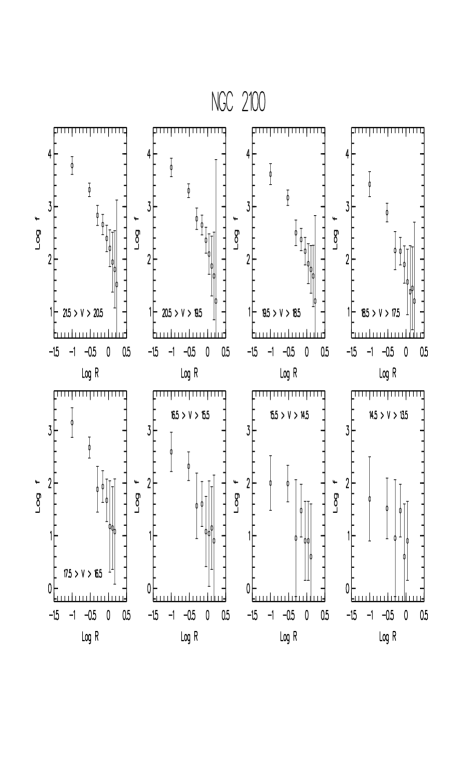
The surface density profiles were derived by counting stars in 8 different magnitude bins (from around 14 to 21 mag) from the F555W observations. The counts were performed in 9 radial annuli around the centres of the clusters, spanning 02 each. The plots of versus for the selected magnitude bins, which almost cover the observed magnitude range (down to the detection limit), are shown in Fig. 4. Taking into account that the density profiles can be approximated by (Elson et al. 1987), the slope is a very good indication of the existence of mass stratification at the magnitude where this slope changes significantly (e.g. Subramaniam et al. 1993). In order to investigate such a relation we estimated the slope of the density profile in each magnitude range by using the data of the rings in which stars were counted except the two outer rings of distances around 15 and 17 from the cluster’s centre each. This was done due to low number statistics at these distances, since the field contribution at these distances is severe.
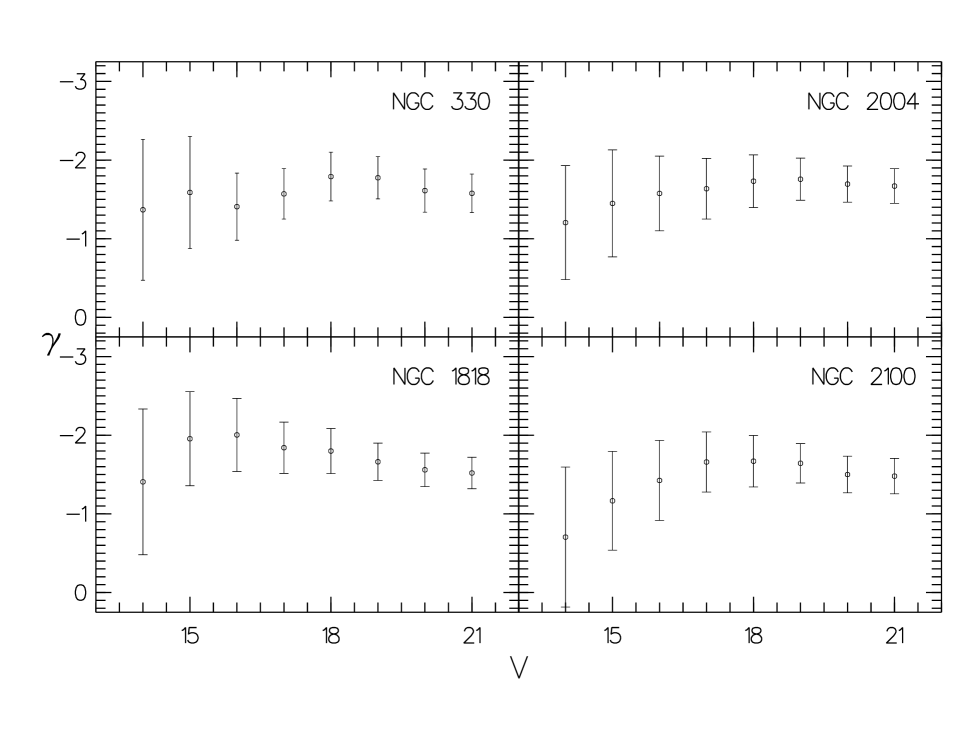
The correlation of the estimated density profile slopes with the corresponding magnitude bin is shown in Fig. 5. The two or three first points of these diagrams, which cover a magnitude range of 14 - 16 mag can be questioned, because of their large errors. For the points corresponding to fainter magnitudes one may see that there are cases where actually depends on the magnitude bin. Such is the case of NGC 1818, which implies that mass stratification is actually taking place in the cluster. The relations versus magnitude shown in Fig. 5 were linearly fitted using the least squares solution for every cluster and the corresponding Spearman correlation coefficients were estimated. This was done using the points in almost all the magnitude ranges (from 15 - 21 mag down to 18 - 21 mag) in order to specify the magnitude range where any significant correlation can be found. The results of these statistical tests are presented in Table 2, where we give the estimated slope of the linear fits and the corresponding probability that the data are indeed correlated, as was estimated from Spearman’s method for all the magnitude ranges used.
From the values of Table 2 it is clear that indeed there is a strong correlation of with magnitude for almost all the magnitude ranges in NGC 1818 (with a slope 0.1). For NGC 330 and NGC 2100 this correlation becomes significant for mag (with slopes 0.08 and 0.07 respectively). In the case of NGC 2100 a significant correlation (with 90% probability) can be considered also for the magnitude range 17 - 21 mag. Finally for NGC 2004 it is found that there is a weak dependency between and magnitude limit, since the most important slope found (for V 18 mag with 80% correlation probability) is very shallow. In consequence, NGC 1818 is expected to exhibit the phenomenon strongly, while NGC 330 and NGC 2100 can be seriously considered as candidates for mass segregation. NGC 2004 according to its surface density profiles cannot be considered as an important candidate.
| mag | linear fit | P | linear fit | P |
|---|---|---|---|---|
| range | slope | (%) | slope | (%) |
| NGC 330 | NGC 2004 | |||
| 15 - 21 | 32 | 68 | ||
| 16 - 21 | 43 | 49 | ||
| 17 - 21 | 0 | 10 | ||
| 18 - 21 | 100 | 80 | ||
| NGC 1818 | NGC 2100 | |||
| 15 - 21 | 96 | 32 | ||
| 16 - 21 | 100 | 9 | ||
| 17 - 21 | 100 | 90 | ||
| 18 - 21 | 100 | 100 | ||
Subramaniam et al. (1993) investigated the magnitude dependence of the slope of the density profiles in the halo regions of five young LMC clusters, NGC 2004 and NGC 2100 being among them. These authors did not find any significant correlation of that kind for these two clusters in their CCD photometry from the 1.54m Danish telescope at ESO. It is worth noting that with our higher resolution observations we were able to detect only a weak correlation of and magnitude range for these clusters, as an indication that they are probably segregated.
In conclusion, the surface density profiles and their dependency on the magnitude bins of counted stars provides the first evidence of mass segregation in clusters, giving an estimation of the magnitude (mass) limits for the segregated stars. NGC 330 and NGC 2004 were found to have segregated stars for 18 mag. The limit for NGC 2100 is 17 mag, while for NGC 1818 is 15 - 16 mag. From the results presented above it seems that the clusters exhibit a different degree of mass segregation as far as the dependence of the density profiles on the selected magnitude ranges is concerned.
In any case this diagnostic tool cannot be considered of high accuracy, due to the large uncertainties in the estimated slopes of the density profiles of the clusters and it is not usually applied in the recent works on mass segregation. We present it here to show that the problem of low accuracy, which was known for ground-based CCD observations (e.g. Kontizas et al. 1998), is also apparent in the case of HST data. On the other hand, a more accurate diagnostic tool for the detection of mass segregation is the analysis of the luminosity and mass function (MF) of the cluster, and it is widely used. Practically it is the only tool available which makes use of photometric observations. We present, thus, our results on its application to our clusters in the following section.

4 Luminosity Functions and Mass Functions of the Clusters
According to this diagnostic, if there is a higher concentration of massive stars toward the centre of the cluster, then mass segregation should be exhibited from a radial variation of its MF slope: The radial MFs of the cluster should become steeper outwards, where less high-mass stars are expected to exist. In consequence, at a certain distance the change of the slope of its mass (or luminosity) function becomes evident if mass segregation occurs. Before we proceed to the construction of the MFs of the clusters we use their LFs and we present a preliminary investigation on their radial dependence (if any) at selected radial distances from the centre of the clusters.
4.1 Luminosity Functions
For the investigation on the LFs of the clusters we focus on the main-sequence (MS) populations of the clusters within three regions: inner (), intermediate () and outer (). To improve the number statistics we use the normalised cumulative LFs. We have corrected our sample for radially variable completeness and field contamination as before. Fig. 6 illustrates the cumulative LFs for the three regions in every cluster. The data set has been truncated at mag at which point the completeness is nowhere less than 80% and field stars contribute no more than 10% to the uncorrected sample. In Fig. 6 a radial variation of the LFs of some of the clusters is apparent for the three selected annuli. In order to quantify these variations we applied the Kolmogorov-Smirnov (KS) test on the data shown in the figure. This statistical test indicates the probability that two distributions are derived from an identical parent distribution, thus it offers a pretty clear indication of the significance of the differences between the LFs at different distances from the centre of each cluster.
We applied the KS test in order to compare the LFs of the clusters in the inner annulus () with those in the intermediate () and outer () annulus. The test showed that the probability of common origin for the LFs in the inner and intermediate regions of NGC 1818 and NGC 2100 is only 2% and 8% respectively. The difference between the LFs in the inner and outer regions of these clusters is even more significant, having a probability of common origin of 1% for NGC 1818 and 0.3% for NGC 2100. The probabilities for NGC 330 and NGC 2004 are totally different. We found that the probability that the LFs of the inner and intermediate regions of NGC 330 have common origin is 69%. This probability for the LFs of the inner and outer regions of NGC 330 is 76%. These numbers are even higher for NGC 2004, equal to 98% for the inner-intermediate LFs and 78% for the inner-outer LFs of the cluster.
These results suggest that the LFs of the clusters NGC 1818 and NGC 2100 give clear evidence of the phenomenon of mass segregation, while NGC 330 and NGC 2004 show only indications of it. It should be noted though, that the LFs of the clusters were used here only as indicative diagnostic for any luminosity stratification in selected radii around the centres of the clusters. In the following section we construct the MFs and investigate the radial variation of their slopes systematically for the clusters in a more thorough manner. We use our results on the MFs along with the ones of this section on the LFs in order to demonstrate the sensitivity of any conclusion concerning mass segregation to the selected annuli around the centre of the cluster.
4.2 Mass Functions
The distribution of stellar masses formed in a given volume of space in a stellar system, known as Mass Function, can be represented by the Initial Mass Function (IMF) assuming that all stars in the system are the product of a single star formation event. This approximation is valid for young star clusters in the MCs, such as the clusters of our sample. There are various parametrisations of the IMF (see e.g. Kroupa 2002). A widely used one was proposed by Scalo (1986), where the IMF is characterised by the logarithmic derivative , called index:
| (1) |
where is the IMF. is its slope and can be derived from the linear relation of and . It is a common practice to use as a reference value the index as found by Salpeter (1955) for the solar neighbourhood (, for a mass range 0.4 /M⊙ 10). The MF of a system is constructed by counting stars in mass intervals. This can be achieved by two methods: The first method by directly counting stars between evolutionary tracks according to their positions in the HRD (e.g. Massey et al. 1995) and the second method by translating their luminosities into masses using mass-luminosity relations (e.g. de Grijs et al. 2002b) and then constructing the distribution of the derived masses.
From here on we will refer to these methods as and counting respectively. It is certain that the is more accurate concerning the mass bins where the observed stars are going to be distributed. This is because no direct transformation of luminosities to masses is required, but the construction of the MF is more straightforward, since it is made by counting stars according to their observed absolute magnitudes and colours (corrected for reddening). For the there is a definite dependence on the isochrone models used for the transformation of luminosities to masses. De Grijs et al. (2002b) argue that the conversion of an observed LF to its associated MF is not as straightforward as is often assumed. Thus in order to achieve a reliable conversion, one needs to have accurate knowledge of the appropriate mass-luminosity relation.
In addition, problems occur if there is an age distribution among the stars in the cluster and so the use of a single isochrone may not be adequate for a mass-luminosity conversion. De Grijs et al. note that small differences between MF slopes as a function of age are appreciable for younger stellar populations. Stolte et al. (2002) found that the use of isochrones for older stellar populations will result in flatter MFs. Still, the main-sequence mass-luminosity relation from isochrones of different age should be almost the same. What would be of concern is how strong the impact of different turn-off points would be on the MF slope. In any case, since these differences are systematic, they should not be expected to alter any radial dependence of the cluster MF.
As far as the is concerned, there is also a dependence on the theoretical models, but one achieves smaller uncertainty by using information on both magnitudes and colours. Furthermore, the use of evolutionary tracks, between which the stars can be directly counted on the HRD becomes even more straightforward if one is interested only in the MS stars (as is the case here), since the evolutionary tracks on the MS are more or less parallel to each other for stars of different masses, and so finding the distribution of stars in mass bins is rather simple. Still, there is a constraint in applying this method, since one has to use only the stars detected in both wavebands, and thus a smaller stellar sample for the construction of the MF. The problem becomes important due to the filters of our HST observations, and , which correspond to standard and far- respectively, because our short exposures give a small sample of stars found in both filters and they allow us to report results only on the upper main-sequence MFs of the clusters.
In consequence, in order to compare our results on the MF with different methods, and to have a better statistical significance for the investigation of the phenomenon of mass segregation in our clusters we also applied the for the construction of their overall and radial MFs. For the we used the evolutionary tracks by Schaerer et al. (1993) for the metallicity of the LMC clusters (Z=0.008) and by Charbonnel et al. (1993) for NGC 330 (Z=0.004). In both sets of grids mass loss and moderate core overshooting are taken into account. We compared these evolutionary tracks on the HRD with the isochrones used by Keller et al. (2000) from Bertelli et al. (1994) for the estimation of the ages of the clusters and we found an excellent agreement on the main sequence.
For the , the LFs of the clusters were used to determine the MFs adopting a mass-luminosity relation derived from the used theoretical models. In both cases we selected the MS stars, which were counted in logarithmic (base ten) mass intervals. The counted numbers were corrected for incompleteness and were field-subtracted. We assumed, as in Sect. 3, that the field population is well represented by the stars with radial distances larger than about 15. Finally, the counted numbers were normalised to a surface of 1 kpc2. The errors in the derived MFs reflect the Poisson statistics of the counting process and they are suitably corrected and normalised.
We compared the MF slopes derived with both methods, and it was found that they do not differ considerably, as is shown in Fig. 7, where we present the MFs of the clusters throughout the observed areas (overall MFs). The differences shown in the MFs toward the low-mass end are due to the smaller stellar sample with available magnitudes in both F555W and F160BW used for the . We also checked the MF slopes derived with both methods for selected annuli around the centres of the clusters and we found that these differences are becoming more significant, possibly because of fewer stars counted within the annuli in both cases. Still, if there was a radial dependence of , it was apparent for the MFs constructed with both methods. Thus the two counting methods seem equally adequate for the investigation of mass segregation. For the study of the radial MFs of the clusters, though, we used the slopes derived with the , because of better statistics.
4.2.1 Mass Functions of the clusters
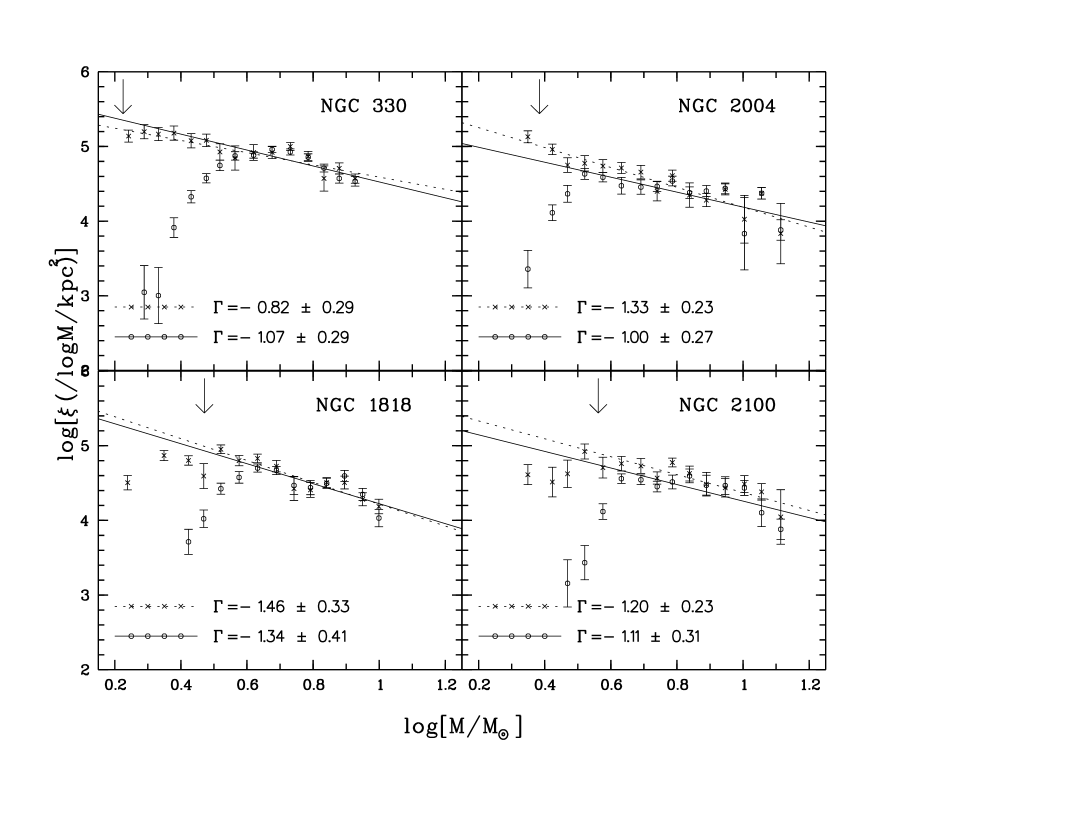
The overall MFs of the clusters are shown in Fig. 7. These MFs give an upper mass limit, which is similar for both counting methods. Massive stars up to 14 M⊙ were found in NGC 2004 and NGC 2100, while for NGC 330 and NGC 1818 the largest observed masses are 9 M⊙ and 11 M⊙ respectively. As far as the low-mass end is concerned, though the MFs are corrected for incompleteness we could not use the entire mass range for the estimation of their slopes due to bad statistics toward the lower mass bins, because of the high detection limit of our observations. This “incompleteness” toward the low-mass end seems to be connected to the total observed populations of the clusters and to the stellar samples used in every counting method for the derivation of the MFs. For example the most complete samples are the ones for NGC 330 and NGC 2004, which are the most populous clusters in the sample. We therefore calculated the MF slopes by selecting mass ranges that comprise stars with masses down to the most complete limit for both methods used. This mass limit corresponds to M⊙ for NGC 330 and NGC 2004 and to M⊙ for NGC 1818 and NGC 2100.
Fig. 7 shows that the MFs may not be single-power law distributions. This is more obvious for NGC 330 and NGC 1818, where it seems that the overall MFs of these clusters can be separated in at least two mass groups following different trends. Still, the use of a single-power law (linear fit) for an estimation of the MF index is a common practice, which we also follow for two reasons: (1) to be able to compare our results with previously published ones and (2) to identify more easily any radial dependence of the MFs. The MF slopes as calculated using the least-square linear method for the selected mass ranges are overplotted in Fig. 7 with solid lines for the MFs constructed with the and with dashed lines for those constructed with the . The fits are not weighted. From the estimated slopes, which are also given in Fig. 7, one can see that NGC 1818 exhibits the steeper MF, while NGC 330 is seen to have the flattest MF in the sample. If we consider the slopes as found with either method for the MF construction and their uncertainties, all clusters seem to have MF slopes around Salpeter’s value, with those of NGC 1818 and NGC 2004 being closer to it.
4.2.2 Radial Mass Functions of the clusters
In order to check any radial dependence of the MF slope, as indication of mass segregation, we constructed the MFs of the clusters in several selected annuli around the centre of the clusters. For this investigation we use the slopes of the radial MFs, as they were constructed only with the , since the was found inadequate for the construction of the radial MFs due to poor stellar numbers. For the inner area of each cluster we selected four annuli spanning 01 each, while for distances larger than 04 we used annuli 02 wide. To check for any variability in the derived radial dependence of the estimated slopes for different selected radial distances, we estimated the MF slopes of the clusters also in thinner annuli. It was found that the observed MF radial dependence is rather sensitive to the radial distances of the annuli selected. This can also be demonstrated by the LFs of NGC 330 and NGC 2004 (Sect. 4.1), since for three selected annuli around their centres no mass segregation was observed, while the shape of their MFs in different annuli is totally different, especially for NGC 2004, as is shown in detail below. Thus, one may conclude that a unique set of selected annuli with widths increasing outwards cannot be chosen as easily as it seems.
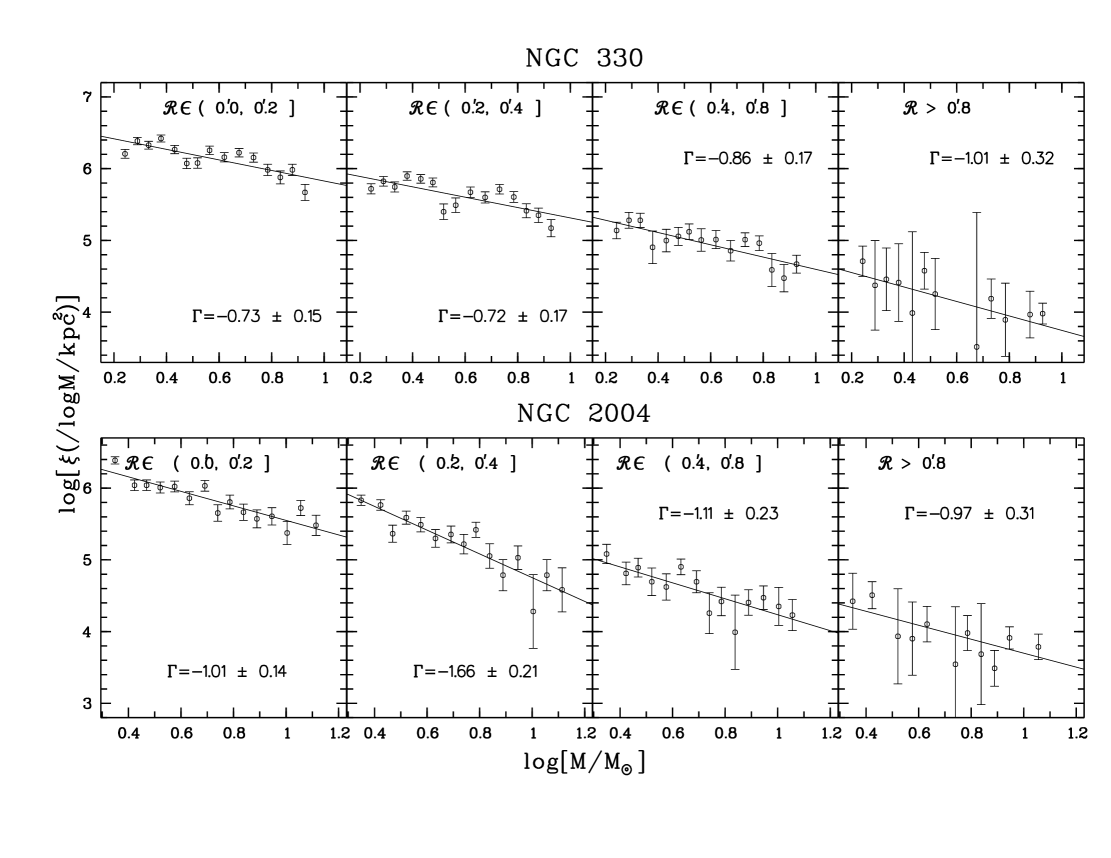
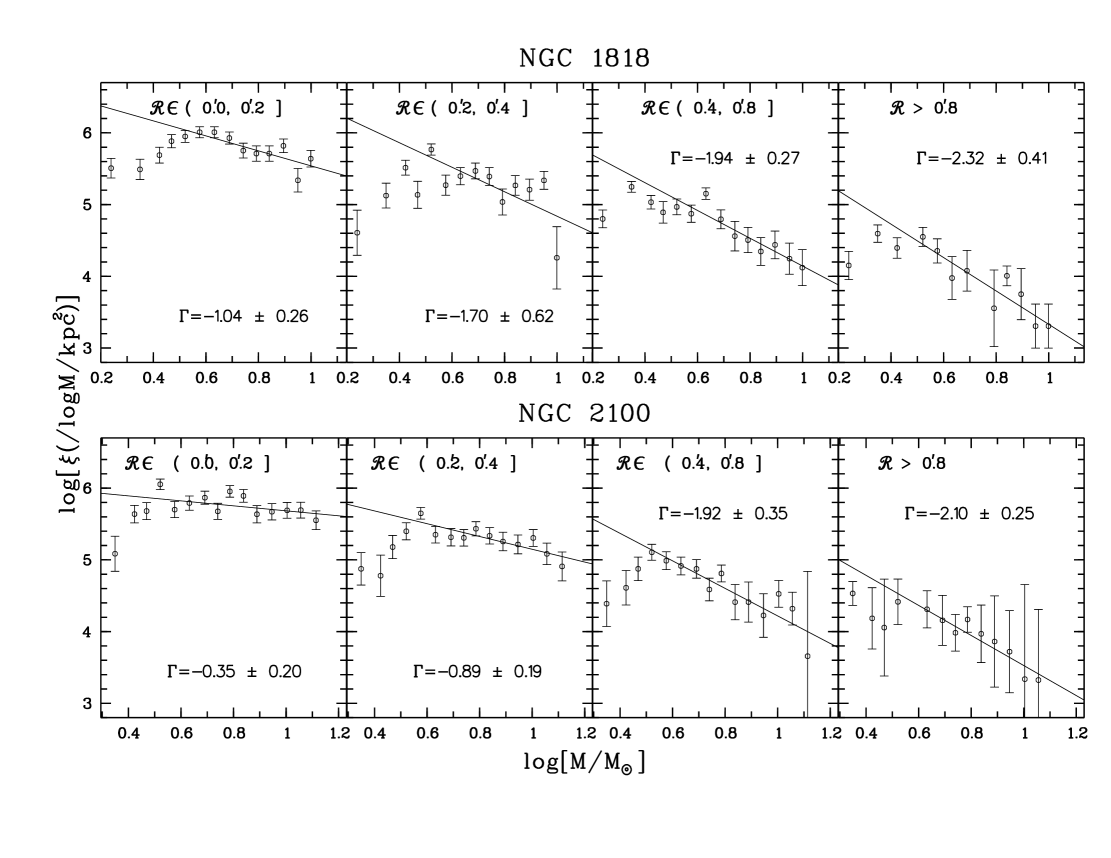
As an example we present the radial MFs of the clusters in Fig. 8 for four selected annuli (00 - 02, 02 - 04, 04 - 08 and larger than 08). Each of these MFs was corrected for incompleteness in the corresponding annulus. The changes of the MF slopes of NGC 330 and NGC 2004 cannot be attributed to any mass segregation, for NGC 330 due to the very small changes of and for NGC 2004 because the slope does not show any trend. On the contrary, NGC 1818 and NGC 2100, as is shown from their MF slopes for the same annuli, are found to be mass-segregated (also Fig. 8). We attempted to check the MF slopes in a variety of rings around the centre of each cluster in order to verify how much our results would be affected by a different choice of the annuli. The results are shown in Fig. 9, where the radial MF slopes for various annuli are plotted to the corresponding mean radial distance of each annulus. Specifically we selected annuli spanning widths from 005 for the inner ones to 04 outwards. The horizontal “error” bars in Fig. 9 represent this width for every ring. These bars, as is shown, are overlapping each other. This is because to estimate the slope of the radial MF for each cluster we selected not only annuli with different widths, but also at various distances from the centre of the cluster. The selection of these annuli was random and subject to one only criterion: Thinner annuli were selected toward the inner areas of the clusters and wider outwards.
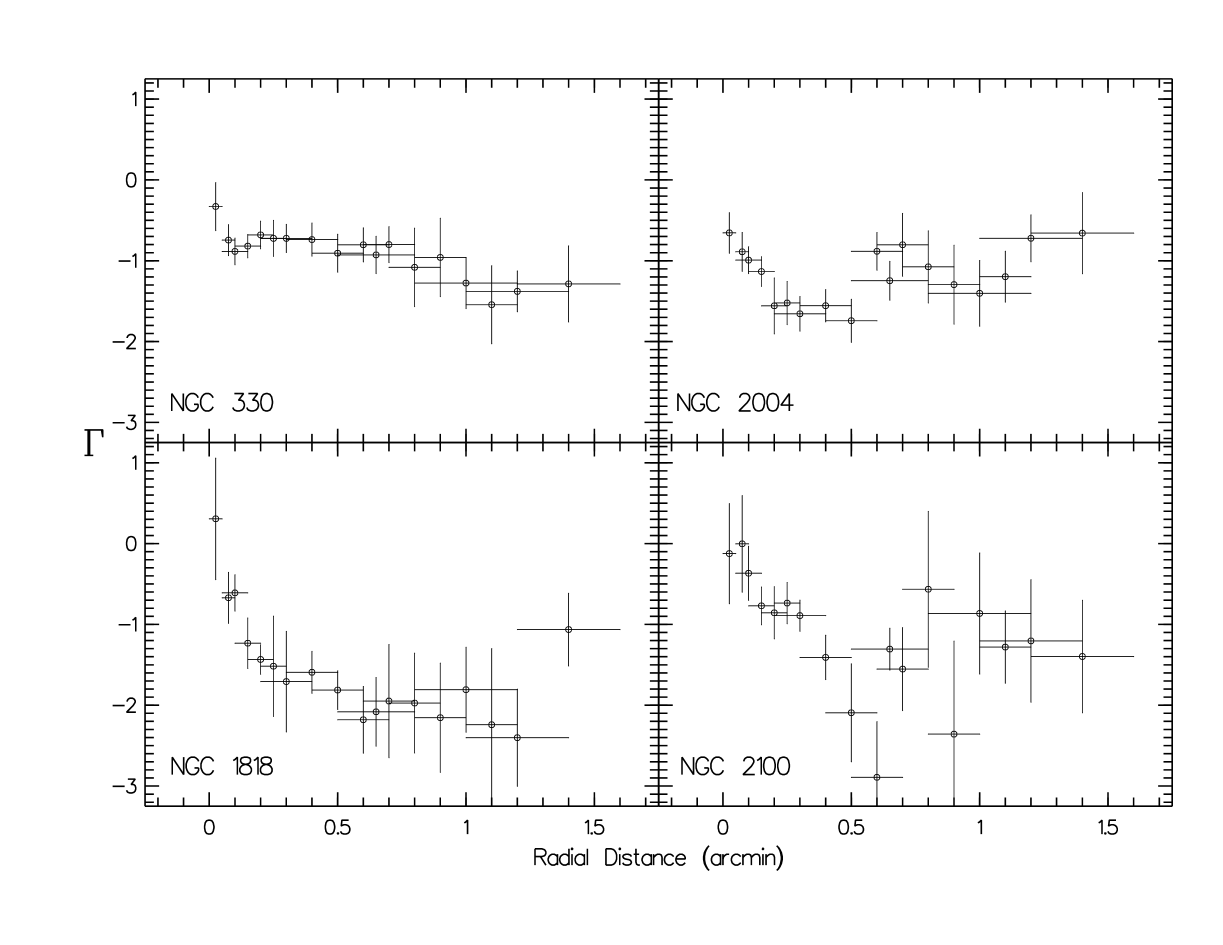
From the results in Fig. 9 one may conclude that all four clusters in the sample seem to be mass-segregated, but in a different degree and out to different radial distances (we call the radius within which an important relation between MF slope and distance can be seen the “radius of segregation”). For NGC 1818 and NGC 2004 one may see that there is a definite trend of the MF slope to steeper values up to about 06 and 04 respectively. The situation for NGC 330 is more complicated since one may see a shallow trend of the MF slope up to about 05, which implies that there may be indeed a radial dependence of the MF slope, which however seems to be very weak. On the other hand this trend can be considered to exist up to the observed limits of the cluster (see Sect. 4.2.3 below). For NGC 2100 the very noisy MF slopes outwards cannot help us define a specific radius of mass segregation for the whole of the cluster, except for the inner area. One, thus, could argue that this cluster is mass-segregated throughout its observed extent. We constructed the cumulative radial MFs of the cluster and we verified this argument from the radial dependence of their slopes, where also a small but steep radial dependence of the MF slope very close to its centre (within 02) was found (also faintly observed in Fig. 9).
In conclusion, as was found from the radial dependence of their MFs, NGC 1818, NGC 2004 and NGC 2100 are indeed mass-segregated. Specifically for NGC 2100, there is a question whether the steep radial dependence of its MF in the inner 02 observed in Fig. 9 can be attributed to a central mass segregation or not. The dependence of the MF of NGC 330 which can be seen in these figures for distances up to 05 can be questioned, due to the large errors of the MF slopes. Still, the indications presented so far from the radial MFs of these clusters are convincing that all the clusters in our sample are (to different extents) mass-segregated, so from here on we treat all of them as such. We applied the same tests to the slopes of the radial cumulative MFs (where the statistics are much better) and we were able to verify the observed mass segregation also from these slopes for all clusters.
4.2.3 Comparison with previous results on the MF
NGC 330
Chiosi et al. (1995) investigated the IMF of NGC 330 as it is constructed from its LF in connection to the selection of models concerning the mixing procedures taking place in the interior of massive stars. For a mass range the MF slope was found to be around the Salpeter value for two of the three models (semiconvective and full overshoot), while it was found to be flatter and equal to assuming the diffuse overshoot model for the mixing in the interior of massive stars. This value is very close to the MF slopes found by us for this cluster in a narrower mass range (3 9).
Concerning mass segregation in this cluster, Sirianni et al. (2002) who present an extensive work on the low-mass end of the IMF of NGC 330 report that the cluster is indeed segregated, since for stars more massive than 1 M⊙ the slope of the MFs measured at different radial distances show a monotonic increase with increasing distance from the centre of the cluster. We compared the relation of the MF slope to the radial distance found by us with the corresponding relation by these authors (their Fig. 8) and we found that indeed there is a similar trend of the slope to steeper values outwards, which is, though, very shallow. It should be noted that the MF slopes as were found by Sirianni et al. (2002) are systematically steeper than ours by a small fraction, probably due to the different lower mass range used by these authors (1 - 6 M⊙).
NGC 1818
This cluster may be one of the best observed in the LMC. Hunter et al. (1997) report an overall MF slope of for a mass range between 0.85 and 9 M⊙, flatter than the MF of the cluster as was found by us toward larger masses (4 - 11 M⊙). The same authors found that the MF in the core of the cluster is slightly flatter (). The MF slopes found by Hunter et al. are steeper than the one previously found by Will et al. (1995) for 2 /M⊙ 8, to be . More recently de Grijs et al. (2002b) presented the case of mass segregation in NGC 1818 observed with HST and they report that Hunter et al. (1997), as well as Santiago et al. (2001) found systematically flatter MF slopes than they did, probably due to the combination of different mass-luminosity relations and a different treatment of the background stellar population.
De Grijs et al. (2002b), in their investigation of the phenomenon of mass segregation, applied a range of mass-luminosity relations (ML conversions) to their observations for the construction of the MF of the cluster. We compared our overall MF of NGC 1818 with the MFs of the cluster for the three ML conversions used by these authors (their Fig. 4) and we found that our MF for the mass range 3 /M⊙ 11 falls between de Grijs et al. MFs for two of the three empirical conversions used: The one by Kroupa et al. (1993) and the one by Tout et al. (1996), our MF being closer to the latter for both methods used for its construction. In general our results are in good agreement with those of de Grijs et al., with the MFs in both studies being steeper than those previously reported. Our results are also in line with de Grijs et al. concerning the phenomenon of mass segregation in NGC 1818 (see Sect. 5), where they report that mass segregation becomes significant for masses 2.5 M⊙, out to at least 20′′- 30′′. They note that the observed mass segregation is of primordial nature.
NGC 2004 & NGC 2100
These clusters have been the target of various investigations concerning their young stellar content (for references see PhD Thesis by Grebel 1996 and Keller 2001). Still, no published results on their MFs are available in the literature except for one case: A complete set of ground-based CCD observations on five LMC clusters was presented by Sagar et al. (1991). This set was used by Sagar & Richtler (1991) for the determination of the MF of these clusters, NGC 2004 and NGC 2100 being among them. It was found that the MF slope of NGC 2004 for a mass range of 2 to 14 M⊙ is around , between the two values of our observed MF slopes (Fig. 7) for a similar mass range (3 - 14 M⊙). For the same mass range these authors found a flatter, but less reliable MF slope for NGC 2100 (). Indeed this slope is much flatter than the one found by us (between and ).
Richtler et al. (1998) presented their preliminary results on the case of mass segregation in NGC 2004 with the use of HST/WFPC2 observations. They checked the MF radial dependence at only two selected radii from the centre of the cluster and they found that for the mass interval the MF slope indeed changes significantly. Considering that we checked the MF radial dependence of the cluster for more annuli using different HST data, it is interesting to note that this result is in agreement with ours. Richtler et al. (1998) found that NGC 2004 is too young to be relaxed by two-body encounters, and thus they conclude that the observed mass segregation is primordial.
5 Results on Mass Segregation
Since all clusters are found to be segregated (each to a different degree) it would be useful to present some conclusive results on the phenomenon as it was exhibited in every cluster, by combining the results of the previous section (Sect 4.2) with those derived from the density profiles and their dependence on the magnitude range (Sect. 3.2).
For NGC 330 it was found from star counts that within a radius of 05, which might represent the radius of segregation (Sect. 4.2), a significant fraction of stars have masses around 4 M⊙. In addition, it is shown in Fig. 5 that a significant change in the relation of the slope of the density profile with the magnitude range appears around 18 - 19 mag, which corresponds to 5.4 - 3.7 M⊙. Still, the density profile dependence of this cluster on the corresponding magnitude range was not easily detected and it seems to be rather weak. This also goes for the radial dependence of the MF slope of the cluster, which gave us a rather uncertain radius of segregation. The best segregated mass group for NGC 2004 seems to be also around 4 M⊙, within 04 of the cluster, as was found from the radial dependence of its MF slope. This mass limit seems to be also in line with the results of Fig. 5, where we see that mass segregation occurs at about V 18 - 19 mag (5.5 - 3.7 M⊙). Still, this mass limit was not so easily identifiable from the dependence of the density profiles on the selected magnitude (mass) range, since this dependence is also faint for NGC 2004.
Concerning NGC 1818 it seems that this cluster shows stronger evidence of mass segregation down to 3 M⊙ (V mag) and 6 M⊙ (V mag), confined within about 06 (as was found from the MF slope radial dependence of Fig. 9). We also checked the differences between the regions inside and outside the core radius of the cluster ( 02 - Table 1), where a central radial dependence of its MF slope can also be observed (Fig. 9) and we found that most of the stars with mass 10 M⊙ are confined within this radial distance. All these results seem to be in line with those on the magnitude dependence of the surface density profile slope, as is shown in Sect. 3.2, where we observed an almost continuous correlation between these parameters for NGC 1818.
This dependence for NGC 2100 was found to be in general faint with a significant change for stars more massive than about 9 - 7 M⊙ ( 17 - 18 mag) (see Sect. 3.2). In addition, no specific radial cut-off was found for the observed mass segregation, meaning that the cluster is probably segregated throughout its extent (Sect. 4.2). Still, a short but steep radial dependence of its MF was observed in the inner 02 (Fig. 9), and we found from star counts that the most massive stars in the cluster ( 13 M⊙) are located within this radius.
5.1 Binaries in Star Clusters
Before exploring the primordial and/or dynamical mechanisms and their possibilities of dominating the phenomenon of mass segregation we must not exclude the contribution of binaries as a possible factor giving rise to a false interpretation.
Binaries are known to exist in clusters and to dominate the first dynamical period of their life. Still, binarity in studies of this kind is usually not considered and if one includes the presence of binaries in the MF construction then the MF slope becomes steeper (Kroupa 2000). Keller et al. (2000) address the issue of the widening of the main sequence of the clusters and they suggest the presence of binaries as a possible explanation. They used near-infrared photometry of these clusters by Keller (1999) in order to examine the () and (F160BW F555W) colours and they revealed a number of systems that consist of a binary pair of red supergiant and MS stars. They stressed the presence of such systems in NGC 330 and NGC 1818.
Elson et al. (1998) investigated the binary populations in NGC 1818 and they found that the full range of initial binary separations expected in the cluster includes values up to 20 103 AU and that resolved binaries with separations 5 103 AU would not survive in the core of the cluster to the present time. They also found that there is no large population of resolved binaries in the outer parts of the cluster. The limiting boundary between stars in soft and those in hard binaries in the Elson et al. sample is 500 to 1000 AU. The same authors estimated from an examination of the lower MS a binary fraction of around 20 - 30% for the outer parts of the cluster and its core respectively. If the binary fraction possesses a radial dependence then this introduces a radial dependence on the luminosity function and it would shift the LFs in Fig. 6 to lower . However, we have determined from simulations that in order to account in this way for the displacement seen in Fig. 6 for NGC 1818 a difference in binary fraction between the inner and outer zones of the order of 50% would be required. Furthermore the sense of the difference would have to be such that the binaries preferentially inhabit the cluster core. This should not be the case, since it is theoretically shown that the binary frequency can be reduced through stellar encounters in clusters and that the final binary frequency depends on the stellar density in the cluster (Kroupa 1995). Dense environments, such as those in the clusters of our sample, favour collisions and consequently there is a higher probability for binary destruction to occur (Bonnell 1999). Recent models predict that binary dissociation will take place in clusters denser than 103 stars pc-3 in time-scales shorter than 1 Myr destroying 50% of binaries wider than 100 AU (Bonnell 2000). Under these circumstances, binarity should not modify any of our conclusions significantly.
| Assumed MF slope unchanged down to 0.1 M⊙ | Assumed MF slope unchanged down to 2.0 M⊙ | ||||||||
| and flat for 2.0 0.1 | |||||||||
| Cluster | |||||||||
| Name | (′) | () | ( M⊙) | (Myr) | (M⊙ pc-3) | () | ( M⊙) | (Myr) | (M⊙ pc-3) |
| NGC 330 | 0.15 | 145.1 0.4 | 29.4 0.1 | 80 1 | 2.71 0.01 | 0.41 0.02 | 1.6 0.1 | 40 1 | 1.44 0.05 |
| NGC 2004 | 0.11 | 5.9 0.1 | 2.5 0.1 | 22 1 | 2.04 0.03 | 0.15 0.01 | 0.7 0.1 | 22 1 | 1.50 0.09 |
| NGC 1818 | 0.17 | 196.2 0.4 | 40.6 0.2 | 94 1 | 2.68 0.00 | 0.58 0.02 | 2.0 0.1 | 43 1 | 1.38 0.05 |
| NGC 2100 | 0.08 | 2.7 0.1 | 1.4 0.1 | 12 1 | 2.19 0.05 | 0.10 0.01 | 0.6 0.1 | 15 1 | 1.82 0.11 |
| (′) | () | ( M⊙) | (Myr) | (M⊙ pc-3) | () | ( M⊙) | (Myr) | (M⊙ pc-3) | |
| NGC 330 | 0.26 | 1743.2 1.3 | 290.7 0.3 | 356 1 | 2.98 0.00 | 0.84 0.03 | 3.2 0.1 | 87 2 | 1.03 0.04 |
| NGC 2004 | 0.22 | 11.0 0.1 | 5.4 0.1 | 52 1 | 1.47 0.02 | 0.48 0.02 | 2.1 0.1 | 52 2 | 1.06 0.05 |
| NGC 1818 | 0.27 | 97.4 0.3 | 24.9 0.1 | 124 1 | 1.87 0.01 | 0.78 0.03 | 2.8 0.1 | 77 2 | 0.92 0.04 |
| NGC 2100 | 0.25 | 9.5 0.1 | 6.0 0.1 | 64 1 | 1.35 0.02 | 0.61 0.02 | 2.8 0.1 | 65 2 | 1.02 0.05 |
‡ The values of that were found are (in M⊙) 0.98, 1.23, 1.09 and 1.23 for NGC 330, NGC 2004, NGC 1818 and NGC 2100 respectively.
† From Mackey & Gilmore (2003a,b)
6 Discussion
6.1 Relaxation Times of the Clusters
As we discussed in Sect. 1, the observed mass segregation could have either a dynamical or primordial basis. Dynamical evolution is known to be achieved through two-body encounters and consequently its extent is related to the age of the stellar population. The characteristic time-scales involved in the relaxation of the system are: Its crossing time (), which is the time needed by a star to move across the system, and its two-body relaxation time (), which is the time needed by the stellar encounters to redistribute their energies, setting to a near-Maxwellian velocity distribution. The latter timescale is extremely significant in the case of mass segregation, because one may test if it is of dynamical origin (when the evolution time of the system, , is longer than ) or not. The relaxation time of a cluster can be characterised by its “Median Relaxation Time”, i.e. the time after which gravitational encounters of stars have caused the system to equilibrate to a state independent of the original stellar orbits; it can be expressed as (Binney & Tremaine 1987):
| (2) |
where is the total mass of the system within some characteristic radius , is a characteristic stellar mass (the median of the observed mass distribution) and is the corresponding total number of stars of the system. A characteristic radius of a stellar system is its half-mass radius () and one can use this radius in Eq. (2) to estimate the “Half-mass Relaxation Time” of the system (e.g. Portegies Zwart et al. 2002). We also estimated the relaxation time of the systems within their core radii (). In order to derive the median relaxation time we need to have an estimation of the characteristic radii above, as well as the total mass of the system within these radii and the corresponding characteristic masses and total number of stars .
Mackey & Gilmore (2003a,b) recently published surface brightness profiles for a sample of 53 LMC and 10 SMC rich star clusters, and they derived structural parameters for each cluster using their detailed profiles made with the use of two-colour observations from HST. Their results thus consist of a coherent sample of parametric values for the dynamical properties of clusters in the MCs (see Table 1). These values were estimated by the fit of the model introduced by Elson et al. (1987) to their surface brightness profiles. All the clusters of our sample are included in the catalog of Mackey & Gilmore, so we can use the core radii for our clusters as they were estimated by these authors.
We estimated the radius where half of the observed total mass (corrected for incompleteness and field contamination) of the clusters is confined. We refer to this radius as the observed half-mass radius. If we assume that the low-mass stars are uniformly distributed over the area covered by each cluster, then the radius where half of the total mass is included should not be far from this estimated value. The values of and the observed are given in the second column of Table 3.
The total number of stars , the corresponding total mass and the characteristic mass within the core and half-mass radius of each cluster can be evaluated by their MFs. The main uncertainty is the low end of the mass function which is not known because of the detection limit. In principle there is no reason to believe that the MFs of the clusters in our sample have different low-mass cut-offs. In addition this lower mass limit, is very difficult to constrain, especially for distant and dense clusters like those of our sample, so we can only make some reasonable guess. Brandl et al. (1999) using observations from ANTU/ISAAC have revealed that in the starburst region NGC 3603 of our galaxy there are many of sub-solar mass stars down to 0.1 M⊙. According to these authors this result agrees with studies in the solar neighbourhood, which also indicate that 0.1 M⊙. Based on these results we extrapolated the observed MFs of the clusters down to this mass limit.
Since the clusters were found to be mass segregated, meaning that their MFs have different slopes within different radial distances, we did not extrapolate the overall MFs but separately the MF within and the one within the observed , using in every case the corresponding slope, which is assumed to be the one derived from the most complete observed low-mass bins, because, as we already noted in Sect. 4.2, the MFs may not be represented in total by a single power-law due to the change of their slopes toward different end masses (see Figs. 7 and 8). The next question is if the MF follows the same slope down to the limit of 0.1 M⊙. First, the extrapolations mentioned above were done assuming that indeed the low-mass MF slope down to 0.1 M⊙ is the same as the MF slope of the more massive stars. Sirianni et al. (2000) constructed the IMF of R 136 with the use of deep broadband and HST/WFPC2 observations and they report that, after correcting for incompleteness, the IMF shows a definite flattening below 2 M⊙. Thus, we also took these results into consideration.
Therefore, in order to estimate the total mass of the clusters we extrapolated their observed MFs, as they were constructed within both their core and half-mass radii, under two assumptions: i) That the MF slope remains unchanged down to 0.1 and ii) that this slope remains unchanged down to 2.0 , but becomes flat for masses down to 0.1 . The results of the estimations above are given in Table 3, where the total number of stars and the corresponding masses for both assumptions concerning the MF slope are given (Cols. 3,4 and 7,8 respectively). The derived relaxation times are given in Col. 5 for the first assumption and in Col. 9 for the second. We were also able to estimate the corresponding stellar densities within both radii for both assumptions on the MF extrapolation, which are given in Cols. 6 and 11 respectively.
6.2 Dynamical or Primordial Mass Segregation?
The results of Table 3 mostly demonstrate the sensitivity of the calculations to the assumed MF slope toward the low-mass end. Still, considering the two cases assumed for the MF extrapolation to lower masses one can safely reach some interesting conclusions, such as that the clusters do not appear to be dynamically relaxed within their observed half-mass radius, since their evolution times are shorter than their relaxation time-scales. Concerning their relaxation within their core radii the results are rather different. If we assume that the MF follows the same slope down to 0.1 M⊙ then NGC 330 and NGC 1818 do not seem to have had the time to reach relaxation in their cores. This is not the case for NGC 2004 and NGC 2100, which appear to be almost (if not completely) relaxed in their cores with both assumptions for their MFs, which makes this result more solid. It is worth noting that if the MFs of NGC 330 and NGC 1818 are assumed to be flat for stars 2 M⊙, then the cores of these clusters appear to be relaxed now.
To make a simple check on the accuracy of our MF extrapolations we performed the same calculations for the whole area of each cluster and we found the total mass of each cluster from its extrapolated MF. The parametric dynamical masses of the clusters as they were found by Mackey & Gilmore (Col. 8 of Table 1) can be used as a guideline, since we can compare them with our estimated masses of the clusters. We found that the parametric mass values favour the extrapolation of the MF that assumes the same slope down to 0.1 M⊙ for most of the clusters (no flattening below 2 M⊙). Specifically the masses of NGC 2100 and NGC 2004 as estimated from their extrapolated MFs are in excellent agreement with their dynamical masses if they include stars down to 0.1 M⊙. Our estimation of the mass of NGC 330 was found to be within the limits of its parametric value, but for NGC 1818 we found that in order to have comparable values for the parametric and observed mass of the cluster its MF should be extrapolated (with the same slope) only down to about 1 M⊙. Still, for the sake of consistency for the estimations that follow, we assumed extrapolation of the MF down to 0.1 M⊙ for all clusters.
It would be interesting to know the relaxation time also within the radius of segregation for each cluster. Therefore, we performed similar calculations to the ones for the relaxation times within and and we defined the time needed for the clusters to relax within their radii of segregation, meaning the radial distances where we detected a significant difference in their MF slopes (Sect. 4.2.2). For NGC 330 we found that the cluster needs 2 to 7 yr to relax within 05, i.e. the distance where a hint of segregation was found. For NGC 1818 a relaxation time within its segregation radius of 06 was found between 2 and 6 yr. The relaxation time of NGC 2004 within its segregation radius (04) was found to be around yr (with both assumptions on its MF extrapolation). The radius of 02 in NGC 2100, where a central mass segregation was observed is fairly close to its observed half-mass radius, so the results are similar with a relaxation time between 50 and 53 Myr. If we assume that this cluster is segregated througout its extent (see Sect. 4.2.2) then it would need 6 - 7 yr to relax dynamically, which is much longer than its age.
The range of these values for the relaxation time of the clusters is mostly due to the assumption adopted for the low-mass end of the MFs. The derived number of stars and the corresponding masses in turn were mostly affected by the assumed MF slope toward this end. So one should keep in mind that all these results can give us only a rough idea on the dynamical status of the clusters under consideration. Stolte et al. (2002), investigating the mass segregation of the Arches cluster, make a very interesting comment concerning such approaches. They note that the observed relaxation time does not properly trace the cluster’s initial conditions, but reflects its current dynamical state and they conclude that distinction between primordial and dynamical mass segregation is not possible for the cluster. In any case, one can apply simple tests, which are based on theory, so that conclusions can be derived on the equipartition among stars of different masses as they are observed in a star cluster. We describe these tests as follows.
Concerning the equipartition time-scale of clusters, simulations by Inagaki & Saslaw (1985) predict that the heaviest stars are located near the center fairly soon. This is in line with Chernoff & Weinberg (1990), who show that during multi-mass collapse equipartition for heavy-mass groups occurs before (dynamical) mass segregation takes place in the cluster as a whole. Spitzer (1969) showed that in a two-component stellar system, if the total mass of the heavier stars exceeds a critical value, equipartition with the lighter stars becomes impossible. If and are the two mass groups in the cluster with and Mi is the total mass of stars in the group of mass then equipartition between the two mass groups can be achieved only if:
| (3) |
For multicomponent systems Inagaki & Saslaw (1985) showed that conditions for global equipartition do not generally arise in stellar systems with a range of masses. These conditions are so restrictive that they are unlikely to apply to realistic clusters. Furthermore, Vishniac (1978) found that the generalisation of Eq. (3) for a system with a specific mass function is the requirement for a MF index 3.5 (Salpeter’s index: ) and Inagaki & Saslaw (1985) found that local equipartition may occur temporarily near the centre among all mass species only if the mass spectrum is even steeper. If the mass spectrum is not very steep only the massive stars can be in approximate equipartition near the centre of the cluster. These authors considering a system of three mass groups , expanded the conditions of Eq. (3) to the following:
| (4) |
the first being the condition for equipartition between the second and the third mass group and the second being the condition for equipartition between the first and the second group (comparable to Eq. (3)). They conclude that it is easier to attain equipartition between the massive stars than between the lighter ones.
From the information provided in the previous paragraphs one may conclude that: (i) The clusters of our sample are not expected to demonstrate any equipartition throughout their area and between all their mass groups, due to their rather flat MFs. (ii) The only stars in equipartition (if any) should be the most massive ones toward the centre of the clusters. Considering these two points it seems rather interesting to test the conditions of Eq. (4) on our clusters using three of their observed massive stellar groups. For this test we used three indicative mass groups from the most massive bins of the MFs of the clusters and we estimated the corresponding total masses for every group using the stellar numbers as they were found from these MFs. We applied the calculations on the MFs of the clusters within their core radii, observed half-mass radii, as well as within their segregation radii. In all cases we used the stars observed to be more massive than 5 M⊙. We tested the conditions of Eq. (4) for all the possible combinations of massive MF bins (stellar groups) that satisfy the inequality .
For NGC 330 we used combinations between 6 mass groups with masses up to 8.5 M⊙. NGC 2004 and NGC 2100 have a wider mass range and so the conditions for equipartition were tested among 9 mass groups more massive than 5 M⊙, with upper limit 13 M⊙. NGC 1818 was tested for 7 mass groups up to 10 M⊙. In all cases it was found that the conditions of Eq. (4) could not be satisfied at any radius for any mass group for all clusters. It is worth noting that the used stellar mass groups and their corresponding total masses are purely observed quantities, so these results are free from any assumption or model. In conclusion, it seems that in the clusters of our sample no equipartition took place between the massive stars within their cores, half-mass radii, or their radii of segregation.
The simulations by Inagaki & Saslaw (1985) suggest that the tendency of massive stars to reach equipartition toward the centre is expected to occur early on and increasing mass segregation later deletes any signature of this equipartition. Could this be the case for our clusters? If so we would not be able to verify any equipartition between the massive groups of stars because mass segregation has erased any trace of it. In a more recent work Bonnell & Davies (1998) determine that the massive stars do segregate very fast but only if they are born within the central 10% to 20% of all stars. Bonnell (1999) concludes that dynamical evolution and mass segregation can be achieved fast under the condition that massive stars are formed within a specific volume of the cluster. Still, equipartition and mass stratification is expected to be accomplished in roughly one relaxation time (e.g. Spitzer & Shull 1975), and the estimated relaxation times of Table 3 do not favour the possibility of completed mass segregation, which would have destroyed any initial equipartition among the massive stars, unless we have seriously underestimated the slopes of the MFs of our clusters. This clearly implies that the observed mass segregation seems to be a primordial effect, related to the loci where massive stars have been formed.
Recent results on the Orion Nebula Cluster (ONC) and the Trapezium cluster in its core (McCaughrean & Stauffer 1994; Hillenbrand 1997; Hillenbrand & Hartmann 1998) have given us the opportunity to reconsider the initial dynamical conditions of star formation. Some of these results have been taken as an indication that star formation is bimodal, with high-mass stars forming in a different way from low-mass stars. Bonnell & Davies (1998) constrained their models in order to answer the question if the bias of the young stellar population in the ONC towards high-mass stars in the central region of the cluster is due to the formation of massive stars in their present locations or to subsequent dynamical evolution. They found that for the present conditions of the cluster to be reproduced it must have been somewhat mass-segregated when it formed.
The star-formation scenario proposed by Bonnell & Davies (1998) seems to agree with the one by Murray & Lin (1996), since the centrally located protostellar clumps grow either through accretion from the residual gas or through coagulation with other fragments. In the later case the collisional timescale for the Trapezium cluster is of the order of 3 crossing times of the central region or one third of the crossing time of the whole cluster, which is not supported by the observations. This leaves only the alternative of subsequent accretion of the residual gas present in the cluster to be more likely to have produced the observed range of stellar masses. Models of accretion in small stellar clusters (Bonnell et al. 1997) showed that the stars near the centre of the cluster have the highest accretion rates. Thus the subsequent accretion of material produces the most massive stars in the centre of the cluster and initial mass segregation takes place. It is worth noting that both scenarios cited here seem to favour environments with high central density for primordial mass segregation to occur.
7 Conclusions
The radial distribution of the cluster density in various magnitude ranges and its MF within different radial distances are two useful diagnostic tools for mass segregation. Both require 1) very good resolution towards the cluster centre in order to have accurate radial density distributions for various magnitude ranges and 2) very good photometry for accurate MFs in rings for various radial distances in order to find at which distance mass segregation leads to a change in the slope of the MF. Our HST/WFPC2 observations on young clusters in the MCs provide a suitable data set for the application of these tools. The conclusions of this investigation on the phenomenon of mass segregation in these clusters are the following.
We searched for mass segregation in a sample of four young star clusters in the MCs, NGC 1818, NGC 2004 and NGC 2100 in the LMC and NGC 330 in the SMC. These clusters are among the younger MC clusters and they vary in age, metallicity and other parameters. Mass segregation was exhibited in all four of them, but in a variety of related parameters, as well as of degrees of significance. From the dependence of their density profiles on the selected magnitude range it was found that NGC 1818 exhibits strongly the phenomenon of mass segregation with stars segregated almost in the whole of the observed magnitude range, while NGC 330 and NGC 2100 show a rather weak dependence and it is important only for stars around mag ( 4 M⊙). For NGC 2004 there is an even weaker dependence also for mag.
We constructed the mass functions (MFs) of the clusters for the observed range of magnitudes in order to check for any radial dependence of their slopes as the signature of mass segregation. This construction was performed with two methods. First by directly counting stars between evolutionary tracks according to their positions in the HRD and second by translating their luminosities into masses using mass-luminosity relations and then constructing the distribution of the estimated masses. The which is more accurate concerning the shape of the MF but less statistically significant due to the lower numbers, was used to test the results of the , which is more statistically complete but more model dependent.
We constructed the MFs of the clusters considering the dependence of their shape to the chosen binning for counting stars, the correction for incompleteness and the field contamination. The use of a mass-luminosity relation can affect the shape of the resulting MF (which tends to be flatter for older population models). Still, it was found that the models used for the were sufficient, since the overall MFs do not differ significantly from one method to the other and they have slopes clustered around a Salpeter IMF for a mass range of 3 - 9 M⊙ for NGC 330, 3 - 14 M⊙ for NGC 2004, 4 - 11 M⊙ for NGC 1818 and 4 - 14 M⊙ for NGC 2100. It should be noted that not all of them may be represented by a single-power law for the whole mass range mentioned.
The construction of the radial MFs for the investigation of their slopes proved to be a rather complicated procedure due to several factors. Counting stars for the construction of the MF of a cluster in a specific ring around the centre can produce statistical problems due to the low numbers. Thus, the was excluded from the investigation of the radial dependence of the MF slope of the clusters, since by definition, it can rely on a smaller sample of stars. NGC 1818 and NGC 2004 as was found from the radial dependence of their MFs are mass-segregated at radial distances of about 06 and 04 respectively. NGC 2100 was also found to be mass-segregated probably throughout its observed extent, but a steep radial dependence of its MF in the inner 02 was also observed and this can be assigned to a local central mass segregation of the most massive group of stars ( 13 M⊙) as was found from the relative numbers of stars inside and outside this radial limit. This was also the case for NGC 1818 where 99% of the stars with masses around 10 M⊙ were found concentrated within about 02 from its centre. NGC 330 was also found to be segregated from the radial dependence of its MF, but in a less pronounced way up to a distance of 05, with the best segregated mass group to be around 4 M⊙. This cluster could also be considered as mass segregated throughout its extent.
We estimated the median relaxation time of the clusters in their core and observed half-mass radii, as well as in their “radii of segregation” as derived from the radial dependence of their MF slopes. This estimation was based on assumptions on the slope, and on the low-mass limit, and we found that the clusters in this sample are not dynamically relaxed within these radii, except for NGC 2004 and NGC 2100, which were found to be very close to relaxation only in their cores. Furthermore, the test of conditions for equipartition among three massive groups (Inagaki & Saslaw 1985) in our clusters showed that no equipartition has taken place in any cluster at any of the above radii for stars with masses larger than 5 M⊙. This clearly suggests that the observed mass segregation is of primordial nature. We present a discussion where we highlight the most important aspects of theories of star formation predicting the phenomenon of initial mass segregation (Sect. 6.2).
In general it seems that the diagnostic tools applied here, which are those most commonly used for the investigation of mass segregation, are rather sensitive to selection effects, such as the selection of the radial distances for which the MF slopes are computed, the binning selected for the construction of the MF, the selection of the mass range where the slopes are estimated, etc. While the presence of mass segregation in our sample of clusters is certainly a robust result, the description of the phenomenon can be only qualitative. Specifically, we observe that the clusters of our sample exhibit mass segregation in different ways, but to describe these differences we would need to define a new parameter. This parameter may be called “degree of mass segregation”, and it should be a function of parameters involved in the magnitude dependence of the density profile and the radial dependence of the MF slope for each cluster. It is not yet possible to define such a parameter with the use of the available tools, due to the limitations mentioned above. Gouliermis & de Boer (2003) recently proposed a new method for the detection of stellar stratification in star clusters. They present a self-consistent, model-free tool for the investigation of the phenomenon, which can also be used to quantify the degree of mass segregation in star clusters in a uniform manner. This tool would probably provide a coherent scheme for the description of stellar stratification in star clusters, so that global and comparable results can be achieved.
Acknowledgements.
S. C. Keller acknowledges the support of an Australian Postgraduate Research scholarship and a grant from the DIST Hubble Space Telescope research fund. This work is based on observations with the NASA/ESA Hubble Space Telescope, obtained at the Space Telescope Science Institute, which is operated by the Association of Universities for Research in Astronomy, Inc., (AURA), under NASA Contract NAS 5-26555.References
- (1) Andreuzzi, G., Buonanno, R., Fusi Pecci, F., Iannicola, G., & Marconi, G. 2000, A&A, 353, 944
- (2) Binney, J., & Tremaine, S. 1987, “Galactic Dynamics”, (Princeton University Press)
- (3) Brandl, B., Sams, B. J., Bertoldi, F., et al. 1996, ApJ, 466, 254
- (4) Brandl, B., Brandner, W., Eisenhauer, F., Moffat, A. F. J., Palla, F., & Zinnecker, H. 1999, A&A, 352, L69
- (5) Behrend, R., & Maeder, A. 2001, A&A, 373, 190
- (6) Bertelli G., Bressan, A., Chiosi, C., Fagotto, F., & Nasi, E. 1994, A&AS, 106, 275
- (7) Bolte, M. & Marleau, F. 1989, PASP 101, 1088
- (8) Bonnell, I. A., & Davies, M. B. 1998, MNRAS 295, 691
- (9) Bonnell, I. A., Bate, M. R., Clarke, C. J., Pringle, J. E. 1997, MNRAS, 285, 201
- (10) Bonnell, I. A., Bate, M. R., & Zinnecker, H. 1998, MNRAS, 298, 93
- (11) Bonnell, I. A., 1999, in C. J. Lada & N. D. Kylafis (eds) The Origin of Stars and Planetary Systems, (Kluwer Academic Publishers), 479
- (12) Bonnell, I. A., 2000, in ASP Conf. Ser. 198, Stellar Clusters and Associations: Convection, Rotation, and Dynamos, R. Pallavicini, G. Micela, and S. Sciortino (eds) (San Francisco: ASP), 161
- (13) Brandl, B., Sams, B. J., Bertoldi, F., Eckart, A., Genzel, R., Drapatz, S., Hofmann, R., Loewe, M., & Quirrenbach, A. 1996, ApJ, 466, 254
- (14) Charbonnel, C., Meynet, G., Maeder, A., Schaller, G., & Schaerer, D. 1993, A&AS, 101, 415
- (15) Chernoff, D. F., & Weinberg, M. D. 1990, ApJ 351, 121
- (16) Chiosi, C., Vallenari, A., Bressan, A., Deng, L., Ortolani, S. 1995, A&A, 2, 710
- (17) Clarke, C. J., Bonnell, I. A. & Hillenbrand, L. A., 2000, in Protostars and Planets IV, Mannings, V., Boss, A. P., & Russell, S. S. (eds), (University of Arizona Press), 151
- (18) Cote, P., Richer, H. B., Fahlman, G. 1991, AJ, 102, 1358
- (19) Da Costa, G.S. 1982, AJ 87, 990
- (20) Da Costa, G.S., & Hatzidimitriou, D. 1998, AJ, 115, 1934
- (21) de Grijs, R., Johnson R. A., Gilmore, G. F., & Frayn, C. M. 2002a, MNRAS, 331, 228
- (22) de Grijs, R., Gilmore, G. F., Johnson R. A., & Mackey, A. D. 2002b, MNRAS, 331, 245
- (23) de Grijs, R., Gilmore, G. F., Mackey, A. D., Wilkinson, M. I., Beaulieu, S. F., Johnson, R. A., & Santiago, B. X. 2002c, MNRAS, 337, 597
- (24) de Marchi, G., & Paresce, F. 1996, ApJ, 467, 658
- (25) Elmegreen, B. 1999, ApJ, 515, 323
- (26) Elmegreen, B. 2001, in ASP Conf. Ser. 249, The Central kpc of Starbursts and AGN, J. H. Knapen, J. E. Beckman, I. Shlosman, & T. J. Mahoney (eds), (San Francisco: ASP), 492
- (27) Elson, R. A. W., Fall, S. M., & Freeman, K. C. 1987, ApJ, 323, 54
- (28) Elson, R. A. W. 1991, ApJS, 76, 185
- (29) Elson, R. A. W., Sigurdsson, S., Davies M., Hurley, J., Gilmore, G. 1998, MNRAS, 300, 857
- (30) Ferraro, F. R., Carretta, E., Bragaglia, A., Renzini, A., & Ortolani, S. 1997, MNRAS, 286, 1012
- (31) Fischer, P., Pryor, C., Murray, S., Mateo, M., & Richtler, T. 1998, AJ, 115, 592
- (32) Gouliermis, D. & de Boer, K. S. 2003, ApJ Submitted
- (33) Grebel, E. K. 1996, PASP, 108, 1141
- (34) Hill, V. 1999, A&A, 345, 430
- (35) Hillenbrand, L. A. 1997, AJ, 114, 1275
- (36) Hillenbrand, L. A., & Hartmann, L. W. 1998, ApJ, 492, 540
- (37) Howell, J. H., Guhathakurta, P, & Tan, A. 2000, AJ, 119, 1259
- (38) Hunter, D. A., Light, R. M., Holtzman, J. A., Lynds, R., O’Neil, E. Jr., & Grillmair, C. J. 1997, ApJ 478, 124
- (39) Inagaki, S., & Saslaw, W. C. 1985, ApJ 292, 339
- (40) Jasniewicz, G., & Thévenin, F. 1994, A&A, 282, 717
- (41) Johnson, R. A., Beaulieu, S. F., Gilmore, G. F., Hurley, J., Santiago, B. X., Tanvir, N. R., Elson, R. A. W. 2001, MNRAS, 324, 367
- (42) Jones, B. F., & Stauffer, J. R. 1991, AJ, 102, 1080
- (43) Keller, S. C. 1999, AJ, 118, 889
- (44) Keller, S. C., Bessell, M. S., & Da Costa, G. S. 2000, AJ 119, 1748
- (45) Keller, S. C. 2001, PASP, 113, 1570
- (46) Keller, S. C., Kontizas, M., Gouliermis, D., Bellas-Velidis, I., Bessell, M. S., Da Costa, G. S., & Kontizas, E. 2001, in ASP Conf. Ser. 228, Dynamics of Star Clusters and the Milky Way, S. Deiters, B. Fuchs, R. Spurzem, A. Just, & R. Wielen (eds), (San Francisco: ASP), 473
- (47) King, I. R. 1966, AJ, 71, 64
- (48) King, I. R., Sosin, C., & Cool, A. M. 1995, ApJL, 452, 33
- (49) Kontizas, M., Hatzidimitriou, D., Bellas-Velidis, I., Gouliermis, D., Kontizas, E., & Cannon, R.D., 1998, A&A 336, 503
- (50) Kroupa, P., Tout, C. A., & Gilmore, G. F. 1993, MNRAS, 262, 545
- (51) Kroupa, P. 1995, MNRAS, 277, 1491
- (52) Kroupa, P. 2000, in ASP Conf. Ser. 211, Massive Stellar Clusters, A. Lançon & C. Boily (eds) (San Francisco: ASP), 233
- (53) Kroupa, P. 2001, MNRAS, 322, 231
- (54) Kroupa, P. 2002, Science, 295, 82
- (55) Larson, R. B. 1991, in IAU Symp. 147, Fragmentation of Molecular Clouds and Star Formation, E. Falgarone, F. Boulanger & G. Duvert (eds), (Kluwer, Dordrecht), 261
- (56) Lightman, A.P. & Shapiro, S.L., 1978, Rev. Mod. Phys. 50, 437
- (57) Mackey, A. D., & Gilmore, G. F. 2003a, MNRAS, 338, 85
- (58) Mackey, A. D., & Gilmore, G. F. 2003b, MNRAS, 338, 120
- (59) Malumuth, E. M., & Heap, S. R. 1994, AJ, 107, 1054
- (60) Marconi, G., Andreuzzi, G., Pulone, L., Cassisi, S., Testa, V., & Buonanno, R. 2001, A&A, 380, 478
- (61) Massey, Ph., Lang, C.C., DeGioia-Eastwood, K., & Garmany, C. R. 1995, ApJ, 438, 188
- (62) McCaughrean, M. J., & Stauffer, J. R. 1994, AJ, 108, 1382
- (63) Meylan, G. & Heggie, D.C. 1997, A&A Rev. 8, 1
- (64) Murray, S. D., & Lin, D. N. C. 1996, ApJ 467, 728
- (65) Pandey, A. K., Mahra, H. S., & Sagar, R. 1992, BASI, 20, 287
- (66) Paresce, F., de Marchi, G., & Jedrzejewski, R. 1995, ApJL, 442, 57
- (67) Portegies Zwart, S. F., Makino, J., McMillan, S. L. W., & Hut, P. 2002, ApJ, 565, 265
- (68) Raboud, D. & Mermilliod, J.-C., 1998, A&A 333, 897
- (69) Richtler, T., Fischer, P., Mateo, M., Pryor, C., & Murray, S. 1998, in the Proceedings of the Bonn/Bochum-Graduiertenkolleg Workshop, The Magellanic Clouds and Other Dwarf Galaxies, T. Richtler & J.M. Braun (eds), (Aachen: Shaker Verlag), 285
- (70) Salpeter, E. E. 1955, ApJ, 121, 161
- (71) Sagar, R., Richtler, T., & de Boer, K. S. 1991, A&AS, 90, 387
- (72) Sagar, R., & Richtler, T. 1991, A&A, 250, 324
- (73) Santiago, B., Beaulieu, S., Johnson, R. & Gilmore, G. F. 2001, A&A, 369, 74
- (74) Schaerer, D., Meynet, G., Maeder, A., & Schaller, G. 1993, A&AS, 98, 523
- (75) Scalo, J. M. 1986, Fund. Cosmic Phys., 11, 1
- (76) Sirianni, M., Nota, A., Leitherer, C., De Marchi, G., & Clampin, M. 2000, ApJ, 533, 214
- (77) Sirianni, M., Nota, A., De Marchi, G., Leitherer, C., & Clampin, M. 2002, ApJ, 579, 275
- (78) Shu, C.-G., Zhao, J.-L., & Tian, K.-P. 1997, ChA&A, 21, 212
- (79) Sosin, C., 1997, AJ 114, 1517
- (80) Stolte, A., Grebel, E. K., Brandner, W., & Figer, D. F. 2002, A&A, 394, 459
- (81) Spitzer, L. Jr. 1969, ApJL, 158, 139
- (82) Spitzer, L. Jr., & Shull, J. M. 1975, ApJ, 201, 773
- (83) Subramaniam, A., Sagar, R., & Bhatt, H. C. 1993, 273, 100
- (84) Tout, C. A., Pols, O. R., Eggleton P. P., Han Z., 1996 MNRAS, 281, 257
- (85) Vallenari, A., Ortolani, S., & Chiosi, C. 1994, A&A, 108, 571
- (86) Vishniac, E. T. 1978, ApJ, 223, 986
- (87) Will, J.-M., Bomans, D. J., & de Boer, K. S. 1995, A&A, 295, 54