A transient large-scale relativistic radio jet from GX 339–4
Abstract
We report on the formation and evolution of a large-scale, synchrotron-emitting jet from the black hole candidate and X-ray binary system GX 3394. In 2002 May, the source moved from a low/hard to a very high X-ray state, contemporaneously exhibiting a very bright optically thin radio flare. Further observations with the Australia Telescope Compact Array have tracked the formation of a collimated structure extending to about 12 arcsec, with apparent velocity greater than 0.9. The luminosity of the outflow seems to be rapidly decreasing; these observations confirm that transient large-scale jets are likely to be common events triggered by X-ray state transitions in black hole X-ray binaries.
keywords:
Accretion, accretion discs – Binaries: general – ISM: jets and outflows – Radio continuum: stars – X-rays: stars – Individual: GX 33941 Introduction
The X-ray binary GX 3394 comprises a compact primary which is a strong Black Hole Candidate (BHC), with mass function of 5.80.5 (Hynes et al. 2003) and a secondary which is likely to be an evolved low mass star (Shahbaz, Fender & Charles 2001; Chaty et al. 2002). The system has an orbital period of 1.75 days (Hynes et al. 2003) and is located at a distance of at least 4 kpc (Zdziarski et al. 1998; see also Shahbaz, Fender & Charles 2001 and Maccarone 2003), with an orbital inclination of less than 60∘ to the line of sight, as inferred from the lack of eclipses (Cowley et al. 2002). GX 3394 has been a key source in our understanding of the relation between accretion and the production of relativistic jets. It was the first BHC to reveal a positive correlation between radio and X-ray fluxes in the low/hard X-ray state (Hannikainen et al. 1998, later quantified by Corbel et al. 2003), and to demonstrate an association between the ‘quenching’ of core radio emission and the transition to a high/soft X-ray state (Fender et al. 1999; see e.g. Done 2001, for a review on X-ray states and Fender 2004 for a comparison of radio and X-ray behaviour in Galactic BHCs). After spending almost three years in ‘quiescence’, GX 3394 re-brightened in X-rays at the end of 2002 March (Smith et al. 2002) and changed rapidly to a soft outburst state, undergoing a dramatic state change in 2002 May. This transition was associated with a bright radio flare (Fender et al. 2002), reaching four to five times the brightest radio level ever observed from the source (see Corbel et al. 2000 for the long-term behaviour of GX 339–4). By analogy with other systems (e.g. XTE J1550–564, Corbel et al. 2001), this flare was likely to be the signature of a powerful ejection event. Repeated radio observations of GX 3394 have indeed confirmed this association: the 2002 radio flaring has led to the formation of a large-scale relativistic radio jet, whose morphology and dynamics will be presented in the course of this Letter.
2 ATCA observations
The Australia Telescope Compact Array (ATCA) performed eight continuum observations of GX 3394 at roughly regular intervals between 2002 April and August, simultaneously at 4800 MHz (6.3 cm) and 8640 MHz (3.5 cm). Three further observations were performed in 2003 January, March and May at four frequencies: 1384 MHz (21.7 cm), 2368 MHz (12.7 cm), 4800 and 8640 MHz.
The ATCA synthesis telescope is an east-west array of six 22 m antennas with baselines ranging from 31 m to 6 km; it uses orthogonal polarized feeds and records full Stokes parameters (I, Q, U, V). The target was systematically offset by about 10 arcsec from the array phase centre, in order to avoid possible artefacts due to system errors such as DC-offsets. In each observation, PKS 1934–638 was used for absolute flux and bandpass calibration, while either PMN 1603–4904, PMN 1650–5044 or PMN 1726–5529 was the phase calibrator for antenna gains and phases. The data reduction process and image analysis have been carried out with the Multichannel Image Reconstruction, Image Analysis and Display (MIRIAD) software package (Sault, Teuben & Wright 1995; Sault & Killeen 1998). Dates of ATCA observations are indicated in Fig. 1, superimposed on the Rossi X-ray Timing Explorer/All Sky Monitor (RXTE/ASM) 2–12 keV light curve of the system.
2.1 Outburst and optically thin core radio flare

Smith et al. (2002) reported an increase in the X-ray flux from GX 3394, which had been in quiescence for almost three years (Kong et al. 2000), on 2002 March 26 (MJD 52360). The source reached a peak flux (2–12 keV) of 0.8 Crab on 2002 May 15 (MJD 52410), followed by a decrease to 0.4 Crab, and a secondary rise to 0.9 Crab around MJD 52500, after which GX 3394 has started a slow return to ‘quiescence’ (reached by the time of writing). The hardness ratio HR2 suggests that a rapid transition from a low/hard to a softer X-ray state took place a few days before the (first) outburst peak, although colour and timing analysis of the RXTE Proportional Counter Array data indicates a smooth transition from a low/hard to a very high state in the rising phase, followed by a high/soft state (or possibly an ‘oscillating’ very-high state) after the peak (Belloni et al. 2002; Nespoli et al. 2003).
ATCA observations performed between 2002 April and June have detected the brightest radio flare ever observed by the system, which reached a peak flux density of about 55 mJy on May 14 (MJD 52408), almost contemporaneously with the (first) X-ray peak.
| Date | MJD | 8640 MHz | offset (a) | lin pol | 4800 MHz | offset (a) | lin pol | |
|---|---|---|---|---|---|---|---|---|
| (UT time) | (day) | flux (mJy) | (arcsec) | P/I, PA | flux (mJy) | (arcsec) | P/I, PA | () |
| 2002:04:18 | 52382.75 | 13.490.08 | –0.05, +0.07 | 12.970.07 | –0.05, +0.09 | +0.070.01 | ||
| 2002:05:14 | 52408.48 | 10–40 | … | ∘∘ | 10–55 | … | ∘∘ | –0.520.01(b) |
| 2002:05:19 | 52413.42 | 12.270.16 | –0.12, +0.13 | 20.390.23 | –0.12, +0.10 | –0.860.03 | ||
| 2002:06:09 | 52434.28 | 0.3 | … | … | 0.4 | … | … | … |
| 2002:07:05 | 52460.29 | 10.620.15 | –0.17, –0.05 | ∘∘ | 14.890.19 | –0.22, –0.00 | ∘∘ | –0.570.03 |
| 2002:07:28 | 52483.20 | 10.330.18 | –0.25, –0.02 | ∘∘ | 13.840.29 | –0.27, –0.00 | ∘∘ | –0.500.04 |
| 2002:08:02 | 52488.28 | 9.450.17 | –0.22, –0.08 | 11.980.25 | –0.30, –0.03 | –0.400.05 | ||
| 2002:08:30 | 52516.12 | 1.510.13 | –0.63, +0.02 | 2.470.07 | –0.61, +0.20 | –0.830.14 |

The radio flare light curves at 4800 and 8640 MHz are shown in Fig. 2 together with the temporal evolution of the spectral index, which decreased from down to (where loglog). As the spectral index does not significantly decrease during the last two hours prior to the flare peak, the flux rise in this time interval can not be due to decreasing optical depth, as predicted by adiabatic expansion models (e.g. van der Laan 1966), but instead represents a finite phase of particle acceleration.
We can derive the minimum energy associated with the emitting component during the rise, following the formulation by Longair (1994; see also Fender 2004). Assuming an optimal jet viewing angle ∘, for which the maximum apparent velocity of the jet is achieved (i.e. a jet semi-opening angle given by with , see next Section), and a volume of the emitting region of about 91044cm3 (given by (, with hours), the corresponding minimum energy required is erg; the associated magnetic field for which the energy in relativistic particles equals the magnetic energy is of mG. The kinetic energy in case of a pure e+e- plasma would be erg. If there is one (cold) proton for each electron, then erg, with an associated mass of g. In order to accumulate such mass for a 10 BH accreting at a few per cent of the Eddington rate (as indicated by the X-ray luminosity), it would have taken a few minutes. The (much longer) observed rise time of 5.5 hours would be of the same order of the injection time-scale if only a few per cent of the accreted mass was loaded into the jet.
The minimum jet powers equal and erg
s-1, for e+e- and baryonic plasma respectively. In the last 20
minutes of the observation, after reaching the peak level of 55 mJy at
4800 MHz, the flux density decreases linearly with time with the same slope at
both frequencies, indicating that the main rediative cooling process is
adiabatic (synchrotron and Compton cooling times scale with the
frequency as ); the observed decline is much shallower than that
predicted by adiabatic expansion models without any additional energy
injection (e.g. , van der Laan 1966).
The position of the radio source on 2002 April 18, when the source was in a bright, flat-spectrum radio state prior to the outburst, is consistent with the binary centre as given by Corbel et al. (2000). Radio emission from GX 3394 dropped to undetectable levels by 2002 June 09 (0.4 mJy at 4800 MHz), possibly corresponding to extinction of the May 14 flare.
Although further ATCA observations are consistent with a single fading radio source (see Table 1), observations at 843 MHz performed with the Molonglo Observatory Synthesis Telescope (MOST) indicate more complex behaviour over the period 2002 June-July (Campbell-Wilson & Hunstead, private communication), possibly associated with multiple ejection events. A more detailed analysis of the radio variability over this period, including the MOST data, will be presented in a future paper.

Fig. 3 shows radio maps of GX 3394 at 8640 and 4800 MHz on 2002
July 05, July 28 and August 30. The position of the radio source as imaged by
ATCA is displaced by about 0.2 arcsec to the western side (right on the maps)
of the binary core on 2002 July 05, July 28 and August 02 (not shown),
although, given a total positional uncertainty of 0.3 arcsec in this set of
observations, these coordinates are still consistent with the binary core. By
2002 August 30, however, the displacement to the western side is of
arcsec (in position angle PA = – 72∘32∘; PA is
defined positive north–east) at both frequencies, indicating the formation of
a physically separated component. If this event was powered by the May 2002
flare, that would imply a proper motion of about 6 mas/day, that is a minimum
projected velocity of 0.1 (for the minimum distance of 4 kpc); however, if
the displacement of about 0.2 arcsec measured on August 02 was real, it would
imply a separation of at least 400 mas covered in 28 days,
i.e. a minimum projected velocity of 0.3.
2.2 Extended radio jet
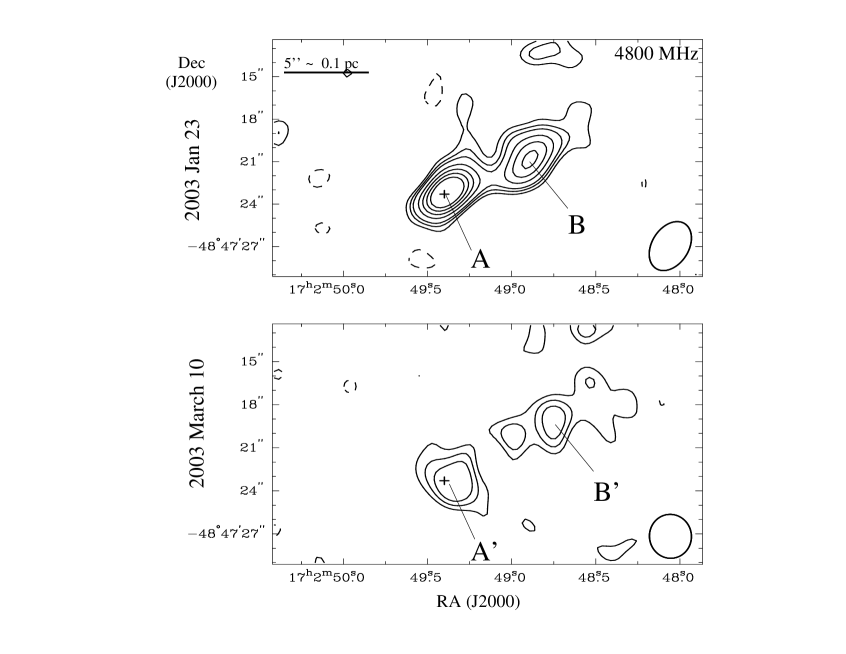
We expect the bright radio flare(s) of GX 339–4 during its 2002 outburst to be associated with powerful ejection event(s) fed by the source central engine. In fact, ATCA has been observing GX 3394 at regular intervals again in 2003, tracking the formation of a large-scale, relativistic jet. Fig. 4 and Table 2 present the result of these observations at 4800 MHz, where the most notable structures have appeared.
By 2003 January, an extended outflow composed of two separate ‘plasmons’ has developed in the same direction of the western component detected on 2002 August 30: the first structure, knot A, is displaced by 0.3 arcsec north-west from the core, while the other component, knot B, is displaced by 5.5 arcsec in PA = – 62∘ 2∘ with respect to the binary core, implying a minimum velocity of 0.5 if associated with the 2002 May flare. It is worth stressing that this value only represents a lower limit on the velocity not only because of the lower limit on the distance, but also because it is likely that the knots were energised by the outflow somewhat earlier than when they were observed (see Section 3). Both knots display steep optically thin radio spectrum, with and (probably either because we are looking above the cooling break frequency, or because of resolution effects). An elongated structure is visible at 2368 MHz too.
By 2003 March 10 (MJD 52708) the outflow has faded; at least two components are distinguishable at 4800 MHz: knot A’ and B’, probably associated with knot A and B from January 23. They are displaced respectively by 0.5 and 6.9 arcsec (with a relative error of 0.3 arcsec), with PA(A’) = – 83∘26∘and PA(B’) = – 66∘2∘. The spectrum remains optically thin, with (while knot B’ is significantly detected at 4800 MHz only). Assuming again an association with the 2002 May flare, the separation between knot B’ and the binary core (6.9 arcsec) corresponds to a velocity of 0.6 at 4 kpc. The jet head in the 4800 MHz map is about 12 arcsec away from the core, implying a projected extension of 0.23 pc at 4 kpc and a minimum velocity of 0.9. If GX 3394 was instead at a distance of at least 5.6 kpc, as estimated from the upper limit on the magnitude of the secondary star (Shahbaz, Fender & Charles 2001), the jet would become superluminal, with apparent velocity higher than 1.3; while, given a minimum distance of 7.6 kpc, as inferred by Maccarone (2003) from the typical soft-to-hard X-ray state transition luminosity of X-ray binaries, the jet apparent velocity would be higher than 1.8.
By 2003 May 25 (MJD 52784), the isolated optically thin knots have faded below detectable levels at all wavelengths. Instead, a central component has re-brightened at the binary core position, with peak flux density of 0.9 mJy at 8640 MHz. Core emission at four frequencies is consistent with an inverted spectrum (), characteristic of an optically thick synchrotron jet, indicating the source core return to a hard state. Table 3 lists core flux densities (1 upper limits on the optically thin components of the extended jet are given by their errors, i.e. rms noise levels) at four frequencies. No counter-jet has been detected so far.
| Date | MJD | 4800 MHz | offset | spectral index |
|---|---|---|---|---|
| (UT time) | (day) | flux (mJy) | (arcsec) | , () |
| 2003:01:23 | 52662.67 | |||
| knot A | 0.660.04 | –0.25 +0.22 | ||
| knot B | 0.470.04 | –4.88 +2.54 | ||
| 2003:03:10 | 52708.56 | |||
| knot A’ | 0.250.04 | –0.55, –0.07 | ||
| knot B’ | 0.210.04 | –6.28, +2.80 | (a) |
2.3 Linear polarization
Linearly polarized emission is significantly detected at three epochs: on 2002 May 14, when the powerful flare was detected, the mean polarization level is of 4 at 4800 MHz and of 9 at 8640 MHz, with mean polarization angles: PA(4800) = ∘3∘and PA(8640) = ∘2∘. On 2002 July 05, about 5 of the flux is linearly polarized at both 4800 and 8640 MHz, with electric field vectors in position angle PA(4800) = ∘3∘and PA(8640) = 6∘. A comparable polarization level is seen on 2002 July 28: position angles have switched to PA(4800) = ∘5∘and PA(8640) = ∘6∘(E vectors are plotted in Fig. 3 superimposed upon the contour maps). The rotations PA(4800 MHz) and PA(8640 MHz) are consistent between 2002 July 05 and July 28, likely reflecting an overall rotation of the projected magnetic field of the emission region. The rotation angle between the two frequencies is between 24∘– 46∘on July 05 and between 13∘– 35∘on July 28, indicative of foreground Faraday rotation; if so, we get a lower limit of about 100 rad m2 on the rotation measure. No significant linearly polarized emission is detected in any of the other 2002 observations when the source was bright enough to detect a polarized signal at a level of a few per cent (see Table 1 for upper limits). In particular, linear polarization is lower than 1 by 2002 April 18, when the optically thick core emission is seen ( = +0.07); for comparison, Corbel et al. (2000) detected about 2 of linear polarization at 8704 MHz in 1997 February, with a flux of 8–9 mJy and a similar optically thick spectrum ( = 0.11–0.23).
3 Summary and discussion
The main result established in this work is the formation of a large-scale relativistic radio jet powered by GX 3394 during its 2002 outburst: this association indicates that large-scale outflows are likely to be common following any major radio flare triggered by a hard-to-soft(er) X-ray state transition (see e.g. Harmon et al. 1995; Fender & Kuulkers 2001).
How does the large-scale jet develop? The position of the radio source detected by ATCA is consistent with the binary core until the beginning of 2002 August. Observations between the end of 2002 August and 2003 March reveal the presence of at least two physically separated components: the first to appear, always brighter and closer to the binary core (knot A-A’), has a mean separation of 0.50.1 arcsec to the western side of the core, while its density flux decreases by a factor 10 in about 220 days. The second component – always fainter – first appears in the 2003 maps (knot B-B’ in Figure 4) and is displaced by about 7 arcsec from the binary core in PA = – 64∘2∘. Once they have appeared, both knots decline in flux while their positions remain unchanged within uncertainties, unlike e.g. in GRS 1915+105, where the observed ejecta are consistent with simple ballistic bulk motions (Rodríguez & Mirabel 1999; Fender et al. 1999). The large-scale jet of GX 339-4 seems instead to be better explained in terms of shock waves formed within the jet itself and/or by the interaction of an underlying highly relativistic outflow with ambient matter. A more detailed modelling of the jet components, including maps at all four frequencies, will be presented in a forthcoming paper.
Polarization analysis at three epochs shows a significant rotation of the electric vector position angle at two frequencies, indicating a change in the projection of the magnetic field on the plane of the sky. The large-scale jet position angle (PA = – 64∘2∘) is consistent with that of the jet-like extension in the 8640 MHz map of GX 3394 observed by ATCA in 1996 July (Fender et al. 1997). In addition, Corbel et al. (2000), analysing the persistent radio emission of GX 3394 while in the low/hard X-ray state, found a similar PA for the electric field vector (expected to be parallel to the magnetic field vector in case of optically thick spectrum) of the linearly polarized signal, indicating a rather stable jet orientation over the years.
| 1384 MHz | 2368 MHz | 4800 MHz | 8640 MHz |
|---|---|---|---|
Persistent large-scale radio jets observed in 1E 1740.7–2942 (Mirabel et al. 1992) and GRS 1758–258 (Rodríguez, Mirabel & Martí 1992) have been found to extend up to 1–3 pc; in the case of GRS 1915+105 instead, relativistic ejecta were tracked up a projected distance of 0.08 pc (Mirabel & Rodríguez 1999), while in the large-scale X-ray jet powered by XTE J1550–564 (Corbel et al. 2002), the eastern jet has been detected to a projected physical separation of 0.75 pc covered in 4 years. The large-scale radio jet of GX 3394 displays something, with a projected extension of 0.23 pc (at 4 kpc) covered in about 250 days (if associated with the May 2002 radio flare). Scheduled Chandra observation will discover if the jet is active in X-rays as well, possibly confirming the similarity with XTE J1550–564 (Corbel et al. 2002; Kaaret et al. 2003; Tomsick et al. 2003), where the X-ray jet is still capable of accelerating particles up to TeV energies four years after the main ejection event.
Acknowledgments
We thank Dick Hunstead and Duncan Campbell-Wilson for kindly providing us with preliminary results of the MOST observations. The Australia Telescope is funded by the Commonwealth of Australia for operation as a National Facility managed by CSIRO. RXTE/ASM results are provided by the ASM/XTE team at MIT.
References
- [] Belloni T., Nespoli E., Homan J., van der Klis M., Lewin W. H. G., Miller J. M., Mendéz M., 2002, New Views on Microquasars, the Fourth Microquasars Workshop, Ed.: Ph. Durouchoux, Y. Fuchs, and J. Rodríguez, Center for Space Physics: Kolkata (India), 75
- [] Chaty S., Mirabel I. F., Goldoni P., Mereghetti S., Duc P. A., Martí J., Mignani R. P., 2002, MNRAS, 331, 1065
- [] Corbel S. et al. , 2001, ApJ, 554, 43
- [] Corbel S., Nowak M. A., Fender R. P., Tzioumis A. K., Markoff S., 2003, A&A, 400, 1007
- [] Corbel S., Fender R. P., Tzioumis A. K., Nowak M., McIntyre V., Durouchoux P., Sood R., 2000, A&A 359, 251
- [] Corbel S., Fender R. P., Tzioumis A. K., Tomsick J. A., Orosz J. A., Miller J. M., Wijnands R., Kaaret P., 2002, Science, 298, 196
- [] Cowley A. P., Schmidtke P. C., Hutchings J. B., Crampton D., 2002, ApJ, 123, 1741
- [] Done C., 2001, AdSpR, 28, 255
- [] Fender R. P., 2004, to appear in ‘Compact Stellar X-Ray Sources’, Ed.: W. H. G. Lewin and M. van der Klis, Cambridge University Press (astro-ph/0303339)
- [] Fender R. P. & Kuulkers E., 2001, MNRAS, 324, 923
- [] Fender R. P., Spencer R. E., Newell S. J., Tzioumis A. K., 1997, MNRAS, 286, L29
- [] Fender R. P., Corbel S., Tzioumis A. K., Tingay S., Brocksopp C., Gallo E., 2002, ATel 107
- [] Fender R. P., Garrington S. T., McKay D. J., Muxlow T. W. B., Pooley G. G., Spencer R. E., Stirling A. M., Waltman E. B., 1999, MNRAS, 304, 865
- [] Fender R. P. et al. , 1999, ApJ, 519, L165
- [] Hannikainen D. C., Hunstead R. W., Campbell-Wilson D., Sood R. K., 1998, A&A, 337, 460
- [] Harmon B. A., 1995, Nature, 374, 703
- [] Hynes R. I., Steeghs D., Casares J., Charles P. A., O’Brien K., 2003, ApJ, 583L
- [] Kaaret P., Corbel S., Tomsick J. A., Fender R. P., Miller J. M., Orosz J. A., Tzioumis A. K., Wijnands R., 2003, ApJ, 582, 945
- [] Kong A. K. H., Kuulkers E., Charles P. A., Homer L., 2000, MNRAS, 312, L49
- [] Longair M. S., 1994, High Energy Astrophysics, Cambridge University Press
- [] Maccarone T. J., 2003, A&A, in press (astro-ph/0308036)
- [] Mirabel I. F., Rodríguez L. F., ARA&A, 1999, 37, 409
- [] Mirabel I. F., Rodríguez L. F., Cordier B., Paul J., Lebrun F., 1992, Nature, 358, 215
- [] Nespoli E., Belloni T., Homan J., Miller J. M., Mendéz M., van der Klis M., 2003, A&A, in press (astro-ph/0309437)
- [] Rodríguez L. F., Mirabel I. F., 1999, 511, 398
- [] Rodríguez L. F., Mirabel I. F., Martí J., 1992, ApJ, 401, L15
- [] Sault R. J., Killeen N. E. B., 1998, The Miriad User’s Guide Sydney: Australia Telescope National Facility
- [] Sault R. J., Teuben P. J., Wright M. C. H., 1995, Astronomical Data Analysis Software and Systems IV, Ed.: R. A. Shaw, H. E. Payne, and J. J. E. Hayes, ASP Conference Series, 77, 433.
- [] Shahbaz T., Fender R. P. & Charles P. A., 2001, A&A, 376, L17
- [] Smith D. M., Swank J. H., Heindl W. A., Remillard R. A., 2002, ATel 85
- [] Tomsick J. A., Corbel S., Fender R. P., Miller J. M., Orosz J. A., Tzioumis A. K., Wijnands R., Kaaret P., 2003, ApJ, 582, 933
- [] van der Laan H., 1966, Nature, 211, 1131
- [] Zdziarski A. A., Poutanen J., Mikolajewska J., Gierlinski M., Ebisawa K., Johnson W. N., 1998, MNRAS, 301, 435