Low frequency radio and X-ray properties of core-collapse supernovae
Abstract
Radio and X-ray studies of young supernovae probe the interaction between the supernova shock waves and the surrounding medium and give clues to the nature and past of the progenitor star. Here we discuss the early emission from type Ic SN 2002ap and argue that repeated Compton boosting of optical photons by hot electrons presents the most natural explanation of the prompt X-ray emission. We describe the radio spectrum of another type Ic SN 2003dh (GRB030329) obtained with combined GMRT and VLA data. We report on the low frequency radio monitoring of SN 1995N and our objectives of distinguishing between competing models of X-ray emission from this SN and the nature of its progenitor by X-ray spectroscopy. Radio studies on SN 2001gd, SN 2001ig and SN 2002hh are mentioned.
1 Introduction
The association of long duration Gamma Ray Bursts with core collapse supernovae is by now established with SN 2003dh (GRB030329) Hjo03 . Observational evidence supports the viewpoint that GRBs are energetic explosions like supernovae occuring in star formation regions and a large fraction of their energy is directed in relativisitic jets. Supernovae are known to be explosions of massive (and intermediate mass) stars, although the nature of the progenitor stars for varied supernova types remains an open subject.
A supernova explosion from the core collapse of a massive star drives a powerful shock wave into the circumstellar medium (CSM) of the progenitor. The shock wave with a speed approximately 1000 times larger than the speed of the progenitor star’s wind quickly probes the circumstellar medium established by the wind lost over many thousands of years before the explosion. Relativistic electrons and magnetic fields in the interaction region give rise to nonthermal radio emission. The interaction of a supernova shock with its surrounding medium produces X-ray emission probing the environment. Multiwaveband studies from radio and X-ray bands thus provide a handle on the past history of the parent star and the nature of the interaction region. Fingerprinting the exploded ejecta composition through X-ray spectroscopy Zim03 can give clues to the mass of the exploding star (e.g. in SN 1998S Poo02 ).
In this paper, we discuss several supernovae: SN 2002ap – a ‘hypernova’ of type Ic associated with GRBs that had no GRB counterpart; another type Ic ‘hypernova’ SN 2003dh which was associated with GRB030329; and several other supernovae such as: SN 2001gd, SN 2001ig and SN 2002hh. We also mention how upcoming X-ray spectroscopic studies of SN 1995N will help discriminate between the sites of observed X-ray emission.
2 ‘Hypernova’ SN 2002ap: nature of its X-ray emission
SN 2002ap showed early (‘prompt’) X-ray and radio emission. It was a nearby () and optically bright ( upon discovery by Y. Hirose as in Nak02 ) supernova. The broad spectral features in the optical (thus the name ‘hypernova’) and a subsequent modeling of its spectroscopic and photometric data (Maz02 ) suggested that it was energetic: .
XMM-Newton observed SN 2002ap with the EPIC X-ray cameras and the Optical Monitor for on Feb 2.0 – 2.4, 2002 UT, (day five after estimated explosion date Jan 28.0, 2002). A presupernova exposure of the field by Chandra X-ray Observatory on Oct. 19, 2001 revealed the presence of a nearby source about away from the supernova, and the contribution of this source was taken into account in our measurement of the day 5 SN X-ray flux: () (see Sut03 for details). Because the SN was very faint, both thermal bremsstrahlung model (, ) and a simple power law model (, photon index ) fit the sparse data equally well.
The earliest radio detection of SN 2002ap was days after the explosion, in the VLA 8.46 MHz band, and the frequency of the peak radio flux declined from 8.46 GHz to 1.43 GHz over a period of 10 days from the explosion date Ber02 . SN 2002ap was observed with the GMRT at 610 MHz 8.96 days after explosion and yielded upper limit of on Feb 5, 2002 Sut03 . The wavelength dependence of the radio turn-on shifting to longer wavelengths can be due to either free-free absorption or synchrotron self-absorption in the expanding circumstellar matter overlying the interaction region. We have fitted the VLA and GMRT data on 2002 Feb. 5.96 (day 8.96) to a SSA model, with photon index in the optically thin limit, implying that the radius of the radio photosphere on this day was and the magnetic field in the shocked ejecta was . The SSA prediction of flux at 610 MHz band is consistent with the GMRT upper limit.
The measured flux density of the SN 2002ap on day 5 corrected for absorption: versus from the radio bands to the X-ray band is shown in Fig 1. A single power-law with the photon index (from the radio spectrum) implies a flux density of only 58 picoJansky at 1 keV (corresponding to over the effective bandwidth) and fails to reproduce the observed X-ray flux. A synchrotron radiation spectrum from a single popoulation of relativistic electrons produces a power law spectrum with a steepening beyond the cooling frequency. For the relevant parameters determined from radio frequency spectral fits, this break should occur in the optical region. A spectrum with such a break (Fig 1) makes the observed radio and X-ray flux densities even more discrepant than that with a constant .
The observed X-ray flux by XMM-Newton could have been accounted for by the thermal free-free emission (Bremsstrahlung). However, with the reported high ejecta velocity ( on day 3.5) the implied temperature of the shocked ejecta and the circumstellar matter a flat tail of high energy photons upto about 100 keV would have resulted Fra82 (only a limited cool absorbing shell may have been present at this stage). By contrast, the observed X-ray emission is quite soft (e.g. thermal Bremsstrahlung temperature ). Even the reverse shock produced X-ray emission would be quite hard compared with observed colours unless the density gradient of the ejecta is extremely steep, – normally not found for relevant progenitors.
The most natural explanation of the observed X-ray flux and spectral features is the (repeated) Compton scattering of hot electrons off optical photons from the photosphere at . Detailed Monte Carlo simulations of the repeated Compton scatterings have been performed by Poz77 . The Compton flux is approximately related to the optical flux by Fra82 ,Che94 :
where the optical depth and the energy index are:
We note that on day 5 the unabsorbed X-ray and optical flux densities derived from XMM and ground based observations imply a multiwaveband power-law index (somewhat steeper than the XMM-band index ) and a logarithm of the ratio of flux densities of . Typical electron temperature required of Comptonizing plasma is for optical depths in the range for progenitor scenarios such as Wolf-Rayet stars or interacting binaries involving Roche lobe overflow from a helium star. Such temperatures are well wihin the range of hot circumstellar gas even for the modest velocities of .

3 SN 1995N, SN 2003dh and other supernovae
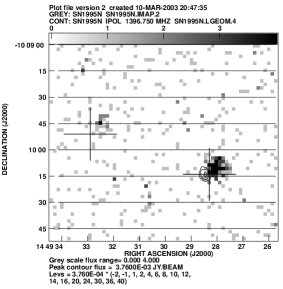
SN 1995N was a type IIn supernova that exploded in the galaxy MCG-2-38-017. We have detected SN 1995N a number of times with the GMRT. Its low frequency radio flux is very slowly declining (1420 MHz band flux: on 8 Nov 2000 and on 21 Sep 2002; in 610 MHz band on 16 Sep 2002). Of the 19 supernovae Imm02 that have been detected in the X-ray bands SN1995N appears at the high end of the X-ray luminosity ( Fox00 ). There is indication of short term variations of its X-ray luminosity in the Rosat and ASCA observations. The Rosat HRI X-ray image is overlaid with the GMRT 1400 MHz band radio map of the region around SN 1995N in Fig. 1. Here the cross on the lower right is the position of the supernova while that on the left is the galactic centre. The question of variation of its X-ray flux will be addressed by our Chandra/XMM observations in the current cycle. X-ray line-widths can also distinguish between the models of emission by ejecta gas struck by the reverse shock Che94 or the radiative cooling of shocked dense clouds crushed by the strongly shocked circumstellar wind Chu93 . Nucleosynthetic fingerprinting through X-ray spectra will assist in determining the progenitor star mass.
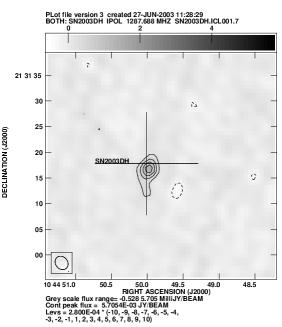
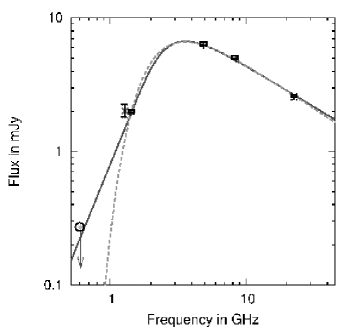
In contrast, SN 2003dh was an energetic type Ic supernova (a hypernova, with an large expansion velocity and estimated total isotropic energy release ) that was spatially and temporally coincident with a GRB030329 at a redshift of . We observed SN 2003dh with the GMRT in the 1280 MHz band and on June 17, 2003 in the 610 MHz band. The image of the region containing the SN is shown in Fig. 2. The flux of the SN was in the 1280 MHz band on 13 Jun 2003. The SN was not detected in the 610 MHz band. We have combined our data with VLA measurements reported by Berger et al Ber03 (June 4.01, 2003); the resultant spectrum is hown in Fig. 2. The spectrum is consistent with both free-free and synchrotron self-absorption (SSA) models. For the SSA model, the best fit parameters are: and . This is a relatively high field for the radio emission region since for other supernovae like SN 1998bw fields such as these are encountered much earlier.
In the GMRT 1420 MHz band observations, SN 2001gd (IIb) brightened marginally from to while SN 2001ig (also type IIb) dimmed between to . The 1400 MHz flux of SN 2002hh (type II) on 27Dec2002 was . We thank the staff of XMM-Newton and GMRT (NCRA-TIFR) that made these observations possible.
References
- (1) E. Berger, S. R. Kulkarni, G. Pooley et al.: Nature , astro-ph/0308187 (2003)
- (2) E. Berger, S. Kulkarni, R. A. Chevalier: Ap. J. 577, L5 (2002)
- (3) R. A. Chevalier, C. Fransson: Ap. J. 420, 268 (1994)
- (4) N. N. Chugai: Ap. J. 414, L101 (1993)
- (5) D. W. Fox, W. H. G. Lewin, A. Fabian, et al.: MNRAS 319, 1154 (2000)
- (6) C. Fransson: A. & A. 111, 140 (1982)
- (7) J. Hjorth, J. Sollerman, P. Moller et al: Nature 423, 847 (2003)
- (8) S. Immler, W. H. G. Lewin: Supernovae and Gamma-Ray Bursts, ed by K. Weiler(Springer 2002), astro-ph/0202231
- (9) P. Mazzali et al Ap. J. 572, L61 (2002)
- (10) S. Nakano, R. Kushida, W. Li: IAU Circular 7810, (2002)
- (11) D. Pooley et al: Ap. J. 572, 932 (2002)
- (12) L. Pozdnyakov, I. Sobol, R. Sunyaev: Sov. Astron. 21, 708 (1977)
- (13) F. Sutaria, P. Chandra, S. Bhatnagar, A. Ray: A. & A. 397, 1011 (2003)
- (14) H.-U. Zimmermann, B. Aschenbach: A. & A. 406, 969 (2003)
Index
- paragraph §3