Dramatic X-ray Spectral Variability of the Broad Absorption Line Quasar PG 2112+059
Abstract
With a 1999 ASCA observation, PG 2112+059 became notable as the first Broad Absorption Line (BAL) quasar found to exhibit a typical radio-quiet quasar X-ray continuum underlying a large amount of intrinsic absorption. We present a recent Chandra ACIS-S3 observation of PG 2112+059 that demonstrates remarkable spectral and luminosity variability since that time. In addition to a decrease in the continuum normalization by a factor of , the absorption column density has apparently increased substantially, and a strong feature in the Fe K region has appeared. Concurrent HST STIS data compared with archival HST data from earlier epochs show evidence for variability of the continuum (up to a factor of in the ultraviolet), and in some absorption features of the C iv1549 BAL since 1992; however, the O vi BAL structure is consistent with a 1995 observation. We also present evidence for Ly–O vi1037.62 and Ly–N v1242.80 line-locked absorption systems, supporting the assumption that ultraviolet line pressure is driving the BAL outflow. Whereas ultraviolet BALs typically exhibit only modest equivalent-width variability over timescales of years, the dramatic X-ray variability of PG 2112+059 suggests that X-ray spectral variability studies of BAL quasars have great potential for probing the physics of quasar winds.
1 Introduction
Recent studies of the strong correlations between supermassive black hole (SMBH) masses and the properties of their hosts’ galactic bulges (e.g., Ferrarese & Merritt 2000; Gebhardt et al. 2000) demonstrate clearly the intimate interrelation between the growth of SMBHs and their host galaxies. This connection implies a physical mechanism for regulating the coeval development of these structures. During much of their accretion phases, SMBHs reveal themselves as luminous quasars (e.g., Yu & Tremaine 2002), and thus quasar winds are likely to provide an important source of feedback during the coeval growth of SMBHs and their hosts’ galactic bulges (e.g., Fabian 1999). These winds are directly observed in the population of Broad Absorption Line (BAL) quasars, which exhibits deep, broad absorption lines from high-ionization ultraviolet (UV) resonance transitions. BALs arise when our line of sight passes through thick material flowing outward from the nuclear region at speeds up to 0.03–0.3. Though BAL quasars typically compose of the population in optically selected surveys, a recent analysis of the survey criteria for the Large Bright Quasar Survey, taking into account selection biases against the BAL quasar population, concluded that the true fraction of BAL quasars in the radio-quiet quasar population is (Hewett & Foltz 2003); Reichard et al. (2003) reached a similar conclusion based on the Sloan Digital Sky Survey BAL quasar sample. Furthermore, spectropolarimetry, statistics from gravitational lensing, and theoretical arguments support this higher intrinsic BAL quasar fraction (e.g., Goodrich 1997; Chartas 2000; Krolik & Voit 1998). Therefore, BAL quasars are not exotic objects but rather provide an opportunity to study powerful gas outflows that are likely present in typical quasars (e.g., Weymann et al. 1991).
The presence of UV BALs is generally accompanied by extreme weakness in soft X-rays as a result of intrinsic absorption with spectroscopically measured column densities typically in the range of (1–50) cm-2 (e.g., Green et al. 2001; Gallagher et al. 2002). Conversely, X-ray-weak Active Galactic Nuclei (AGNs) often show evidence for UV absorption, though not necessarily BALs (e.g., Brandt et al. 2000). While significant X-ray and UV absorption invariably occur in concert, the absorber properties do not always agree. For example, the column density implied from the X-ray observation of the BAL quasar PG 0946301, cm-2 (Mathur et al. 2000), is significantly larger than the best estimates from detailed UV absorption-line studies ( cm-2; Arav et al. 2001). Furthermore, among BAL quasars, there are no obvious trends relating the particulars of the UV absorption-line properties to the magnitude of the observed weakness in X-rays (Gallagher et al. 2003). Such a correspondence between X-ray and UV absorption properties might be expected based on theoretical quasar disk-wind models (e.g., Murray et al. 1995) and also on observations of Seyfert galaxies where high-resolution X-ray spectroscopy has revealed that the ionized absorbers seen in the X-ray regime often share kinematic properties with the UV-absorbing outflows (e.g., Kaspi et al. 2002; Gabel et al. 2003). However, at present it is unclear if Seyfert ionized-absorber outflows are distinct from or belong to a continuum of winds that extend to the energetic BAL outflows in luminous quasars (though see Laor & Brandt 2002 for a discussion of this issue).
Though a high-resolution X-ray gratings observation of a BAL quasar would offer a direct kinematic test of the connection between the velocity structure seen in X-ray and UV absorption, the X-ray faintness of this population makes such an observation expensive. Simultaneous X-ray/UV variability studies offer an alternative means of investigation. A clear demonstration of absorption variability in one wavelength regime without corresponding changes in the other would provide strong evidence that the two absorbers are distinct. Conversely, corresponding changes in both X-ray and UV absorption would support an X-ray/UV absorber connection. Understanding the relationship between X-ray and UV absorption is essential for constraining important physical parameters, in particular the mass-outflow rate from the central engine. The mass-outflow rate determines the kinetic influence of quasar activity on star formation in the host galaxy as well as the quasar contribution to the enrichment of the intergalactic medium with metals.
An excellent target for a variability study is the UV-bright, BAL quasar PG 2112+059 which has shown significant variability in both the UV continuum and X-ray in the past (Gallagher et al. 2001). This quasar is one of the most luminous low-redshift () Bright Quasar Survey objects with ( km s-1 Mpc-1, , and are assumed throughout), and it has a broad-band optical polarization of (Berriman et al. 1990). HST spectra revealed broad, shallow C iv absorption making this a BAL quasar with a balnicity index of km s-1 (Jannuzi et al. 1998; Brandt et al. 2000), well above the lower limit that defines the class (Weymann et al. 1991). There are no spectra in the literature that cover the Mg ii region, and so it is not known if PG 2112+059 has broad Mg ii absorption lines (see Boroson & Meyers 1992 for further discussion of Mg ii BAL quasars). However, the lack of Al iii absorption (which often accompanies Mg ii) suggests that PG 2112+059 does not have low-ionization BALs. PG 2112+059 was detected in soft X-rays with ROSAT (Brandt et al. 2000) which is unusual for a BAL quasar (Kopko et al. 1994; Green & Mathur 1996). With the 1999 Oct 30 ASCA data, it was the first BAL quasar shown to have an X-ray continuum typical of radio-quiet quasars underlying intrinsic absorption. PG 2112+059 showed significant spectral and flux variability between the 1991 Nov 19 ROSAT and the ASCA observations (Gallagher et al. 2001).
With the high X-ray flux measured with ASCA as well as its history of X-ray variability, PG 2112+059 was a natural target for a coordinated X-ray/UV spectral study to investigate the relationship between absorption in the two regimes. In this paper, we present the results from joint Chandra/HST observations of PG 2112+059 taken on 2002 September 1. For reference, the dates of the multiwavelength observations presented in this paper are presented in Figure 1.
2 Observations and Data Analysis
2.1 Chandra Analysis
On 2002 September 1, PG 2112+059 was observed with the Chandra X-ray Observatory (Weisskopf et al. 2002) ACIS-S3 detector (Garmire et al. 2003) in subarray mode to reduce the possibility of photon pile up. The data were processed using the standard Chandra X-ray Center pipeline software from which the level 1 events file was used. The data were then reprocessed using acis_process_events to remove pixel randomization and filtered on good time intervals, good ASCA grades (0, 2, 4, 5, 6), and good status (ignoring the bits indicating afterglow events, which include some source X-rays). The source spectrum was extracted from a circular region with a radius; the background spectrum was taken from an encircling annulus with an inner radius of and an outer radius of . For spectral analysis, the redistribution matrix file (rmf) and auxiliary response file (arf) were generated using the standard CIAO 2.2 software, and the arf was then corrected for the time-dependent degradation in low-energy quantum efficiency using acis_abs.111See http://cxc.harvard.edu/cont-soft/software/ACISABS.1.1.html.
Eight keV typically defines the upper limit of the ACIS energy band as the effective area of the High Resolution Mirror Assembly drops sharply at this energy; however, in the 7–8 keV band, only two counts were within the source region. Therefore PG 2112+059 is not detected above 7 keV. We ignore data below 0.5 keV due to calibration uncertainties. We collected 841 photons in the 0.5–7.0 keV band for a count rate of ct s-1. PG 2112+059 was the brightest point source detected within the ACIS subarray field of view; the next brightest source was away with 60 full-band counts. The PG 2112+059 radial profile appears consistent with that of a point source, and the Chandra position is within of the NED222NASA Extragalactic Database, http://nedwww.ipac.caltech.edu. optical position. There were no background flares, and the quasar showed no significant variability during the 56.868 ks observation.
Based on our best-fitting ASCA model, we had predicted a Chandra ACIS-S3 count rate of 9.5 ct s-1, more than a factor of six larger than observed. This large discrepancy is much greater than the ASCA/ACIS cross-calibration uncertainties; ASCA and ACIS-S3 fluxes agree to within in the 1–10 keV bandpass (e.g., Snowden 2002). Therefore, PG 2112+059 varied significantly between the ASCA and Chandra observations. Figure 2a illustrates this point with the best-fitting ASCA model convolved with the ACIS-S3 reponse overplotted on the current ACIS-S3 data. Relative to the ASCA model, the Chandra spectrum appears flatter across the 0.5–7.0 keV band pass. Quantitatively, the gross spectral shape can be approximated with a power law with the exception of a feature near the Fe K line energy of 6.4 keV evident in the ratio plot.
As a first attempt to fit the Chandra data, we used the X-ray spectral-fitting software XSPEC 11.2 (Arnaud 1996) and applied the following model from the 1999 ASCA analysis (Gallagher et al. 2001): Galactic absorption ( cm-2), intrinsic neutral absorption ( cm-2), and a power law ().333The ASCA best-fitting model parameters have been adjusted from Gallagher et al. (2001) to account for the degradation of the low-energy quantum efficiency of the SIS detectors. See http://heasarc.gsfc.nasa.gov/docs/asca/calibration/nhparam.html for further details. Even allowing the normalization to vary freely did not provide a statistically acceptable fit (). The intrinsic neutral column density as well as the power-law photon index were then allowed to vary. Again, the fit was unacceptable () with clear systematic residuals near the Fe K region and below keV in the observed frame. The ASCA data could also be fit with either ionized absorber or partial-covering neutral absorber models (though neither was significantly preferred over a simple neutral absorber), and so we applied the XSPEC models absori and zpcfabs independently, for an ionized and partial-covering absorber, respectively. The absorption and continuum parameters were free to vary. While each of these fits offered improvements over a simple neutral absorber ( and for ionized and partial-covering absorption, respectively), clear positive residuals near the Fe K region indicated that another component was required. We thus added a cosmologically redshifted gaussian emission line which improved the value significantly for both models. The for three additional parameters was 12.5/12.8 for the ionized/partial-covering absorber models. In both cases, this indicated a statistically significant improvement according to the -test at the confidence level. Given the final fit statistics, we slightly prefer the partial-covering absorber model. However, we caution that given the data quality, the best-fitting model should be taken as a basic parameterization of the spectrum rather than as a truly physical model. In fact, the intrinsic absorber is likely to be much more complex, and physical effects such as velocity dispersion and multi-zone ionization structure should be kept in mind. The Chandra data, best-fitting model, and residuals are presented in Figure 2b.
At the confidence level, taking all parameters to be of interest other than absolute normalization, the best-fitting continuum model parameters are the following: and cm-2, with an absorber covering fraction of . The rest-frame emission-line parameters are not as well constrained, and so we quote these errors at the confidence level: keV, keV, and eV. Note that allowing the width of the emission line to vary versus forcing the line to be unresolved improved the fit from to the final value of , which is significant at the confidence level. Furthermore, ignoring the observed-frame 4–5 keV region in the spectrum to ensure that the emission-line feature was not skewing the continuum fits resulted in best-fit values for , , and that were consistent with those listed above. If this emission line were present in the 1999 ASCA spectra with the same flux, it would have been below the detection threshold (EW eV) due to the much higher continuum normalization. The best-fitting spectral parameters from the partial-covering absorber model are listed in Table 1; for comparison, the values from fitting the same model to the 1999 ASCA data are also presented. The contours of versus for both epochs are shown in Figure 3; though the best-fitting intrinsic column density has increased significantly from 1999, remains consistent. This result is upheld with simultaneous fitting of the ASCA SIS and Chandra data.
This intriguing result from the partial-covering absorber model fitting that the intrinsic absorption column density had increased significantly over a period of years required additional investigation. To that end, we examined whether a simple change in ionization parameter rather than column density could account for the spectral changes by simultaneously fitting the ACIS-S3 and ASCA SIS0 and SIS1 data with the absori model. We excluded the ASCA GIS data from the fits as they are not sensitive below keV, the energy regime most important for constraining absorber properties. Given that the photon index was consistent between the two epochs, was tied together for all of the subsequent model fitting. The Chandra data between 4–5 keV were ignored to avoid confusion from the Fe feature. For completeness, both the intrinsic column density and the ionization parameter, erg cm s-1, were first tied together, and only the continuum normalization was allowed to vary. This resulted in an unacceptable fit, with =151.5/117. For Model 1, was freed to vary between the Chandra and ASCA epochs with a resulting fit statistic of =131.1/116. The residuals for the ASCA data were systematically negative below keV, and the best-fitting photon index was unusually flat for a luminous quasar: . For the subsequent fit (Model 2), the values for were tied together for both epochs, and the column density was allowed to vary between observations. This resulted in an improvement to =123.2/116 with a more plausible best-fitting . Finally, for Model 3, both and were allowed to vary independently for each epoch with a resulting fit statistic of =112.0/115. The best-fitting parameters from this joint fitting for Models 1, 2, and 3 are presented in Table 2. The substantial and significant increase in the intrinsic column density from 1999 to 2002 implied by the independent partial-covering absorber fitting is also supported by this ionized absorber joint modeling. The change in the low-energy spectrum is not consistent with a pure variation in ionization parameter. A simple increase in column density is acceptable statistically, though changes in both column density and ionization parameter are preferred. Interestingly, with Model 3 the Chandra data require a much more highly ionized absorber with erg cm s-1 than the ASCA data, which are consistent with a neutral gas. Given that the X-ray continuum normalization was significantly higher in 1999, this is contrary to expectation if the X-ray continuum tracks the ionizing continuum; the absorber would be expected to be more highly ionized in the presence of a stronger ionizing continuum. This suggests that a simple ionized absorber is not appropriate in this case.
The flat spectrum with an effective and strong Fe K emission are reminiscent of the reflection-dominated spectra often seen from Seyfert 2 galaxies. However, complex intrinsic absorption can fully account for the spectral shape; the best-fitting photon index, , though loosely constrained, is typical of a direct radio-quiet quasar continuum and consistent with the 1999 ASCA data (). Furthermore, the latest self-consistent, constant-density, ionized reflector models (Ross & Fabian 1993; Ballantyne et al. 2001) could not provide acceptable fits to both the continuum and Fe K emission feature at the same time. Therefore, in the hard band we are either directly observing the continuum in a low state or scattered emission from an efficient ionized “mirror” that preserves the continuum shape.
2.2 STIS Analysis
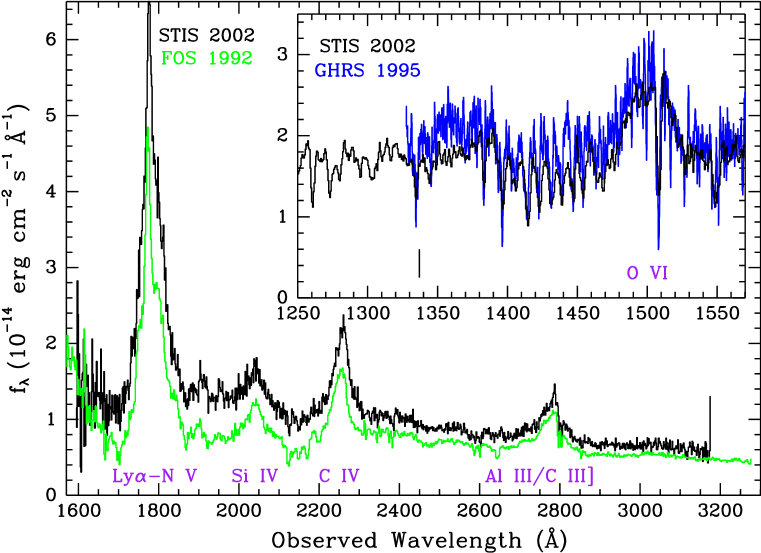
UV spectra of PG 2112+059 from 1140–3170 Å were obtained on 2002 September 1 with HST/STIS (Woodgate et al. 1998). Exposure times were 1100 s and 900 s using the G140L and G230L gratings, respectively, with the slit. The spectra have dispersions of Å/pix and Å/pix, respectively, providing resolving powers of =960–1440 for G140L and =500–1010 for G230L across the full wavelength range. The signal-to-noise ratio in the continuum ranged from 10 to 25 per pixel. Reductions were made with the standard STIS pipeline, which provides flux calibrations accurate to (Brown et al. 2002). The new STIS data are overplotted on the previous HST spectra in Figure 4. The 1995 GHRS data covering the O vi emission and absorption features appear to be consistent with the current G140L data, while the 1992 FOS data show a fainter and redder continuum compared with the current G230L data.
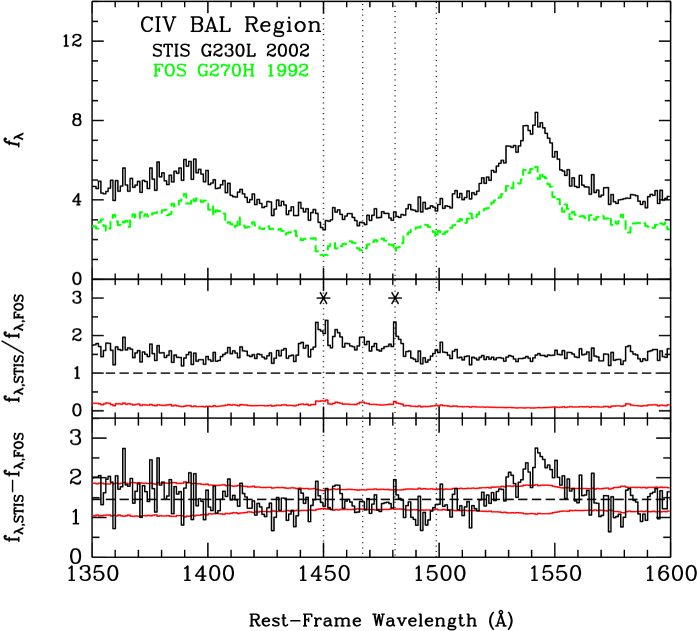
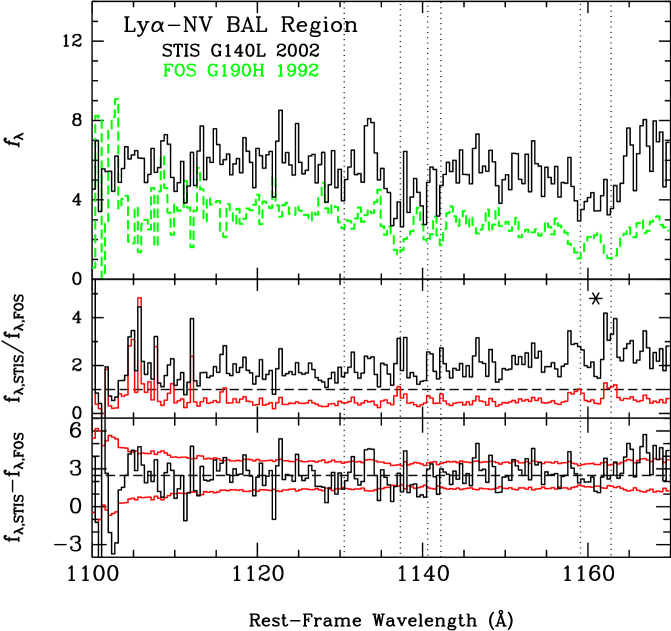
To investigate potential absorption variability in detail, we focused on the C iv, Ly–N v, and O vi absorption regions that are not confused with strong emission lines as is the case for the Si iv absorption region. First, the data from the previous epochs were convolved with the instrumental spread function and resampled to match the lower resolution of the 2002 STIS data. Next, wavelength shifts of 1, 2, and 3 pixels were applied to the FOS G270H, FOS G190H, and GHRS G140L spectra, respectively, to minimize the differences between previous and current epoch spectra. For all but the FOS G190H spectrum, these wavelength shifts were confirmed with interstellar absorption lines. To investigate potential variability, the spectra from the 2002 observation were divided by those from the previous epochs (see the middle panels of Figs. 5–7). The division plots illustrate changes in the equivalent widths of absorption features, which should appear as significant deviations from the mean level of the ratio plot. The cancellation of broad emission lines in the ratio spectra in Figures 5 and 7 indicates that the emission-line changes are consistent with their strengths varying in proportion to the changing continuum level.
In addition, the spectra from the earlier epochs were subtracted from the 2002 spectra as shown in the lower panels of Figures 5–7. This comparison is intended to test whether changes in absorption features seen in the ratio spectra are caused by the changing continuum level in the presence of an unvarying component. For example, BAL troughs frequently contain a contribution from an unabsorbed continuum (either from scattering or partial covering of the primary continuum) which can fill in the troughs and cause “non-black saturation” (e.g., Arav 1997). In this case, an increase in the unabsorbed continuum level while the absorbed component remained constant could result in an apparent change in the equivalent width, but such a change would not appear as a significant feature in the difference plot.
In Figure 5 covering the C iv spectral region, the continuum level has increased from 1992 to 2002 as can be seen clearly in the middle panel. The ratio of has a median value of . In addition, positive deviations from the mean are evident at 1450 and 1481 Å at the locations of two of the C iv absorption features (marked with asterisks in Fig. 5). The EWs of these two features have decreased from 1992 to 2002, at the same time that the continuum normalization has increased. These concurrent changes, a decrease in absorption EW accompanied by an increase in continuum normalization, are consistent with an increase in ionization that could reduce the opacity of individual features. However, these features are not present at a comparable significance in the difference spectrum shown in the lowest panel of this figure. This suggests that a constant-flux, absorbed component plus a varying, unabsorbed continuum could cause the EW changes in the troughs. As mentioned above, this unabsorbed component at the base of the trough could arise when an absorber is not physically large enough to cover completely the spatially extended continuum source. The flux from a source other than the direct continuum, e.g., continuum flux scattered into the line of sight, could also fill in the absorption troughs. This latter case is perhaps more likely, as an unabsorbed component from scattered light would be generated on larger spatial scales than the primary continuum and would therefore be expected to respond more slowly to changes in the primary continuum. A primary continuum partially covered by the absorber should rise and fall in concert with continuum changes.
The C iv absorption feature seen at rest-frame 1450 Å in Figure 5 has the same redshift as the 1159/1163 Å N v doublet marked with an asterisk in Figure 6. This N v component shows similar behavior: an apparently significant EW change is seen in the ratio spectrum without a correspondingly significant change in the difference plot. Unfortunately, the N v absorber corresponding to the C iv absorber at 1481 Å is not covered by the data in Figure 6.
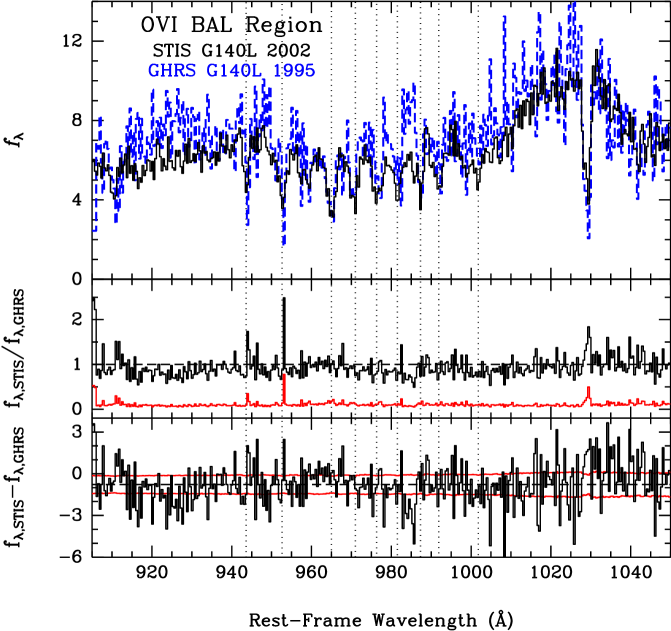
Figure 7 with the same plots comparing the O vi spectra from 1995 and 2002 does not demonstrate similarly significant deviations in the ratio spectrum. Though the continuum level has decreased by blueward of the O vi emission line, the absorption structure appears consistent between the two epochs, within the uncertainties. If the variability of the C iv absorption EW does reflect actual absorber changes, the constant level of the O vi absorption coupled with the changes in the C iv structure could indicate absorption variability between 1992 and 1995 with none between 1995 and 2002. However, the difference in ionization parameter probed by C iv and O vi could also allow a change in C iv absorption with little accompanying change in O vi, depending on the ionization structure of the absorbing gas. Unfortunately, the lack of concurrent spectral coverage of both C iv and O vi in the earlier epochs does not allow us to distinguish between these two possibilities. Furthermore, we have no information on the properties of the UV absorber in 1999 when the ASCA data were taken.
In order to investigate the velocity structure in these absorbing features, we also examined the GHRS and FOS G190H data at higher resolution. The GHRS data have 0.80 Å resolution and 0.143 Å/pixel, and so the data were binned by 5 pixels to increase the signal-to-noise ratio, still giving better resolution than STIS (a 2-pixel resolution of 1.2 Å for the STIS G140L grating). The FOS data have not been rebinned. The wavelength scale of the GHRS data was corrected by 1.00 Å, a shift derived from the GHRS wavelength calibration observation. This gave excellent agreement with the expected wavelengths of several interstellar lines.
Attributing the four dips in the broad C iv absorption trough to four C iv absorption systems leads to the identification of four Ly1025.72 – O vi systems at the same redshifts in the GHRS spectrum. The measured redshifts of the absorption systems could then be refined using the higher resolution of the GHRS spectrum, giving =0.371, 0.387, 0.402, and 0.418. These are given in Table 3 together with estimated 1 uncertainties and outflow velocities. Figure 8 shows details of the Ly – O vi, Ly – N v, and C iv absorbed regions. We show the positions of absorption lines corresponding to the above four redshifts, plotting the data on the same logarithmic wavelength scale so that the four systems show the same relative displacements in the three wavelength regions. The predicted wavelengths for Ly and N v are indicated in the middle panel.
The most striking wavelength coincidences of these four systems, as shown in the middle panel of Figure 8, are the overlap of N v1242.80 in system 1 and Ly in system 3. The same overlap is also seen with these lines in systems 2 and 4. System 1 is clearly present in the Ly – N v region, while the other systems are less obvious, though all four are evident in O vi absorption in the top panel. In the Ly – O vi region, O vi1031.93 of system 1 appears to coincide with Ly of system 2, and O vi1031.93 of system 3 may also overlap Ly of system 4.
This type of coincidence, known as absorption line locking, occurs when the relative Doppler shifts of gas at different distances from the continuum source are the same as the wavelength separation of two strong absorption lines. These systems then become locked into this velocity separation, as the system closer to the continuum source absorbs the photons that would continue to accelerate the more distant, higher velocity system (e.g., Scargle, Caroff, & Noerdlinger 1970; Mushotzky, Solomon, & Strittmatter 1972; Scargle 1973). We suggest here that these outflowing systems are locked in relative velocity by the coincidence of N v1242.80 and Ly lines, and possibly O vi1037.62 with Ly. Ly–N v line-locking of sub-troughs of BAL quasars has been discussed by Korista et al. (1993) and earlier, for example, by Turnshek et al. (1988) and Weymann et al. (1991). If this phenomenon is real it implies that the gas is physically stratified (e.g., system 1 is more distant than system 3), material within the BAL region is accelerating, and that radiation pressure plays an important role in the dynamics of the outflowing gas (Korista et al. 1993; Arav 1996).
The relative absorption strengths of the O vi doublets in systems 2, 3, and possibly 1, as well as the flat bottoms of the C iv troughs which are only partially resolved by FOS, suggest that these doublets are close to saturation. Further evidence for saturation may come from the Ly/Ly absorption ratio in system 1, which appears much closer to unity than to the optically thin ratio of 0.16. Given that these absorption troughs are not black, it is probable that there is a scattered-light component of the continuum in the O vi region, consistent with the results from the absorption-line variability analysis above. Higher resolution and signal-to-noise ratio data could well clarify the relationships between the wavelengths and strengths in these UV absorption-line systems. Spectropolarimetry would be invaluable for differentiating between the partial covering and scattered continuum interpretation. Scattered light is likely to be polarized resulting in some polarization of the overall spectrum. In particular, one expects a rise in the polarization level at the bottom of the UV absorption troughs as seen in a number of BAL quasars (e.g., Cohen et al. 1995; Goodrich & Miller 1995; Hines & Wills 1995). This approach holds promise for PG 2112+059 given its significant low level polarization in very broad band optical polarimetry (Berriman et al. 1990).
3 Results and Discussion
Between the 1999 ASCA spectra and the 2002 Chandra spectrum presented in this paper, the X-ray spectral shape and luminosity of PG 2112+059 have varied dramatically. From the best-fitting partial-covering absorber models, the change in the continuum shape at low energies can be explained by a significant increase in the intrinsic column density (see Figure 3), while the underlying X-ray power-law photon index remained constant within the statistical errors. This basic conclusion is not model-dependent; jointly fitting the ASCA SIS and Chandra data with ionized-absorber models resulted in the same conclusion (see Table 2). Figure 9 shows the ionized and partial-covering absorber models which best fit the data from both epochs. While the power-law photon indices are consistent between the two observations, the best-fitting 2002 continuum normalization is of the 1999 level. The absorption-corrected, rest-frame 2.0–10.0 keV luminosity, , thus dropped by a factor of while the absorbing column density increased (see Table 1). In addition, structure in the Fe K region is now evident, consistent with a broad, neutral emission line with rest-frame EW=580–1570 eV. A feature with this flux would not have been detectable in the 1999 ASCA data given the high level of the continuum.
Comparison of the UV data from 2002 with the two previous epochs, 1992 and 1995, also reveals variability, but on much more modest scales than seen in the X-ray. The C iv region observed in 1992 and 2002 shows evidence for small equivalent width decreases in individual absorption features, while the O vi spectra taken in 1995 and 2002 do not show significant evidence for absorption feature changes. Over the course of a decade, the UV continuum luminosity varied as well; between 1992 and 2002 the UV continuum redward of Ly became bluer and brighter. Most of this increase in continuum luminosity could have occured between 1992 and 1995 as the 1995 continuum blueward of the Ly emission line is within of the 2002 level.
3.1 Implications of Variability for X-ray and UV Absorbers
Given the present data quality, translating the significant empirical changes into physical understanding is challenging. Unfortunately, there are no UV observations simultaneous with the 1999 ASCA observations, and so we cannot rule out significant changes in the UV absorption properties between 1999 and 2002. However, the concurrent lack of UV absorption-line or large-scale continuum variability from the 1995 GHRS to the 2002 STIS observations is worth noting. The comparison of these data with the current STIS data is particularly relevant as 1995 is closer in time to the 1999 ASCA observation and the continuum level in 1995 is more consistent with the 2002 level. As seen in Figure 4, there is no evidence for Ly edge absorption in the 2002 STIS G140L spectrum. This puts an upper limit on the column density of neutral hydrogen obscuring the UV continuum of cm-2 or perhaps a few times larger in the case of partial covering. However, the best-fit values for the X-ray absorbing column densities during both the ASCA and Chandra epochs are 5–6 orders of magnitude larger. Either a highly ionized X-ray absorber or an X-ray absorber that does not obstruct the UV continuum could explain this discrepancy.
Though UV BAL studies are notoriously unreliable for constraining absorber column density if partial covering is not properly taken into account (e.g., Arav 1997), a column density increase by a factor of as indicated by our X-ray spectral fitting would likely have some effect on the UV absorption lines if the X-ray and UV absorption arise in the same gas. The isolated, large-scale X-ray variability thus suggests the presence of an X-ray absorber distinct from the UV absorber in PG 2112+059. However, without concurrent X-ray and UV data from more than one epoch, this claim remains speculative. If the bulk of the X-ray absorption is distinct, it could arise in the “shielding gas” postulated in the disk-wind models of Murray et al. (1995). In this picture, the broad emission lines and the BALs are produced in the same material at radii of a few light days with the shielding gas at smaller distances from the SMBH. This may be typical in BAL quasars; the recent detection of relativistically blueshifted X-ray absorption lines in the BAL quasars APM 08279+5255 and PG 1115+080 (Chartas et al. 2002; Chartas, Brandt & Gallagher 2003), unmatched in velocity with UV absorption lines, also supports this picture.
The four UV absorption systems identified in §2.2 demonstrate, if the line locking is real, that radiative forces play a role in the dynamics of the outflow. In particular, Lyman series, O vi, and N v line pressure was probably important for accelerating the gas, otherwise the systems would not have become locked when these wavelength coincidences occured. However, the Ly–N v1242.80 and Ly–O vi1037.62 line pairs are only two line-locked pairs of many other possibilities among UV resonance lines, and so they may only contribute a small part of the total radiation force (e.g., Korista et al. 1993). If we speculate that the structure seen in BAL troughs is caused by systems locked into a complex network by many absorption-line pairs, then the UV BAL velocity structure might be expected to be extremely stable, even in the presence of a varying continuum. Confirmation of a change in velocity of an X-ray BAL such as those detected in APM 08279+5255 or PG 1115+080 (if line locking plays such a significant role in UV BAL structure) would then suggest two intriguing possibilities: (1) the X-ray absorption is occuring in gas as it is being accelerated, before the system has become line locked, or (2) the X-ray absorbers are being driven by Compton pressure where line locking would not occur. In the latter case, the X-ray absorbers would be distinct from the UV BAL gas.
3.2 Iron Emission
The combination of the apparent width ( keV) and equivalent width (EW= eV) derived from modeling the Fe emission line in PG 2112+059 is notable. Intrinsically broad lines are typically associated with emission from the inner accretion disk; however, the EWs of such features are expected to be eV (e.g., Matt et al. 1992). Empirically, the mean for such lines has been found to be higher, eV (e.g., George et al. 2000), though still significantly less than we observe for PG 2112+059. Therefore, if the line in PG 2112+059 is intrinsically broad, this is hard to reconcile with its large EW. Furthermore, a time-delay scenario in which a previously strong continuum has illuminated material whose emission is now more apparent as the continuum level has decreased is unlikely with the small scales ( light hours) of the inner disk. The Fe emission from that region would react on short time scales to a diminution of the direct continuum, and so a broad, high-EW line from this region would be unlikely.
In contrast, large EW Fe lines are common features of Seyfert 2 X-ray spectra with Compton-thick obscuration to the direct continuum (e.g., George & Fabian 1991; Matt, Brandt, & Fabian 1996; Turner et al. 1997). In this case, reflection of direct X-rays off optically thick material usually associated with the torus results in a Compton-reflection hump and narrow, fluorescent Fe K emission with large EW. Therefore, an alternative picture to an intrinsically broad line is that the apparent breadth of the line arises from unresolved, narrow Fe K lines from many ionization states. Given the limited statistics and CCD resolution, this scenario is plausible from the positive residuals above rest-frame 6.4 keV in Figure 2, though the apparent lack of a strong reflection continuum (see §2.1) is problematic unless the optically thick reflector is highly ionized. Given the larger spatial scales on which the narrow emission lines are believed to arise, a time-delay scenario makes more sense. If this is the case, then the current Fe K emission is reflecting the previously strong level of the continuum as was seen in the Seyfert galaxies NGC 2992 and NGC 4051 during low continuum states (e.g., Weaver et al. 1996; Guainazzi et al. 1998). In this situation, the Fe K line strength would be expected to diminish over time; therefore X-ray monitoring of this source has the potential to constrain the spatial scale of any reflecting medium in this luminous quasar.
3.3
X-ray spectroscopy of BAL quasars has indicated that they have typical radio-quiet quasar X-ray continua and spectral energy distributions in which soft X-rays are depressed due to intrinsic absorption. The power in the X-ray regime relative to the UV continuum is parameterized using the quantity =0.384 , where the flux densities, , are measured at the rest-frame frequencies as labelled. To calculate , the flux density at rest-frame 2200 Å (observed-frame 3225 Å) was estimated by extrapolating a short distance () along the continuum from the long-wavelength end of the HST STIS spectrum. From that point, the flux density at rest-frame 2500 Å was calculated using the Sloan Digital Sky Survey composite quasar spectral slope, (Vanden Berk et al. 2001). We chose this extrapolation to avoid potentially significant contamination from a complex of blended Fe ii emission lines around 2500 Å, and this value for the spectral index is consistent with the observed UV continuum. The rest-frame 2 keV (observed-frame 1.36 keV) flux density is determined from a local continuum fit to the Chandra data. Based on these simultaneous X-ray and UV data of PG 2112+059, the observed value of = is within the normal range for BAL quasars (2.6 to 1.9; e.g., Gallagher et al. 2003; Green et al. 2001). However, correcting the X-ray spectrum for the intrinsic absorption from the best-fitting partial-covering absorber gives a “corrected” =. In contrast, the value calculated from the absorption-corrected 1999 ASCA spectra and the 1992 HST FOS data, , suggested much stronger (a factor of ) X-ray emission relative to the UV continuum, though the 1992 UV data were not simultaneous with the ASCA observation.
As can be seen in Figure 4, the continuum flux densities at rest-frame 2200 Å (observed-frame 3225 Å) in both epochs are very similar, and so the decrease in is dominated by the decrease in X-ray flux. For comparison, normal radio-quiet quasars of this luminosity typically have (see eq. 4 of Vignali et al. 2003). The change in of over the -yr time span is thus still within the spread for normal radio-quiet quasars, though 2002 is at the weak end of the distribution. At this point, it is unclear whether the 1999 ASCA spectra or the 2002 Chandra data are more representative of the “normal” state of the quasar continuum in PG 2112+059. If the 1999 ASCA data are more representative, then PG 2112+059 might return to this emission level at any time. At least one BAL quasar, PG 1254047, was argued to be intrinsically X-ray-weak in addition to suffering from heavy X-ray absorption (Sabra & Hamann 2001). Though the X-ray data quality in that particular case was poor (only photons), it is quite possible that the strength of the X-ray continuum of that source varies as well. Probing the timescale and interplay of X-ray continuum and absorption variability requires additional monitoring observations of sources with demonstrated variability such as PG 2112+059.
3.4 Comparison of the Bolometric and Eddington Luminosities
In contrast to the conclusion drawn by Weymann et al. (1991) that all quasars are likely to have BAL regions, others have suggested that the BAL phenomenon may instead be a manifestation of an evolutionary phase, perhaps of enhanced accretion rate (e.g., Hazard et al. 1984; Becker et al. 2000). To investigate this issue for PG 2112+059, we estimated the bolometric luminosity as a fraction of the Eddington luminosity, , to determine if PG 2112+059 is an outlier in the distribution of unabsorbed radio-quiet quasars. From -band imaging, Fynbo et al. (2001) measure for the apparent magnitude of the luminous elliptical host galaxy which corresponds to an absolute magnitude of (in the observed-frame Cousins band). After converting to the rest-frame -band luminosity (including the appropriate and color-corrections for elliptical galaxies from Table 3 of Fukugita et al. 1995), we obtain an estimate of the black hole mass of =8.8 (using eq. 7 from Laor 2001). To estimate the black hole mass from the optical spectroscopic properties of the quasar, we utilize and H FWHM and eq. 3 in Laor (1998) to obtain =6.8. Both of these mass estimates have significant systematic uncertainties, perhaps as large as a factor of (e.g., Laor 1998; Vestergaard 2002). However, it is notable that these two completely independent methods give comparable estimates of the black hole mass.
Using the bolometric correction from the 2500 Å monochromatic luminosity for radio-quiet quasars of 6.3 (as calculated empirically by Elvis et al. 1994), we estimate a bolometric luminosity for PG 2112+059 of erg s-1 based on measured from the 2002 STIS spectrum as described in 3.3. Combining these values with the log average of the black hole mass estimates, =7.7, gives an Eddington ratio of . Comparison of this rough value with those of similarly luminous quasars in the sample accumulated by Woo & Urry (2002, see their Figure 8) indicates that PG 2112+059 does not have an anomalously high Eddington ratio at present. Similarly, Yuan & Wills (2003) found that the Eddington ratios of a sample of BAL and non-BAL quasars were consistent.
3.5 Future Work
The lack of variability in the velocity structure of UV BALs on timescales of years is one of the most serious challenges to the current disk-wind models (e.g., de Kool 1997). While changes in the depths of individual absorption-line features have been seen, this EW variability is typically ascribed to changing ionization structure within the absorbing gas (e.g., Barlow et al. 1992). Such a change in ionization is consistent with the decrease in the depth of C iv absorption features we detected during an epoch when the UV continuum increased in normalization as well as became bluer. In contrast, changes in velocity of individual absorption components are almost unknown. However, the most comprehensive absorption-line variability investigation to date, the 3-yr study by Barlow (1993), was not long enough for a conclusive test; the hydrodynamic wind models of Proga et al. (2000) generated instabilities on rest-frame timescales of yr. With longer time baselines, velocity increases have been claimed for at least one BAL quasar, Q1303308 (Vilkoviskij & Irwin 2001), and an extended study is warranted to investigate this issue further. With high-quality UV coverage now extending from 1992 to 2002, almost seven years in the quasar rest-frame, PG 2112+059 is an excellent candidate for continued monitoring of its BAL structure.
The large gaps in coverage of PG 2112+059 over the last decade, illustrated in Figure 1, have limited our ability to interpret its multiwavelength variability. Additional epochs of simultaneous X-ray/UV monitoring will contribute to understanding the connection between X-ray and UV absorption in BAL quasars. The detection of four narrow, probably line-locked absorption systems indicates that high resolution UV spectroscopy covering these features would enable a more detailed investigation into the partial covering properties of these UV absorption systems, for comparison with the partial covering of the X-ray gas. Furthermore, if the bulk of the X-ray absorbing gas lies at smaller radii than the UV BAL gas, then the X-ray absorbers might be expected to vary, in ionization state, column density, and velocity, on more rapid timescales than the UV BALs. There are now examples of BAL quasars with evidence for X-ray absorption variability: PG 2112+059, APM 08279+5255, and perhaps PG 1115+080 (Chartas 2000; Chartas et al. 2003). These three objects compose a significant fraction of the handful of BAL quasars that have X-ray data adequate for variability studies; this demonstrates that the X-ray regime may be a fertile area for exploring details of quasar winds inaccessible in the UV.
Furthermore, to interpret X-ray variability accurately, the hydrodynamic disk-wind models (e.g., Proga et al. 2000) may need to be extended to smaller radii ( cm) with higher resolution, and they must also more explicitly include the effects of Compton and X-ray edge and line pressure. For the highly ionized gas expected at small radii, these will dominate the radiation force over UV line pressure (Chelouche & Netzer 2003b, a). More appropriate models for low-energy absorbers which include the potentially substantial opacity from velocity-broadened X-ray BALs are also required. This line opacity could be comparable to the edge opacity in certain cases. Additional items for an X-ray observer’s wish list from theoretical modeling are specific predictions for the strength, profiles, and variability properties of iron emission and absorption lines.
References
- Arav (1996) Arav, N. 1996, ApJ, 465, 617
- Arav (1997) Arav, N. 1997, in ASP Conf. Ser. 128: Mass Ejection from Active Galactic Nuclei, eds. N. Arav, I. Shlosman, & R. J. Weymann, 208
- Arav et al. (2001) Arav, N., et al. 2001, ApJ, 561, 118
- Arnaud (1996) Arnaud, K. A. 1996, in ASP Conf. Ser. 101: Astronomical Data Analysis Software and Systems V, eds. G. Jacoby & J. Barnes, vol. 5, 17
- Ballantyne et al. (2001) Ballantyne, D. R., Iwasawa, K., & Fabian, A. C. 2001, MNRAS, 323, 506
- Barlow (1993) Barlow, T. A. 1993, Ph.D. thesis, University of California, San Diego, (1994,{PASP˝,106,548)
- Barlow et al. (1992) Barlow, T. A., Junkkarinen, V. T., Burbidge, E. M., Weymann, R. J., Morris, S. L., & Korista, K. T. 1992, ApJ, 397, 81
- Becker et al. (2000) Becker, R. H., White, R. L., Gregg, M. D., Brotherton, M. S., Laurent-Muehleisen, S. A., & Arav, N. 2000, ApJ, 538, 72
- Berriman et al. (1990) Berriman, G., Schmidt, G. D., West, S. C., & Stockman, H. S. 1990, ApJS, 74, 869
- Boroson & Green (1992) Boroson, T. A. & Green, R. F. 1992, ApJS, 80, 109
- Boroson & Meyers (1992) Boroson, T. A. & Meyers, K. A. 1992, ApJ, 397, 442
- Brandt et al. (2000) Brandt, W. N., Laor, A., & Wills, B. J. 2000, ApJ, 528, 637
- Brown et al. (2002) Brown, T., et al. 2002, in HST Data Handbook for STIS, version 4.0, ed. B. Mobasher (Baltimore: Space Telescope Science Institute), http://www.stsci.edu/hst/stis/documents/handbooks/DataHandbookv4/
- Chartas (2000) Chartas, G. 2000, ApJ, 531, 81
- Chartas et al. (2003) Chartas, G., Brandt, W. N., & Gallagher, S. C. 2003, ApJ, 595, 85
- Chartas et al. (2002) Chartas, G., Brandt, W. N., Gallagher, S. C., & Garmire, G. P. 2002, ApJ, 579, 169
- Chelouche & Netzer (2003a) Chelouche, D. & Netzer, H. 2003a, MNRAS, in press (astro-ph/0306513)
- Chelouche & Netzer (2003b) — 2003b, MNRAS, in press (astro-ph/0306512)
- Cohen et al. (1995) Cohen, M. H., Ogle, P. M., Tran, H. D., Vermeulen, R. C., Miller, J. S., Goodrich, R. W., & Martel, A. R. 1995, ApJ, 448, L77
- Corbin & Boroson (1996) Corbin, M. R. & Boroson, T. A. 1996, ApJS, 107, 69
- de Kool (1997) de Kool, M. 1997, in ASP Conf. Ser. 128: Mass Ejection from Active Galactic Nuclei, eds. I. Shlosman & R. J. Weymann, 233
- Elvis et al. (1994) Elvis, M., et al. 1994, ApJS, 95, 1
- Fabian (1999) Fabian, A. C. 1999, MNRAS, 308, L39
- Ferrarese & Merritt (2000) Ferrarese, L. & Merritt, D. 2000, ApJ, 539, L9
- Fukugita et al. (1995) Fukugita, M., Shimasaku, K., & Ichikawa, T. 1995, PASP, 107, 945
- Fynbo et al. (2001) Fynbo, J. U., Möller, P., & Thomsen, B. 2001, A&A, 368, 408
- Gabel et al. (2003) Gabel, J. R., et al. 2003, ApJ, 583, 178
- Gallagher et al. (2002) Gallagher, S. C., Brandt, W. N., Chartas, G., & Garmire, G. P. 2002, ApJ, 567, 37
- Gallagher et al. (2003) Gallagher, S. C., Brandt, W. N., Chartas, G., Garmire, G. P., & Sambruna, R. M. 2003, Advances in Space Research, in press (astro-ph/0212304)
- Gallagher et al. (2001) Gallagher, S. C., Brandt, W. N., Laor, A., Elvis, M., Mathur, S., Wills, B. J., & Iyomoto, N. 2001, ApJ, 546, 795
- Garcia-Rissman et al. (2001) Garcia-Rissman, A., Sodré, Jr., L., & Terlevich, R. J. 2001, in Poster Contributions of the Advanced Lecture on the Starburst-AGN Connection, eds. R. Mújica, I. Aretxaga, & D. Knuth, 29–32, %****␣ms.tex␣Line␣1100␣****http://www.inaoep.mx/$∼$agn00/posters.html
- Garmire et al. (2003) Garmire, G. P., Bautz, M. W., Ford, P. G., Nousek, J. A., & Ricker, G. R. 2003, in X-Ray and Gamma-Ray Telescopes and Instruments for Astronomy. Edited by Joachim E. Truemper, Harvey D. Tananbaum. Proceedings of the SPIE, Volume 4851, pp. 28-44 (2003)., 28–44
- Gebhardt et al. (2000) Gebhardt, K., et al. 2000, ApJ, 539, L13
- George & Fabian (1991) George, I. M. & Fabian, A. C. 1991, MNRAS, 249, 352
- George et al. (2000) George, I. M., Turner, T. J., Yaqoob, T., Netzer, H., Laor, A., Mushotzky, R. F., Nandra, K., & Takahashi, T. 2000, ApJ, 531, 52
- Goodrich & Miller (1995) Goodrich, R. W. & Miller, J. S. 1995, ApJ, 448, L73
- Goodrich (1997) Goodrich, R. W. 1997, ApJ, 474, 606
- Green et al. (2001) Green, P. J., Aldcroft, T. L., Mathur, S., Wilkes, B. J., & Elvis, M. 2001, ApJ, 558, 109
- Green & Mathur (1996) Green, P. J. & Mathur, S. 1996, ApJ, 462, 637
- Guainazzi et al. (1998) Guainazzi, M., et al. 1998, MNRAS, 301, L1
- Hazard et al. (1984) Hazard, C., Morton, D. C., Terlevich, R., & McMahon, R. 1984, ApJ, 282, 33
- Hewett & Foltz (2003) Hewett, P. C. & Foltz, C. B. 2003, AJ, 125, 1784
- Hines & Wills (1995) Hines, D. C. & Wills, B. J. 1995, ApJ, 448, L69
- Jannuzi et al. (1998) Jannuzi, B. T., et al. 1998, ApJS, 118, 1
- Kaspi et al. (2002) Kaspi, S., et al. 2002, ApJ, 574, 643
- Kopko et al. (1994) Kopko, M., Turnshek, D. A., & Espey, B. R. 1994, in IAU Symp. 159: Multi-Wavelength Continuum Emission of AGN, eds. T. Courvoisier & A. Blecha, vol. 159 (Dordrecht: Kluwer), 450
- Korista et al. (1993) Korista, K. T., Voit, G. M., Morris, S. L., & Weymann, R. J. 1993, ApJS, 88, 357
- Krolik & Voit (1998) Krolik, J. H. & Voit, G. M. 1998, ApJ, 497, L5
- Laor (1998) Laor, A. 1998, ApJ, 505, L83
- Laor (2001) — 2001, ApJ, 553, 677
- Laor & Brandt (2002) Laor, A. & Brandt, W. N. 2002, ApJ, 569, 641
- Mathur et al. (2000) Mathur, S., et al. 2000, ApJ, 533, L79
- Matt et al. (1992) Matt, G., Perola, G. C., Piro, L., & Stella, L. 1992, A&A, 257, 63
- Matt, Brandt, & Fabian (1996) Matt, G., Brandt, W. N., & Fabian, A. C. 1996, MNRAS, 280, 823
- Murray et al. (1995) Murray, N., Chiang, J., Grossman, S. A., & Voit, G. M. 1995, ApJ, 451, 498
- Mushotzky, Solomon, & Strittmatter (1972) Mushotzky, R. F., Solomon, P. M., & Strittmatter, P. A. 1972, ApJ, 174, 7
- Proga et al. (2000) Proga, D., Stone, J. M., & Kallman, T. R. 2000, ApJ, 543, 686
- Rabbette et al. (1998) Rabbette, M., McBreen, B., Smith, N., & Steel, S. 1998, A&AS, 129, 445
- Reichard et al. (2003) Reichard, T. A., et al. 2003, AJ, 125, 1711
- Ross & Fabian (1993) Ross, R. R. & Fabian, A. C. 1993, MNRAS, 261, 74
- Sabra & Hamann (2001) Sabra, B. M. & Hamann, F. 2001, ApJ, 563, 555
- Scargle, Caroff, & Noerdlinger (1970) Scargle, J. D., Caroff, L. J., & Noerdlinger, P. D. 1970, ApJ, 161, L115
- Scargle (1973) Scargle, J. D. 1973, ApJ, 179, 705
- Snowden (2002) Snowden, S. L., in New Visions of the X-ray Universe in the XMM-Newton and Chandra Era, Edited by F. Jansen, Proceedings of an ESTEC Symposium, in press (astro-ph/0203311)
- Turner et al. (1997) Turner, T. J., George, I. M., Nandra, K., & Mushotzky, R. F. 1997, ApJS, 113, 23
- Turnshek et al. (1988) Turnshek, D. A., Grillmair, C. J., Foltz, C. B., & Weymann, R. J. 1988, ApJ, 325, 651
- Vanden Berk et al. (2001) Vanden Berk, D. E., et al. 2001, AJ, 122, 549
- Vestergaard (2002) Vestergaard, M. 2002, ApJ, 571, 733
- Vignali et al. (2003) Vignali, C., et al. 2003, AJ, 125, 2876
- Vilkoviskij & Irwin (2001) Vilkoviskij, E. Y. & Irwin, M. J. 2001, MNRAS, 321, 4
- Weaver et al. (1996) Weaver, K. A., Nousek, J., Yaqoob, T., Mushotzky, R. F., Makino, F., & Otani, C. 1996, ApJ, 458, 160
- Weisskopf et al. (2002) Weisskopf, M. C., Brinkman, B., Canizares, C., Garmire, G., Murray, S., & Van Speybroeck, L. P. 2002, PASP, 114, 1
- Weymann et al. (1991) Weymann, R. J., Morris, S. L., Foltz, C. B., & Hewett, P. C. 1991, ApJ, 373, 23
- Woo & Urry (2002) Woo, J. & Urry, C. M. 2002, ApJ, 579, 530
- Woodgate et al. (1998) Woodgate, B. E., et al. 1998, PASP, 110, 1183
- Yu & Tremaine (2002) Yu, Q. & Tremaine, S. 2002, MNRAS, 335, 965
- Yuan & Wills (2003) Yuan, M. J. & Wills, B. J. 2003, ApJ, 593, L11
| ASCAbbASCA best-fitting parameters have been adjusted from Gallagher et al. (2001) to account for the degradation of the low-energy quantum efficiency of the SIS detectors (see 2.1). | Chandra | |
|---|---|---|
| PropertyaaAll values listed are for the rest frame, except for fluxes and power-law normalizations. Errors quoted are for confidence taking all model parameters to be of interest other than absolute normalization with the exception of the line parameters, which are quoted for confidence. All fits include fixed Galactic absorption, =6.26 cm-2. | 1999 Nov | 2002 Sep |
| ( cm-2) | ||
| ( phot cm-2 s-1 keV-1) | ||
| Line Energy (keV) | ||
| (keV) | ||
| EW (eV) | ccThe EW upper limit from the ASCA data is calculated assuming the energy and measured for the Chandra emission line. For an unresolved neutral Fe K emission line, the EW eV (Gallagher et al. 2001). | |
| ( erg cm-2 s-1) | ||
| ( erg cm-2 s-1) | ||
| ( erg s-1)ddRest-frame 2.0–10.0 keV luminosity corrected for both Galactic and intrinsic absorption. |
| ASCA SIS | Chandra | |
|---|---|---|
| PropertyaaAll absorber values listed are for the rest frame. Errors quoted are for confidence taking 3 parameters (, , and ) to be of interest. All fits include fixed Galactic absorption ( =6.26 cm-2), and the ASCA SIS spectral models also include the corrections for the degradation of the low-energy quantum efficiency (see 2.1). | 1999 Nov | 2002 Sep |
| Model 1 | ||
| ( cm-2) | ||
| (erg cm s-1) | ||
| 131.1/116 | ||
| Model 2 | ||
| ( cm-2) | ||
| (erg cm s-1) | ||
| 123.2/116 | ||
| Model 3 | ||
| ( cm-2) | ||
| (erg cm s-1) | ||
| 112.0/115 | ||
| System | |||
|---|---|---|---|
| Number | aaThe values of were calculated using a systemic redshift of =0.466 measured by Boroson & Green (1992) from fitting the narrow [O iii] emission line. Note, however, that the weakness of the [O iii] emission in PG 2112+059 introduces some uncertainty into this redshift determination, and Corbin & Boroson (1996) measured from broad H. The stated errors take into account the uncertainties in both and . | ( km s-1) | |
| 1 | |||
| 2 | |||
| 3 | |||
| 4 |