The Rapidly Rotating, Hydrogen Deficient, Hot Post-Asymptotic Giant Branch Star ZNG 1 in the Globular Cluster M5111Based on observations made with the NASA-CNES-CSA Far Ultraviolet Spectroscopic Explorer. FUSE is operated for NASA by the Johns Hopkins University under NASA contract NAS5-32985.
Abstract
We report observations of the hot post-asymptotic giant branch star ZNG 1 in the globular cluster M5 (NGC 5904) with the Far Ultraviolet Spectroscopic Explorer (FUSE). From the resulting spectrum, we derive an effective temperature = K, a surface gravity = , a rotational velocity = km s-1, and a luminosity . The atmosphere is helium-rich (Y = 0.93), with enhanced carbon (2.6% by mass), nitrogen (0.51%) and oxygen (0.37%) abundances. The spectrum shows evidence for a wind with terminal velocity near 1000 km s-1 and an expanding shell of carbon- and nitrogen-rich material around the star. The abundance pattern of ZNG 1 is suggestive of the “born-again” scenario, whereby a star on the white-dwarf cooling curve undergoes a very late shell flash and returns to the AGB, but the star’s rapid rotation is more easily explained by a previous interaction with a binary companion.
1 INTRODUCTION
Post-asymptotic giant branch (PAGB) stars represent a brief (– yr) phase of stellar evolution during which stars move rapidly across the HR diagram at constant luminosity from the cool tip of the AGB to the beginning of the hot white-dwarf cooling curve. As such, they are keys to both the past and the future: their atmospheric abundances provide important information about the mixing and mass-loss processes at work in AGB stars, while their masses yield constraints on the masses of white dwarfs currently forming in globular clusters. To investigate these issues, we observed the PAGB star ZNG 1 (Table The Rapidly Rotating, Hydrogen Deficient, Hot Post-Asymptotic Giant Branch Star ZNG 1 in the Globular Cluster M5111Based on observations made with the NASA-CNES-CSA Far Ultraviolet Spectroscopic Explorer. FUSE is operated for NASA by the Johns Hopkins University under NASA contract NAS5-32985.) in the globular cluster M5 (NGC 5904) with the Far Ultraviolet Spectroscopic Explorer (FUSE).
First identified as a UV-bright star by Zinn, Newell, & Gibson (1972) on the basis of its extreme color, ZNG 1 was observed with IUE by Bohlin et al. (1983), who suggested that an apparent N IV emission feature is the signature of a planetary nebula (PN). Combining this spectrum with other archival IUE data, de Boer (1985) argued that the apparent N IV feature is spurious and pointed out the P-Cygni shape of the strong N V doublet. To test the PN hypothesis, Napiwotzki & Heber (1997) used the Hubble Space Telescope to obtain a WFPC2 H image and GHRS ultraviolet spectra of the star. The H image shows a bright G-type star only 05 from ZNG 1, but no evidence for extended emission around the star. The GHRS spectra clearly show P-Cygni profiles in the N V doublet and discrete absorption components (DACs), blueshifted by 900 km s-1, in both N V and C IV . No nebular emission is present.
2 OBSERVATIONS AND DATA REDUCTION
FUSE consists of four separate optical systems. Two employ LiF optical coatings and are sensitive to wavelengths from 990 to 1187 Å, while the other two use SiC coatings, which provide reflectivity to wavelengths as short as 905 Å. The four channels overlap between 990 and 1070 Å. The FUSE flux calibration, based on theoretical models of white-dwarf stellar atmospheres, is believed accurate to about 10%. For a complete description of FUSE, see Moos et al. (2000) and Sahnow et al. (2000).
The FUSE spectrum of ZNG 1 in M5 (data set A1080303) was obtained in 4 separate exposures on 2000 July 15. The total integration time was 3681 s, all of it during orbital night. All observations were made through the 30″ 30″ (LWRS) aperture. Archival HST/WFPC2 FUV images of the cluster core confirm that no other UV-bright stars fell within the spectrograph aperture. The data were reduced using version 2.3 of the CalFUSE calibration software pipeline. For each FUSE channel, the spectra from individual exposures were cross-correlated, shifted to a common wavelength scale, weighted by their exposure time, and averaged. The spectrum from each channel was then cross-correlated with a synthetic molecular-hydrogen spectrum and shifted to match. The wavelength scale defined in this way is at rest with respect to the interstellar medium (ISM), which we take as a proxy for the local standard of rest. Finally, the spectra were binned by four detector pixels, or about 0.025 Å, approximately half of the instrument resolution.
3 SPECTRAL ANALYSIS
3.1 Synthetic Spectra and Model Fitting
Model atmospheres are computed using the program TLUSTY (Hubeny & Lanz, 1995), which employs a sophisticated treatment of non-LTE (local thermodynamic equilibrium) line blanketing to account for the opacity sources important in stellar atmospheres. In our models, the line and continuum transitions of H, He, C, and N (a total of 10 ions and 220 energy levels) are treated in non-LTE with detailed photoionization cross sections that include resonances; other species, assumed to have scaled-solar abundances with [Fe/H] equal to the cluster mean (Table The Rapidly Rotating, Hydrogen Deficient, Hot Post-Asymptotic Giant Branch Star ZNG 1 in the Globular Cluster M5111Based on observations made with the NASA-CNES-CSA Far Ultraviolet Spectroscopic Explorer. FUSE is operated for NASA by the Johns Hopkins University under NASA contract NAS5-32985.), are treated in LTE. All models assume a microturbulent velocity of 2 km s-1. Synthetic spectra are generated using the program SYNSPEC and rotationally broadened using the program ROTIN3, which assumes constant limb darkening. The application of these codes to another sdO star, BD °325, is described in Lanz, Hubeny, & Heap (1997).
Model spectra are fit to the data using the nonlinear curve-fitting program SPECFIT (Kriss, 1994), which performs a minimization of the model parameters. Reddening is modeled with a Cardelli, Clayton, & Mathis (1989) extinction curve, extrapolated to the Lyman limit, assuming B V) = 0.03 (Table The Rapidly Rotating, Hydrogen Deficient, Hot Post-Asymptotic Giant Branch Star ZNG 1 in the Globular Cluster M5111Based on observations made with the NASA-CNES-CSA Far Ultraviolet Spectroscopic Explorer. FUSE is operated for NASA by the Johns Hopkins University under NASA contract NAS5-32985.) and = 3.1. Error bars for a particular parameter are derived by fixing that parameter at the best-fit value, then raising it, while allowing the other model parameters to vary freely, until rises by 1, which corresponds to a 1 deviation for a single interesting parameter (Avni, 1976). The error bars quoted in Table 2 are purely statistical and do not include systematic errors.
3.2 Atmospheric Parameters
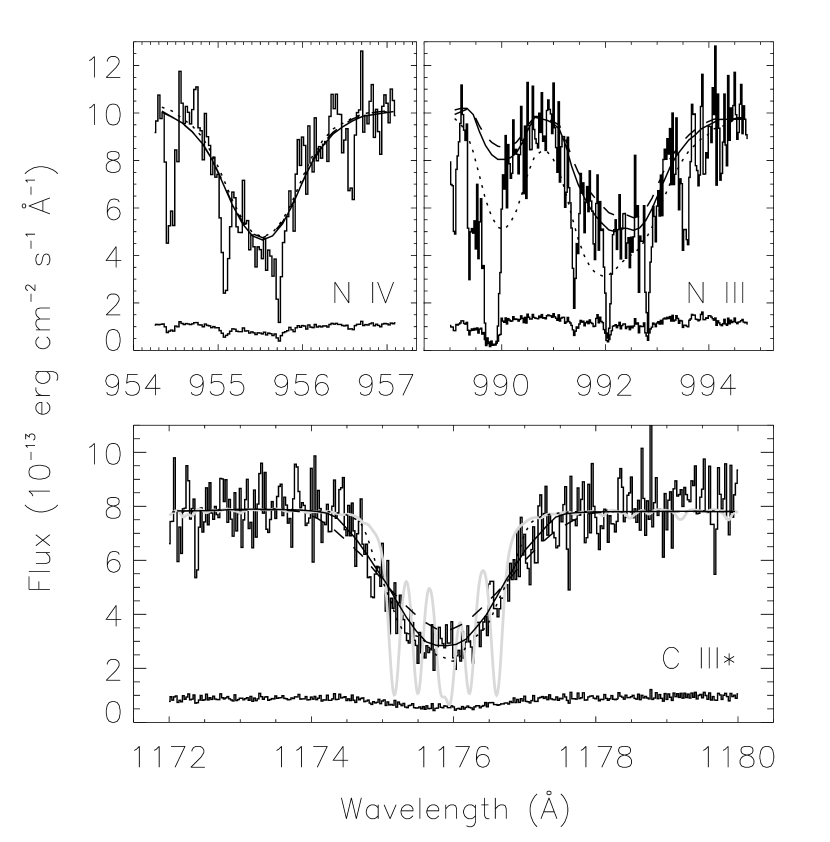
The most prominant feature in the FUSE spectrum of ZNG 1 is the C III∗ multiplet at 1175 Å. The half dozen individual lines of this feature are generally well resolved in FUSE spectra, but in ZNG 1 are blended into a broad absorption trough. As shown in 1, this feature is well reproduced by a rotational velocity = 170 km s-1, a carbon mass fraction of 3%, an effective temperature = 45 kK, and a radial velocity = +60 km s-1, a value consistent with the cluster velocity (Table The Rapidly Rotating, Hydrogen Deficient, Hot Post-Asymptotic Giant Branch Star ZNG 1 in the Globular Cluster M5111Based on observations made with the NASA-CNES-CSA Far Ultraviolet Spectroscopic Explorer. FUSE is operated for NASA by the Johns Hopkins University under NASA contract NAS5-32985.).
We determine the star’s surface gravity and helium abundance from simultaneous fits to its helium and hydrogen lines. As shown in 2, every second He II Balmer line is paired with an H I Lyman line, but lies Å to the blue. The lines are unresolved because of the star’s high rotational velocity, but our models show that these H-He blends shift to the blue as the helium abundance rises and the hydrogen abundance falls. (Note that the stellar features are redshifted relative to the ISM.) Though the cores of all three features are contaminated—the H-He blends by interstellar H I and the He II line by S VI from the stellar wind—their wings can constrain both the stellar surface gravity and the helium abundance.
We model the region between 930 and 940 Å, excluding the cores of all three stellar features (2). (Model fits to the ISM lines confirm that all regions of significant foreground H I absorption are excluded.) The remaining interstellar lines are fit with simple Gaussians. We generate a grid of models with surface gravities = 4.0, 4.5, and 5.0 and helium fractions from 10 to 90% (in steps of 10%) by number. Within SPECFIT, we linearly interpolate between models to produce a fine grid with steps of 0.1 dex in . Assuming = 45 kK and = +60 km s-1, we find a surface gravity of and a helium fraction of % by number. Repeating this test with = 46 kK models yields best-fit values of and a helium fraction of %, so we need not increase our error bars to account for small uncertainties in the effective temperature. Given the low hydrogen abundance of this star, we quote all abundances as mass fractions; that of helium is % (Table 2).
Adopting these stellar parameters, we fit model spectra to four photospheric nitrogen features, N IV , N III , N III (red wing), and N III , and derive an effective temperature of = K and a nitrogen mass fraction of %. Fits to three of these lines are presented in 1. The giants in M5 show a wide range of nitrogen abundances, the highest being [N/Fe] = +1.38 (Cohen, Briley, & Stetson, 2002), but the nitrogen abundance of ZNG 1 is 4 times greater. Returning to the C III∗ multiplet, we obtain a rotational velocity km s-1 and a carbon mass fraction of %, more than 160 times greater than the most carbon-rich cluster giant studied by Cohen et al. (2002).
The star’s FUSE spectrum shows no strong oxygen features, so we fit the wavelength region between 1090 and 1104 Å, where the continuum is fairly flat and where numerous weak O III and O IV lines combine to form two broad absorption troughs centered at 1093 and 1099 Å. We derive an oxygen mass fraction of %. While the oxygen abundance is the least well-determined of the CNO abundances in ZNG 1, it is certainly larger than the maximum value observed in M5 giants, where [O/Fe] ranges from to (Ivans et al., 2001). The star also appears to be enhanced in S, Si, and P; we will determine their abundances in a future paper.
3.3 Wind and Shell
The FUSE spectrum of ZNG 1 shows broad P-Cygni profiles and blueshifted discrete absorption components (DACs) in both components of the O VI doublet. The O VI profiles are well fit by models with a terminal velocity of = 1000 km s-1. The DACs, which are generally attributed to density enhancements in the stellar wind, are blueshifted by 960 km s-1 relative to the star, consistent with the DACs seen by GHRS (Napiwotzki & Heber, 1997). The spectrum also shows narrow absorption features of H I, C III , C II , and N II blueshifted by 120 km s-1 relative to the ISM and 180 km s-1 relative to the star (two blue-shifted H I features are marked in 2; see also Fig. 1 of Dixon, Brown, & Landsman 2003). These features may represent a shell of material expanding about the star. A complete analysis of the star’s wind and shell features is forthcoming.
3.4 Stellar Parameters
Using the cluster distance and the ratio of observed to synthetic spectra (Dixon, Davidsen, & Ferguson, 1994), we derive a stellar luminosity . The star lies on the Schönberner (1983) PAGB evolutionary tracks and should have a mass . The mass calculated from the parameters of our best-fit model, , is consistent with the Schönberner prediction.
4 DISCUSSION
Hot PAGB stars in globular clusters differ from their field counterparts in that they rarely show evidence for third dredge-up (by which the products of helium burning are brought to the surface) and are seldom accompanied by PNe (Jacoby et al., 1997). These characteristics can be understood qualitatively as a result of the expected low core mass () of globular cluster AGB stars. While the minimum core mass for third dredge-up is still a subject of active research (Karakas, Lattanzio, & Pols, 2002), nearly all current AGB models agree that third dredge-up should not occur in stars with initial mass . The rarity of PNe can be explained by the lower luminosities and longer crossing times of PAGB stars with low core masses; the nebula disperses before the central star becomes hot enough to ionize it (Jacoby et al., 1997). Alves, Bond, & Livio (2000) therefore suggest that binary evolution is necessary for the formation of PNe in globular clusters. Interestingly, the best-studied PN in a globular cluster, K648 in M15, shows clear evidence for third dredge-up in its central star (Rauch, Heber, & Werner, 2002), but not the strong helium and nitrogen enhancements seen in ZNG 1.
One way to produce a hydrogen-deficient star with enhanced CNO abundances is for the star to experience a very late shell flash while descending the white dwarf cooling curve and subsequently return to the AGB (Herwig et al., 1999). This “born-again” scenario might explain the absence of a PN surrounding ZNG 1, because the star is so old (since it is on a second crossing), that any nebula has long since dispersed. For the born-again scenario to work for ZNG 1, the hydrogen must not be completely burned, and the carbon enhancement must not be too high. Lawlor & MacDonald (2003) provide a born-again model of an initial 1 star with Z = 0.001 that predicts stellar parameters similar to those of ZNG 1 (see their Table 3), although the CNO abundances are about a factor of three larger. The difficulty with the born-again scenario (or any single-star evolution scenario) is providing an explanation for the observed rapid rotation. One possibility: to explain the observed rotational velocity of up to 40 km s-1 in some globular horizontal-branch stars (Behr, 2003), Sills & Pinsonneault (2000) postulate that red giants may have a rapidly rotating core. If so, then perhaps its angular momentum can be transferred to the surface during the convective mixing in the final shell flash.
Might the properties of ZNG 1 be explained through interaction with another star? First, we note that its very blue B V color indicates that any current companion must be quite faint. Given the proximity of the star to the projected cluster center (42) and the moderately high stellar interaction rate in M5 (Pooley et al., 2003), one possiblity is a stellar collision, which is thought to be the primary production mechanism for the blue stragglers found at the centers of globular clusters. Collisionally-created blue stragglers are expected to be born with a high angular momentum. Shara, Saffer, & Livio (1997) measure a rotation rate of km s-1 and estimate a mass of for a blue straggler in 47 Tuc. A star of this mass would likely experience third dredge-up on the AGB, but would also be expected to eject a PN, which is not seen for ZNG 1. Furthermore, it is unclear how much of a blue straggler’s angular momentum would survive its post-main sequence evolution.
A second scenario, in which a low-mass companion spirals into the AGB progenitor, has been proposed to explain K648 in M15 by Alves et al. (2000) and discussed in general by De Marco & Soker (2002). The increased AGB mass due to the ingestion of the companion might be sufficient to allow third dredge-up to occur, but additional mechanisms such as shear or rotationally-induced mixing are required to create a hydrogen-deficient star (De Marco & Soker, 2002). A merger process is thought to be the origin of the high rotational velocity of FK Comae stars ( km s-1 for the prototype FK Comae; Huenemoerder et al. 1993). More detailed analysis is required to assess the viability of a merger scenario for ZNG 1; whether the merger remnant should eject a PN is of particular interest.
Pauldrach et al. (1988) compute terminal velocities and mass-loss rates for the winds of (Pop. I) central stars of PNe. Assuming an evolutionary mass of 0.565 (§3.4) and temperature of = 45 K, their models predict mass-loss rates of a few times yr-1. Given this modest wind, it appears unlikely that ZNG 1 will dissipate significant angular momentum in the brief time ( years, according to the 0.565 track of Schönberner 1983) prior to its arrival on the white-dwarf cooling curve. Previous studies have yet to find white dwarfs with such rapid rotation (see review by Kawaler 2003) but the example of ZNG 1 suggests that further searches may be fruitful.
References
- Alves et al. (2000) Alves, D. R., Bond, H. E., & Livio, M. 2000, AJ, 120, 2044
- Avni (1976) Avni, Y. 1976, ApJ, 210, 642
- Behr (2003) Behr, B. B. 2003, ApJS, 149, 67
- Bohlin et al. (1983) Bohlin, R. C., Smith, A. M., Stecher, T. P., Sweigart, A. V., Cornett, R. H., & Hill, J. K. 1983, ApJ, 267, L89
- Cardelli et al. (1989) Cardelli, J. A., Clayton, G. C., & Mathis, J. S. 1989, ApJ, 345, 245
- Cohen et al. (2002) Cohen, J. G., Briley, M. M., & Stetson, P. B. 2002, AJ, 123, 2525
- de Boer (1985) de Boer, K. S. 1985, A&A, 142, 321
- De Marco & Soker (2002) De Marco, O. & Soker, N. 2002, PASP, 114, 602
- Dixon et al. (2003) Dixon, W. V., Brown, T. B., & Landsman, W. B. 2003, in ASP Conf. Ser. 296, New Horizons in Globular Cluster Astronomy, ed. G. Piotto, G. Meylan, S. G. Djorgovski, & M. Riello (San Francisco: ASP), 236
- Dixon et al. (1994) Dixon, W. V., Davidsen, A. F., & Ferguson, H. C. 1994, AJ, 107, 1388
- Harris (1996) Harris, W. E. 1996, AJ, 112, 1487
- Herwig et al. (1999) Herwig, F., Blöcker, T., Langer, N., & Driebe, T. 1999, A&A, 349, L5
- Hubeny & Lanz (1995) Hubeny, I. & Lanz, T. 1995, ApJ, 439, 875
- Huenemoerder et al. (1993) Huenemoerder, D. P., Ramsey, L. W., Buzasi, D. L., & Nations, H. L. 1993, ApJ, 404, 316
- Ivans et al. (2001) Ivans, I. I., Kraft, R. P., Sneden, C., Smith, G. H., Rich, R. M., & Shetrone, M. 2001, AJ, 122, 1438
- Jacoby et al. (1997) Jacoby, G. H., Morse, J. A., Fullton, L. K., Kwitter, K. B., & Henry, R. B. C. 1997, AJ, 114, 2611
- Karakas et al. (2002) Karakas, A. I., Lattanzio, J. C., & Pols, O. R. 2002, Publications of the Astronomical Society of Australia, 19, 515
- Kawaler (2003) Kawaler, S. D. 2003, in IAU Symp. 215, Stellar Rotation, ed. A. Maeder & P. Eenens, in press (astro–ph/0301539)
- Kriss (1994) Kriss, G. A. 1994, in ASP Conf. Ser. 61, Astronomical Data Analysis Software and Systems III, ed. D. R. Crabtree, R. J. Hanisch, & J. Barnes (San Francisco: ASP), 437
- Lanzet al. (1997) Lanz, T., Hubeny, I., & Heap, S. R. 1997, ApJ, 485, 843
- Lawlor & MacDonald (2003) Lawlor, T. M. & MacDonald, J. 2003, ApJ, 583, 913
- Moehler, Landsman, & Napiwotzki (1998) Moehler, S., Landsman, W., & Napiwotzki, R. 1998, A&A, 335, 510
- Moos et al. (2000) Moos, H. W. et al. 2000, ApJ, 538, L1
- Napiwotzki & Heber (1997) Napiwotzki, R. & Heber, U. 1997, in The Third Conference on Faint Blue Stars, ed. A. G. D. Philip, J. Liebert, R. Saffer, & D. S. Hayes (Schenectady: L. Davis Press), 441
- Pauldrach et al. (1988) Pauldrach, A., Puls, J., Kudritzki, R. P., Mendez, R. H., & Heap, S. R. 1988, A&A, 207, 123
- Piotto et al. (2002) Piotto, G. et al. 2002, A&A, 391, 945
- Pooley et al. (2003) Pooley, D. et al. 2003, ApJ, 591, L131
- Rauch et al. (2002) Rauch, T., Heber, U., & Werner, K. 2002, A&A, 381, 1007
- Sahnow et al. (2000) Sahnow, D. J. et al. 2000, ApJ, 538, L7
- Schönberner (1983) Schönberner, D. 1983, ApJ, 272, 708
- Shara et al. (1997) Shara, M. M., Saffer, R. A., & Livio, M. 1997, ApJ, 489, L59
- Sills & Pinsonneault (2000) Sills, A. & Pinsonneault, M. H. 2000, ApJ, 540, 489
- Zinn et al. (1972) Zinn, R. J., Newell, E. B., & Gibson, J. B. 1972, A&A, 18, 390

| Parameter | Stellar Value |
|---|---|
| K | |
| km s-1 | |
| km s-1 | |
| Y | |
| C abundance | % |
| N abundance | % |
| O abundance | % |
Note. — Abundances are quoted as mass fractions.