00 \Year0000 \Month00 \Pagespan000000 \lhead[0]R.G. Sharp : Age-dating a star-burst with GEMINI/CIRPASS observations of the core of M83 \rhead[Astron. Nachr./AN XXX (200X) X]0 \headnoteAstron. Nachr./AN 32X (200X) X, XXX–XXX
Age-dating a star-burst with GEMINI/CIRPASS observations of the core of M83
Abstract
We present preliminary results from a set of near-IR integral field spectroscopic observations of the central, star-burst, regions of the barred spiral galaxy M83, obtained with CIRPASS on Gemini-S. We present maps in the Pa and [Feii] 1.257 m emission lines which appear surprisingly different. We outline the procedure in which we will use Pa emission line strengths and measures of CO absorption to determine the relative and absolute ages of individual star-forming knots in the central kpc region of M83.
keywords:
galaxies: starburst — galaxies: stellar content — instrumentation: spectrographsRobert Sharp rgs@ast.cam.ac.uk
1 Introduction
The central star-burst in M83 (NGC 5236) has been studied photometrically by Harris et al. (2001) using HST/WFPC images in the broad-band near-UV and optical, as well as narrow-band H and H to derive colours and line equivalent widths for 45 clusters. Despite the excellent spatial resolution of these observations, optical photometric analyses such as these suffer from patchy dust extinction, a reddening vector which parallels the evolutionary tracks in the two-colour diagram, and selection effects which tend to exclude the very youngest (t5 Myr) clusters which have strong emission lines, but only a weak stellar continuum. Additionally, it is not possible, on the basis of broad-band colours alone, to distinguish an instantaneous burst of star formation from a constant star formation rate.
To help overcome these effects, we use the Integral Field Unit (IFU) of the Cambridge Infra-Red Panoramic Survey Spectrograph (CIRPASS; Parry et al. 2000)111http://www.ast.cam.ac.uk/ optics/ to measure both the Pa equivalent width, as well as the CO(6,3) spectroscopic index over the entire star-forming arc and nucleus of M83. As demonstrated by Ryder et al. (2001) for M100, the combination of two such diagnostics allows one to constrain not just the age, but also the burst duration, for each cluster.
2 The CIRPASS spectrograph
CIRPASS is a fibre-fed IR J+H band spectrograph with Multi-Object (MOS) and Integral Field (IFU) modes. The cryogenic camera is liquid nitrogen cooled while the spectrograph optics are housed in a refrigerated cold room cooled to -42∘ C. The fibre-fed design introduces considerable flexibility of operation for CIRPASS, allowing observations on a range of telescopes (from the 8 inch laboratory test telescope used for system verification, the 4m class Anglo-Australian and William Hershel telescopes to the 8m Gemini south telescope) with minimal modification to the focal plane interface.
In MOS mode 150 independent fibres of 1.6 arcsec diameter are available over a field-of-view (FoV) of 1717 arcmin to 4040 arcmin (fibre aperture and FoV are dependent on the details of the telescope focal station occupied). Fibres are typically deployed in pairs to target up to 75 objects at a time while simultaneously sampling the sky. The telescope is then nodded between the two fibres of each pair to allow sky subtraction.
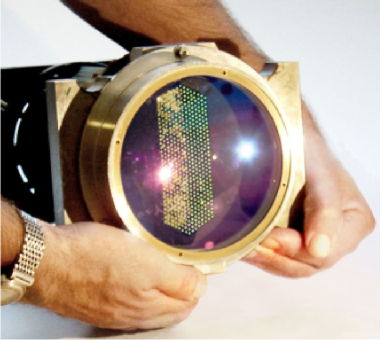
CIRPASS performs integral field spectroscopy using an array of 490 macrolenses which make up the Integral Field Unit (IFU), shown in Figure 2. A macrolens array is used in favour of a microlens array to reduces losses from Focal Ratio Degradation (FRD, Parry et al. 2000). Two broadly rectangular fields of view are available, 134.7 arcsec and 9.33.5 arcsec. The respective lens scales are 0.36 arcsec and 0.25 arcsec. Finer scales are possible if taking advantage of a telescope equipped with an adaptive optics system. In IFU mode CIRPASS is typically operated in medium resolution mode (R5000) giving a dispersion of 2.2 Å/pixel. Such a resolution allows CIRPASS to capitalise on the intrinsically dark sky background between the OH air-glow lines (Martini & DePoy 2000), which are responsible for much of the high sky brightness observed in the near-IR
Prior to September 2003, an Hawaii 1K HgCdTe array has been used in the CIRPASS camera, giving a single shot spectral range of 2200 Å at a two pixel resolution of 4.4Å. The detector was upgraded to an Hawaii 2K array in September 2003 and has been used successfully for science during CIRPASS MOS mode observations at the Anglo-Australian Telescope (AAT) during October 2003. The larger detector provides complete coverage of the J or H bands, between the atmospheric water absorption troughs, in single observations. Alternatively, many programms may benefit from increased resolution without the loss of wavelength coverage that would be inherent with the 1K array.
3 Observations of the nuclear region of M83
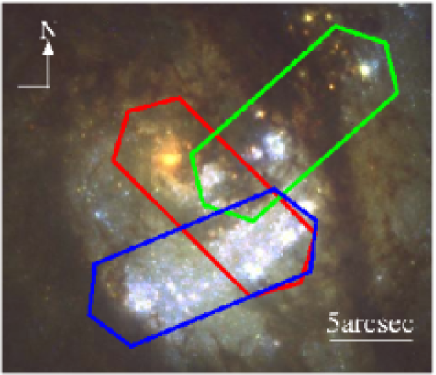
During March 8th and 9th 2003, observations were undertaken of M83 (NGC 5236), with CIRPASS in IFU mode at the cassegrain focus of the 8m Gemini-South telescope. Both nights were photometric with sub-arcsecond seeing. During H band observations, marginally increased variability was observed in OH sky emission features, resulting in sub-optimal sky subtraction. This is, however, not believed to compromise the observational dataset. Three overlapping regions, close to the optical nucleus of M83, were observed (see Figure 1). The 0.36 arcsec lens scale was used giving a FoV per pointing of 134.7 arcsec. Observations where obtained in both the J and H bands centred at Å and Å. The wavelength ranges cover the Pa and [Feii] 1.257 m emission lines in J and the [Feii] 1.644 m line and CO(6,3) molecular absorption feature in the H band. Two 900 sec background limited exposures were taken in each band at each location, interleaved with 900 sec off-target observations for sky subtraction. Observations are performed using a Non-Destructive Read (NDR) mode. Three sequences of 10 detector reads were done at 5 min intervals throughout the integration, to facilitate cosmic ray rejection and to suppress read-noise. A small dither of 0.36 arcsec (one IFU lens) was performed between on-target frames to allow the removal of the small number of detector defects.
3.1 Data Reduction
The data have been processed using the cirpass iraf package222The cirpass iraf package can be obtained from http://www.ast.cam.ac.uk/optics/cirpass/docs.html. A data reduction cookbook detailing the package tasks is under development333A data reduction guide for the cirpass iraf can be found at http://www.ast.cam.ac.uk/optics/cirpass/datared/cookbook_sn1987a.php. Data reduction proceeds in the usual manner. A reset frame correction, analogous to bias subtraction for a CCD frame, is performed. Cosmic ray rejection is carried out for the 900 sec frames using the iraf imcombine task and ccdclip pixel rejection to combine the time series data obtained during each NDR observation. A pixel-to-pixel flat field correction and a bad pixel mask are derived from non-dispersed frames with the detector illuminated by a low power tungsten lamp. Interleaved sky frames are then subtracted from target frames, this step removing the need for the subtraction of a dark frame. The spectra are extracted using the optimal extraction routine described by Johnson et al. (2003). Spectra are also extracted from a tungsten illuminated dome flat field frame. The 2D spectral images are then divided by the extracted 2D flat field frame to account for fibre-to-fibre variation. A wavelength solution is derived from the the co-added sky frames using the OH air-glow lines using the line list of Maihara et al. (1993). The spectra are then transformed to a common wavelength scale using the iraf longslit package tasks fitcoords and transform and pairs of dither positions are mosaiced. Flux calibration and removal of telluric absorption features is performed using the spectrum of an F2V star, HD128299, observed at an airmass similar to the target observations. The stellar spectrum is fitted by the appropriate black body spectrum (Teff=6750K). Data analysis is performed within an interactive software suite written in the IDL programming environment.
3.2 Image registration
The J and H band data were recorded on different nights. In order to register the data a continuum image is created, reconstructing the IFU image across the full wavelength range in each band. Primary features in the final continuum image are the southern star-forming arc and the optical nucleus. Using these features we can register the data to within the individual IFU lens resolution (0.36 arcsec).
3.3 Variance array propagation
The two dimensional spectra are critically sampled on the detector with a FWHM of 1.8 pixels. The peak-to-peak separation of adjacent spectra is pixels. In order to extract spectra with such close separations, leading to a significant overlap between the wings of adjacent spectral profiles, an optimal extraction technique is implemented solving for the maximum likelihood light distribution of each fibre triplet (a fibre and its two nearest neighbours). The central position of each fibre, relative to a set of observations of well spaced ( pixels) calibration fibres observed at each instrument setting prior to the science exposures, is accurately known from extensive laboratory tests.
This process (and that of accurate emission line profile fitting) requires the propagation of the expected variance associated with each pixel of the detector. With 900 sec exposures, the noise in CIRPASS observations is dominated by the count rate from thermal background emission below 1.67 m. A short pass blocking filter prevents thermal emission long-ward of 1.67 m entering the camera optics. At the small number of wavelengths affected by strong OH air-glow lines, noise is significantly enhanced by Poisson noise from the high intensity lines.
3.4 Equivalent width measurements
We fit profiles to the three prominent emission lines: Pa , [Feii] 1.257 m and [Feii] 1.644 m using a reduced technique and assuming a single Gaussian profile. Such a simple profile is believed to be appropriate at the level of spatial and spectral resolution. During line fitting a spectral mask is used to weight the fit against pixels affected by strong OH air-glow line residuals. This OH avoidance technique is a fundamental source of the sensitivity of CIRPASS.
Origlia, Moorwood & Oliva (1993) describe the CO(6,3) absorption band and provide a prescription for measuring the equivalent width of the feature. They define the local continuum using a linear fit to two continuum points which straddle the CO band. The equivalent width is then integrated over a predefined pass band. The width of this band (1.6175 m-1.6220 m, 45 Å or 20 pixels) is of the order of the velocity structure seen in the nuclear regions of M83 (150 km s-1, 8 Å, 3.6 pixels). It is therefore not desirable to simply define a single systemic velocity-adjusted pass band for the entire observational data set. To overcome this we define a smooth background velocity field based on the observed velocity of the Pa emission line.


Left : In the J band we see the strong Pa emission, a signature of hot young stars and active star formation, along with the [Feii] 1.257 m line. This spectrum is taken from a knot of strong hydrogen emission. While the knot is visible as diffuse emission in HST/NICMOS Pa imaging, it is not evident in broad band continuum observations at other wavelengths.
Right : The CO(6,3) molecular absorption features are clearly visible in this H band spectrum taken from the bright optical nucleus of the galaxy (lower spectrum). The location of the centres of three of the CO band heads, after correction for redshift, are marked by dotted vertical lines. Two dashed vertical lines indicate the extent of the CO(6,3) band as defined by Origlia, Moorwood and Oliva (1993). A polynomial fit to the continuum level is also marked. The upper spectrum shows the OH air-glow emission spectrum from which a mask is created to weight spectral fitting algorithms. The CO features are believed to arise in the atmospheres of cool G/K and M red giant stars and can be used, in combination with the Pa emission, to constrain the age and burst duration of star formation in this region.
4 Summary of results
Quantitative analysis is still in progress, but already we see evidence for a much more complex star formation history than that hinted at by the single long-slit near-IR spectrum of Thatte et al. (2000).
Figure 3 shows two example spectra. The left hand spectrum is taken from a region visible in narrow band HST/NICMOS Pa imaging with extended emission but which does not show signs of active star formation loci in broad band WFPC2/NICMOS imaging. This highlights one of the key goals of these observations, to perform an accurate census of the star formation in the nuclear region of M83, without bias towards bright continuum regions, such as those targeted by Harris et al. (2001). In contrast to the strong Pa emission, little CO absorption is seen in the H band spectrum of this region (not shown in Figure 3), suggesting a young ( Myr) star formation region.
The right hand spectrum of Figure 3 is taken from the optical nucleus of M83. Strong CO absorption is visible in this H band spectrum which, when taken in comparison with a very weak Pa emission line strength in the J band spectrum (not shown), is suggestive of an old stellar population ( Myr). By comparing the equivalent width ratio for Pa and CO(6,3) we will determine the age of star-formation across the nucleus of M83.
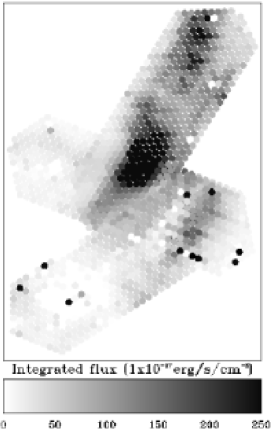
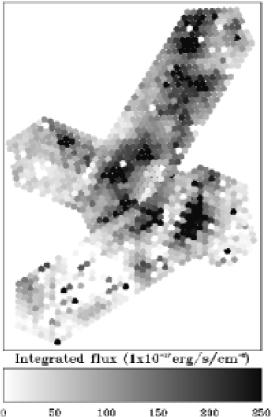
Figure 4 compares the distribution of Pa line flux, with that of the [Feii] 1.644 m. The former provides a measure of the massive star formation rate within the last 5 Myr, while the latter is thought to be a tracer of shocks from supernova explosions within the past 104 years (Alonso-Hererro et al. 2003). The [Feii] emission is rather clumpy, and confined mainly to the periphery of the more diffuse Pa emission, suggesting that massive star formation is being propagated into regions of undisturbed gas by the passage of the supernova blasts themselves.
Acknowledgements.
The authors wish to thank and acknowledge the following for their contributions to this work. Firstly, we thank the Instrumentation Group at the Institute of Astronomy, Cambridge for providing CIRPASS. We also thank the CIRPASS team for support and operation of the instrument at the telescope. The Raymond and Beverly Sackler Foundation and PPARC were responsible for the funding of CIRPASS. Finally we acknowledge the Gemini Observatory for the allocation of telescope time, allowing CIRPASS to be used as a visitor instrument, supporting its installation at the telescope and operating the telescope while the observations were made. The Gemini Observatory is operated by the Association of Universities for Research in Astronomy, Inc., under a cooperative agreement with the NSF on behalf of the Gemini partnership: the National Science Foundation (United States), the Particle Physics and Astronomy Research Council (United Kingdom), the National Research Council (Canada), CONICYT (Chile), the Australian Research Council (Australia), CNPq (Brazil) and CONICET (Argentina)References
- [1] Alonso-Hererro A. et al. : 2003, AJ, 125, 1210
- [2] Harris J. et al. : 2001, ApJ, 122, 3046
- [3] Johnson R. et al. : 2003, in prep.
- [4] Martini P. and DePoy D.L. : 2000, SPIE, 4008, 695
- [5] Maihara T. et al. : 1993, PASP, 105, 940
- [6] Origlia, Moorwood A.F.M., and Oliva E. : 1993, A&A 280 536
- [7] Parry I. et al. : 2000, SPIE, 4008, 1193
- [8] Ryder S.D., Knapen J.H. and Takamiya M. : 2001, MNRAS, 323, 663
- [9] Thatte N., Tecza M. and Genzel R. : 2000, A&A, 364, L47