Smashing the Guitar: An Evolving Neutron Star Bow Shock
Abstract
The Guitar nebula is a spectacular example of an H bow shock nebula produced by the interaction of a neutron star with its environment. The radio pulsar B2224+65 is traveling at 800–1600 km s-1 (for a distance of 1–2 kpc), placing it on the high-velocity tail of the pulsar velocity distribution. Here we report time evolution in the shape of the Guitar nebula, the first such observations for a bow shock nebula, as seen in H imaging with the Hubble Space Telescope. The morphology of the nebula provides no evidence for anisotropy in the pulsar wind, nor for fluctuations in the pulsar wind luminosity. The nebula shows morphological changes over two epochs spaced by seven years that imply the existence of significant gradients and inhomogeneities in the ambient interstellar medium. These observations offer astrophysically unique, in situ probes of length scales between pc and pc. Model fitting suggests that the nebula axis — and thus the three-dimensional velocity vector — lies within 20°of the plane of the sky, and also jointly constrains the distance to the neutron star and the ambient density.
1 Introduction
While the steady decay of spin rates observed in radio pulsars provides a good estimate of the rate of energy loss , only a small fraction of the energy output of a neutron star is typically converted to directly detectable electromagnetic radiation. Most of the spindown energy loss is carried away by a relativistic wind, the properties of which are largely unknown. The best constraints on the relativistic wind derive from its interaction with the interstellar medium (ISM). This interaction has been observed, for example, in synchrotron nebulae such as the Crab Nebula (Kennel & Coroniti, 1984; Gallant & Arons, 1994; Melatos & Melrose, 1996), where wisp structures are observed moving at (Hester et al., 2002), as well as bow shocks observed in H emission from shock-excited neutral gas around PSR B1957+20 (Kulkarni & Hester, 1988) and various other pulsars (Chatterjee & Cordes, 2002; Gaensler, Jones & Stappers, 2002).
The Guitar nebula was discovered in deep H imaging observations with the 5-m Hale telescope at Palomar Observatory (Cordes, Romani & Lundgren, 1993). Using a model for the Galactic electron density distribution (Cordes & Lazio, 2002), the dispersion measure (DM 35.3 pc cm-3) of PSR B2224+65 implies a distance of 1.9 kpc (hereafter parameterized as D1.9). While the pulsar has a modest = 1033.1 erg s-1, the large space velocity of the pulsar ( D1.9 km s-1) provides the ram pressure needed to create a detectable bow shock nebula. The existence of an observable bow shock nebula also implies the presence of a significant neutral hydrogen component in the ISM near the pulsar. Here we describe Hubble Space Telescope (HST) observations of the time evolution of the nebula, and discuss the implications of the observations for our understanding of neutron star (NS) relativistic winds and the ISM.
2 HST Observations and Modeling
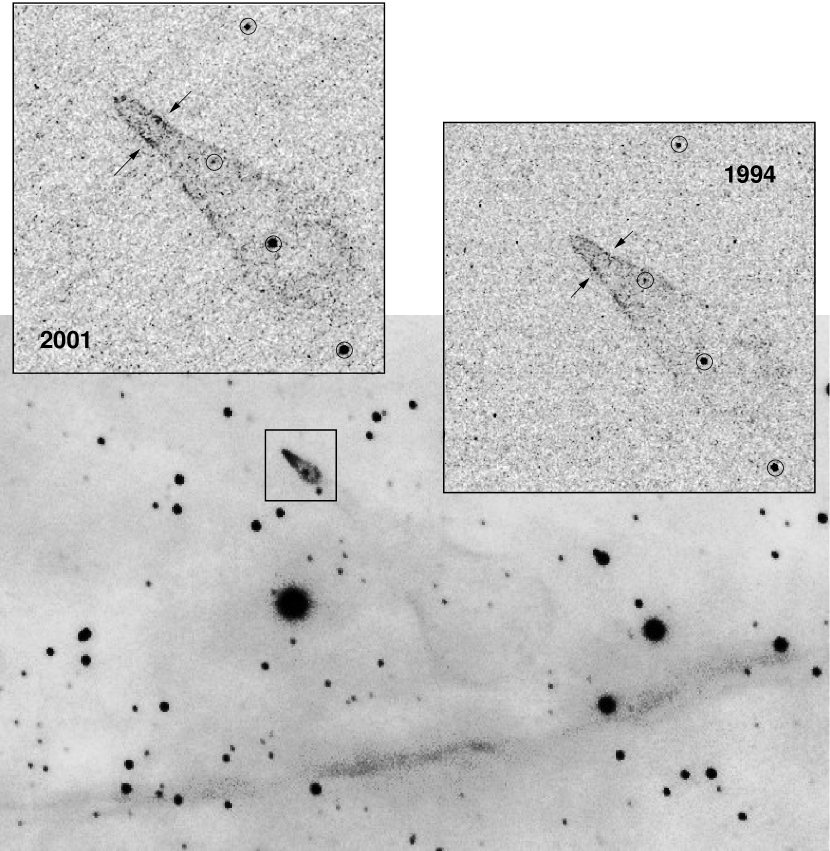
High resolution HST observations obtained in 1994 December with the Wide Field and Planetary Camera 2 (WFPC2; Holtzman et al., 1995) have been described previously (Chatterjee & Cordes, 2002). New WFPC2 observations were obtained in 2001 December, with about 2.4 times the exposure time of the earlier epoch. At both epochs, exposures were combined using variable-pixel linear reconstruction (“Drizzling”; Fruchter & Hook, 2002), yielding an effective pixel scale 00226, roughly half the size of the 00455 pixels on the WFPC2 Planetary Camera chip. The H images at the two epochs (Figure 1) were aligned to sub-pixel accuracy using eight stars (Figure 2a). The tip of the nebula has moved 1.3″ in 7 years, consistent with the radio proper motion of PSR B2224+65 ( mas yr-1, at a position angle ; Harrison, Lyne & Anderson, 1993). However, unlike the simple translation with constant shape expected for a bow shock in a uniform ambient medium, the head of the nebula has changed morphologically, showing corrugations in the limb-brightened edge as well as gaps in the H flux, both of which vary with time.
At the tip of the nebula, the stand-off radius of the bow shock has increased over the seven-year period, as determined by model fitting (discussed below) at each epoch. Pressure balance between the relativistic NS wind and ram pressure from the ambient medium occurs at the stand-off radius,
| (1) |
where is the number density of particles with mean mass and is the pulsar velocity. For the Guitar nebula, incorporating measured values for the pulsar and proper motion, the stand-off radius is astronomical units (AU), and the predicted stand-off angle is milliarcseconds. Bright patches appear along the edges of the nebula where it is constricted, as marked with arrows in Figure 1: the location of this brightening has moved ″ parallel to the pulsar motion along both sides of the nebula. However, in Figure 2(a), the edges perpendicular to the nebula axis have moved outwards by less than 0.3″, remaining essentially static at several points. Meanwhile, the rear edge of H emission has actually moved backwards by ″ in 2001 compared to 1994. Possible explanations include turbulence in the shocked layers, their interaction with a complex magnetic field, or changes in any of the variables in the expression for (Equation 1), including . However, even for the largest observed glitches (Hobbs et al., 2002), changes temporarily by , a negligible variation compared to the large morphological changes observed. Besides being contrary to our general understanding of spin down, a time-variable also fails to explain the brightening of the nebula at the locations where it appears constricted. Indeed, it is difficult to explain the evolving morphology without invoking variations in the ambient interstellar density, although instabilities in the shock structure are also possible (e.g. Draine & McKee, 1993). We propose that the observations reflect the motion of PSR B2224+65 through random density inhomogeneities combined with a gradient towards a region of lower density. The bright rear edge ( downstream of the nebula tip in 1994) marks a sharp increase in density which the NS broke through years ago. Presently, the shock at the rear confines the relativistic NS wind, leading to a brightening of the head of the nebula and preventing the wind from powering the rest of the Guitar body, thus producing the dim, elongated and narrow “neck” of the Guitar in Figure 1.
We argue further that the morphology of the head of the Guitar nebula is an analog for confinement by another high-density region years ago, which created the rounded end of the Guitar body. Fluctuations in the ambient density cause the body to be brighter where it appears constricted. In a few hundred years, as the larger Guitar body fades from view, what is currently the head of the nebula may expand to become another guitar-like structure. The scenario described here, while plausible, needs to be verified with future high-resolution monitoring observations as well as time-dependent hydrodynamic modeling of shock fronts in an ambient medium with significant density fluctuations.

| Position Angle | Inclination††The fit for inclination angle was inconclusive, especially for the 1994 data, as discussed in Chatterjee & Cordes (2002). | Scale Factor | ||
|---|---|---|---|---|
| Epoch | () | () | () | (″) |
| 1994 | ||||
| 2001 |
Currently, in order to quantify the change in stand-off radius between epochs, we have modeled the shock front under the assumption that the nebula tip is in quasi-static equilibrium with the ambient medium. A momentum-conserving bow shock model (Wilkin, 1996) was adapted to fit the H emission at each epoch. The momentum-conserving description has known limitations (Bucciantini & Bandiera, 2001), especially since it applies only to an ambient medium of uniform density. To avoid these problems, we restricted the model fit to within 26 of the tip of the nebula, where it is smooth and symmetric. The model is parameterized by the position angle and the inclination of the nebula to the line of sight (neither of which are expected to change significantly between epochs), the thickness of the shocked layer that emits H, and by a scale factor , which isolates the dependence of the apparent size of the nebula on distance and ambient density. Details of the model fitting procedure (for the 1994 data) are given in Chatterjee & Cordes (2002) and the best-fit parameters for both epochs (position angle, inclination, scale factor and stand-off angle) are listed in Table 1. At both epochs, the fit constrains the nebula to lie in the plane of the sky. As shown in Figure 2(b), the best-fit scale factor varies significantly between 1994 and 2001. Since the fractional change in distance to the nebula is negligible over seven years, the change in scale factor implies a decrease in ambient density by a factor (from 0.006 cm-3 to 0.004 cm-3 for D = 1.9 kpc) over 1.3″, corresponding to a length scale of AU. The implied change in DM for density changes on this length scale is pc cm-3, which may be detectable with sensitive pulse timing observations. Additionally, the fits establish a joint constraint on the distance to the NS and the ambient density, D. We note that the densities obtained above are low, suggesting a possible overestimate of the distance. For an ambient density of 0.05 cm-3, which is comparable to the density of the local warm ionized medium (e.g. Paresce, 1984), the implied distance is 1 kpc (and the height above the Galactic plane is reduced from 240 pc to 120 pc).
To check for unresolved small-scale structure in the limb-brightened nebula, the autocorrelation function was calculated for sections of the image with and without nebular emission. After accounting for Poisson noise and the contribution from smooth extended structure, the excess in the on-nebula autocorrelation function due to barely-resolved or unresolved structure (50 mas or less) is of the larger-scale nebular emission. We conclude that 50 mas represents a lower limit on the angular scale of structure in the interstellar medium probed by these HST observations of the Guitar nebula.
3 Discussion
The wavenumber spectrum for electron density fluctuations in the general ISM has been delineated through a variety of measurements, including radio scintillation, scattering, pulse time-of-arrival, and Faraday-rotation, as illustrated in Figure 3. These measurements constrain the power levels in different wavenumber intervals, and suggest an overall consistency with a Kolmogorov turbulence process (Armstrong, Rickett, & Spangler, 1995), although this consistency is only coarse and may be an illusion associated with the large amplitude scale of the diagram. Departures from the Kolmogorov spectrum are also inferred from pulsar scintillation measurements. The HST measurements of the Guitar Nebula provide constraints on wavenumbers not easily accessible by other probes and therefore provide a new tool for investigating fine structure in the interstellar density.

Along with the properties of the ISM, the Guitar nebula also provides a probe of the pulsar’s relativistic wind. The properties of pulsar winds, including the magnetization parameter , the ratio of the Poynting flux to the kinetic energy flux, have been inferred primarily from the Crab nebula (Kennel & Coroniti, 1984; Gallant & Arons, 1994; Melatos & Melrose, 1996). The existence of bow shock nebulae such as the Guitar requires collisional excitation of the neutral interstellar medium through interactions with shocked electrons and protons. These charged particles can be ejected from the NS itself, or originate from interstellar atoms through photoionization or magnetic reconnection outside the pulsar light cylinder radius (). The process by which the NS Poynting flux is converted to particle kinetic energy is not well understood: overviews of different processes are provided by Begelman & Li (1992), Gallant et al. (2002, ion loading) and Lyubarsky & Kirk (2001, striped pulsar winds). At the stand-off radius (), pressure balance requires that the spindown energy of the NS be carried by the particle flux (), but the shape of the nebula may encode information about the (rotation-averaged) shape of the NS wind.
Along with the Guitar nebula, future observations of the evolution of bow shock nebulae will be possible for the nearby radio-quiet neutron star RX J1856.53754 (van Kerkwijk & Kulkarni, 2001), only 120 pc away (Kaplan, van Kerkwijk & Anderson, 2002; Walter & Lattimer, 2002). Even at its relatively low speed ( km s-1), the neutron star travels ″ in a year, and evolution of the nebula should be evident on roughly this time scale. PSR J21243358, a nearby millisecond pulsar with a complex bow shock nebula (Gaensler, Jones & Stappers, 2002), is also promising in this regard, while the discovery of a bow shock nebula powered by the Poynting flux from a magnetar would allow investigation of the relativistic wind in the presence of an ultra-strong magnetic field.
References
- Armstrong, Rickett, & Spangler (1995) Armstrong, J. W., Rickett, B. J., & Spangler, S. R. 1995, ApJ, 443, 209
- Begelman & Li (1992) Begelman, M. C. & Li, Z. 1992, ApJ, 397, 187
- Bucciantini & Bandiera (2001) Bucciantini, N. & Bandiera, R. 2001, A&A, 375, 1032
- Chatterjee & Cordes (2002) Chatterjee, S. & Cordes, J. M. 2002, ApJ, 575, 407
- Cordes & Lazio (2002) Cordes, J. M. & Lazio, T. J. W. 2002, http://arxiv.org/abs/astro-ph/0207156
- Cordes, Romani & Lundgren (1993) Cordes, J. M., Romani, R. W. & Lundgren, S. C. 1993, Nature, 362, 133
- Cordes et al. (1990) Cordes, J. M., Wolszczan, A., Dewey, R. J., Blaskiewicz, M., & Stinebring, D. R. 1990, ApJ, 349, 245
- Draine & McKee (1993) Draine, B. T. & McKee, C. F. 1993 ARA&A, 31, 373
- Fruchter & Hook (2002) Fruchter, A. S. & Hook, R. N. 2002, PASP, 114, 144
- Gallant & Arons (1994) Gallant, Y. A. & Arons, J. 1994, ApJ, 435, 230.
- Gallant et al. (2002) Gallant, Y. A., van der Swaluw, E., Kirk, J. G., & Achterberg, A. 2002, ASP Conf. Ser. 271: Neutron Stars in Supernova Remnants, 99
- Gaensler, Jones & Stappers (2002) Gaensler, B. M., Jones, D. H. & Stappers, B. W. 2002, ApJ, 580, L137
- Harrison, Lyne & Anderson (1993) Harrison, P. A., Lyne, A. G., & Anderson, B. 1993, MNRAS, 261, 113
- Hester et al. (2002) Hester, J. J. et al. 2002, ApJ, 577, L49
- Hobbs et al. (2002) Hobbs, G. et al. 2002, MNRAS 333, L7
- Holtzman et al. (1995) Holtzman, J. A. et al. 1995, PASP, 107, 156
- Kaplan, van Kerkwijk & Anderson (2002) Kaplan, D. L., van Kerkwijk, M. H. & Anderson, J. 2002, ApJ, 571, 447
- Kaspi, Taylor, and Ryba (1994) Kaspi, V. M., Taylor, J. H., & Ryba, M. F. 1994, ApJ, 428, 713
- Kennel & Coroniti (1984) Kennel, C. F. & Coroniti, F. V. 1984, ApJ, 283, 694
- Kulkarni & Hester (1988) Kulkarni, S. R. & Hester, J. J. 1988, Nature, 335, 801
- Lazio & Cordes (1998) Lazio, T. J. W. & Cordes, J. M. 1998, ApJ, 505, 715
- Lyubarsky & Kirk (2001) Lyubarsky, Y. & Kirk, J. G. 2001, ApJ, 547, 437
- McKee & Ostriker (1977) McKee, C. F. & Ostriker, J. P. 1977, ApJ, 218, 148.
- Melatos & Melrose (1996) Melatos, A. & Melrose, D. B. 1996, MNRAS, 279, 1168
- Paresce (1984) Paresce, F. 1984, AJ, 89, 1022
- van Kerkwijk & Kulkarni (2001) van Kerkwijk, M. H. & Kulkarni, S. R. 2001, A&A, 380, 221
- Walter & Lattimer (2002) Walter, F. M. & Lattimer, J. M. 2002, ApJ, 576, L145
- Wilkin (1996) Wilkin, F. P. 1996, ApJ, 459, L31