Discovery of Globular Clusters in the Proto-Spiral NGC 2915: Implications for Hierarchical Galaxy Evolution
Abstract
We have discovered three globular clusters beyond the Holmberg radius in Hubble Space Telescope Advanced Camera for Surveys images of the gas-rich dark matter dominated blue compact dwarf galaxy NGC 2915. The clusters, all of which start to resolve into stars, have to –9.8 mag, significantly brighter than the peak of the luminosity function of Milky Way globular clusters. Their colors suggest a metallicity dex, typical of metal-poor Galactic globular clusters. The specific frequency of clusters is at a minimum normal, compared to spiral galaxies. However, since only a small portion of the system has been surveyed it is more likely that the luminosity and mass normalized cluster content is higher, like that seen in elliptical galaxies and galaxy clusters. This suggests that NGC 2915 resembles a key phase in the early hierarchical assembly of galaxies - the epoch when much of the old stellar population has formed, but little of the stellar disk. Depending on the subsequent interaction history, such systems could go on to build-up larger elliptical galaxies, evolve into normal spirals, or in rare circumstances remain suspended in their development to become systems like NGC 2915.
ApJ Letters, accepted
1 Introduction
All galaxies with massive old stellar populations are thought to contain globular clusters (GCs). They are particularly noticeable where the old stellar population is dominant such as in elliptical (E), dwarf elliptical (dE), and central Dominant (cD), as well as spiral galaxies with prominent bulges. Dwarf spheroidal galaxies generally do not contain GCs, probably because they have insufficient mass to make their formation likely. The exceptions are the most massive dwarf spheroidals Fornax (Hodge, 1961) and Sagitarius (Ibata, Gilmore & Irwin, 1994) which each have at least 4 GCs. Disk galaxies dominated by population I stars contain fewer GCs per unit luminosity, presumably because of star formation in the disk after the formation of the population II component. Galaxies with a high ratio have yet to form much of their baryonic mass into stars. They typically are blue and not considered likely hosts for populous GC systems.
NGC 2915 is an extreme gas rich galaxy having (Meurer et al., 1996, hereafter MCBF96). Its regularly rotating H i disk extends to over 5 times beyond the readily detectable optical emission providing an excellent dynamical tracer for the mass distribution; not coincidentally NGC 2915 has one of the highest known mass-to-light ratios in a single galaxy (MCBF96). Furthermore, while its optical morphology is that of a blue compact dwarf (BCD; Meurer, Mackie, & Carignan, 1994, hereafter MMC94), its H i disk clearly shows spiral arms which are not apparent in the optical.
In this Letter, we report the discovery of three luminous GCs found in Hubble Space Telescope Advanced Camera for Surveys (ACS; Ford et al., 2002) images of NGC 2915 that were obtained in order to look for a stellar heating source for the H i disk. That issue will be discussed in a separate article (Meurer et al. 2003; in preparation, hereafter Meu03).
2 Data and analysis
ACS Wide Field Camera (WFC) images were obtained of a field centered at 09h 25m 3648, –76∘ 35′ 524 (J2000). The images cover projected radii of 45′′ to 257 ′′, whereas the Holmberg radius . We obtained 2, 2, 4 images for a total exposure of 2480, 2600, 5220 in the filters F475W (), F606W (), and F814W (), respectively. The basic processing of the images was done using the CALACS pipeline (Hack, 1999). We used the program Apsis (Blakeslee et al., 2002) to align and combine the images encorporating geometric correction and rejection of cosmic rays and hot pixels.
Here we present photometry in the natural system of the filters, with zeropoints selected so that Vega would have a magnitude of 0.0 in all bands. In order to compare our observations with previous work, we convert the previous work to this system, as needed, using the calibrations of Sirianni et al (2003, in preparation). The most important correction is to the photometry, since the F606W filter straddles the wavelength of traditional and filters.
3 Results
Table 1 presents adopted global properties for NGC 2915. The foreground extinction, , is from the Schlegel, Finkbeiner & Davis (1998) extinction maps. It is significantly larger than estimated by MMC94, but consistent with the position of the field star Red Giant Branch (RGB; Meu03). Extinction corrected photometry employing the Cardelli, Clayton & Mathis (1989) extinction curve is denoted with a “0” subscript. The distance, was derived from the field star RGB tip (Meu03). It is consistent with but improves on previous estimates Mpc (MMC94) and Mpc (Karachentsev et al., 2003). The remaining quantities in Table 1 were derived from MMC94 and MCBF96 after correcting to the new and .
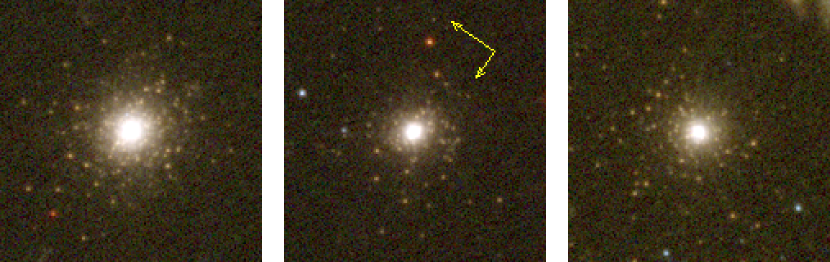
As shown in Fig. 1, the three sources are clearly GCs whose brightest stars are resolved. Table 2 compiles the properties of the clusters. The photometric quantities were measured using a circular aperture having a radius of , with the local sky subtracted using an annulus having radii of 5′′ and 7.5′′. The cluster size is the circular aperture radius encompassing half the light as measured from curves of growth.
Compared to Galactic GCs, these clusters are large and luminous, but not abnormally so. Only 16% of the clusters in the Harris (1996) database111http://physwww.physics.mcmaster.ca/harris/mwgc.dat have luminosities brighter than G3; only three clusters are more luminous than G1. The clusters’ ranges from about 5 to 9 pc, placing them in the upper quartile of Galactic GCs which have ranging from 0.3 to 24.7 pc (Harris, 1996). The clusters are noticeably elongated with ellipticity similar to the canonical flattened Galactic GCs M22 and Cen (, 0.17, respectively; Harris 1996). The combination of high luminosity and appreciable flattening is also seen in the cluster M31-G1 (Pritchet & van den Bergh, 1984; Meylan et al., 2001).
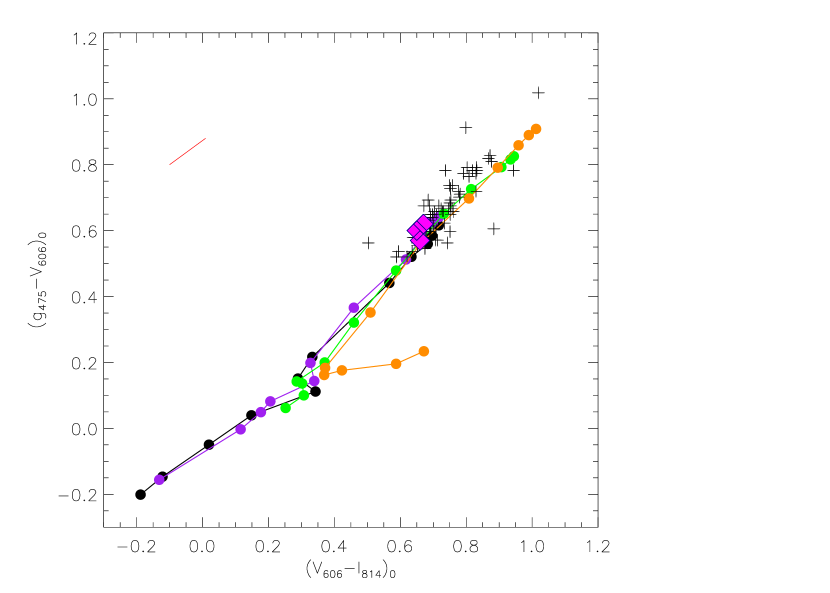
The and colors of the clusters are compared to Milky Way GCs (Harris, 1996) in Fig. 2. Their colors are virtually identical implying similar metallicities, assuming they are old and nearly coeval. We derive their metallicity by fitting the metallicty - color relationship from the Harris database after converting the colors to . We employed an unweighted least squares fit with an iterative rejection resulting in with a dispersion of 0.29 dex. The metallicity for the three clusters is then dex, consistent with low metallicity Galactic GCs. Our stellar population analysis, in progress (Meu03), indicates that the stars at the outskirts of the clusters have very similar versus color-magnitude diagrams, dominated by a narrow and blue RGB. This is also consistent with low [Fe/H], if the clusters are old.
4 Discussion
4.1 Cluster formation efficiency
Because of the blue core and gas rich nature of NGC 2915 we had not expected to find GCs in our images. However, in retrospect this discovery should not have been surprising. GCs have previously been discovered around morphologically similar systems; Östlin, Bergvall & Rönnback (1998) find a considerable population of at least 65 old GCs about the Blue Compact (albeit not dwarf) galaxy ESO 338-IG04. In addition, NGC 2915 is not a dwarf system in terms of mass, and optical imaging shows that it to be dominated by an older stellar population for Kpc (MMC94). These facts suggest that old GCs might have been expected.
Are the number of clusters found anomalous? To address this we estimate the total number of clusters in the system. Unfortunately, our images sample only a small fraction of the galaxy. If the GCs are distributed spherically out to (where the H i distribution ends; MCBF96), then we have only surveyed 3.5% of the available area. Here we consider two cases for the possible distribution of old clusters. Case (1) assumes that we are lucky and have managed to observe all the clusters in NGC 2915. While this is unlikely, it provides a strict lower limit to the cluster formation efficiency. The more likely case (2) is that the globular cluster system is like that of more luminous systems - having a spherically symmetric power-law radial distribution in number per unit area - (Harris, 1991). We assumes this extends between Kpc and , where the minimum insures that the predictions are finite and was chosen to correspond to the size of the central star forming population (MMC94). For we estimate that the total number of clusters in the system is 7 to 12 times higher than found on our images. For case (2) we adopt a correction factor of 9. Hence there are at least 3 GCs in the system (case 1), with a more likely number being (case 2).
In principle, we should correct the total GC estimate for the finite luminosity sampling of the images. However, SExtractor (Bertin & Arnouts, 1996) catalogs of our images show that we can detect extended objects down to which corresponds to an for sources in NGC2915. This is well below the peak of the GC luminosity function (Secker 1992; revised to agree with the Hipparcos RR Lyrae zero point, e.g. Carretta et al. 2000). Hence we apply no luminosity sampling correction. The fact that we only have found GCs much brighter than this peak is somewhat puzzling.
We will consider three measures of cluster formation efficiency. First, the specific frequency, , is the luminosity normalized cluster content (Harris & van den Bergh, 1981). is typically around 1 for spiral galaxies and increases towards earlier galaxy types, with E galaxies having . In the center of galaxy clusters ranges from 2.5 to 12.5 (Blakeslee, Tonry, & Metzger, 1997; Blakeslee, 1999). We consider two measures of the mass normalized contribution: the number of clusters per in dynamical mass (Blakeslee et al. 1997), and , the fractional baryonic (gas and stars) mass in GCs (McLaughlin, 1999). As done by McLaughlin (1999) we assume each cluster has an average mass when calculating . Blakeslee et al. (1997) find an average with a scatter of 30%, while McLaughlin (1999) computes an average with a 20% uncertainty.
Table 3 tabulates , and for NGC 2915 under the above two cases. Relevant quantities used for these calculations are given in Table 1. Table 3 also lists literature values and uncertainties of the efficiencies for “normal” systems. The uncertainty of our estimates are large: for a Poissonian distribution yielding a count of 3, the 95% confidence limits on the cluster formation efficiencies are 0.3 and 2.3 times the estimated value. We find that at a minimum (case 1) is close to normal for a spiral galaxy while while and are low compared to normal globular cluster systems. In the more likely case (2), is very high compared to normal gas rich systems. and are also somewhat high compared to literature values, but in reasonable agreement considering the Poissonian uncertainty of our measurements. While we can not rule out the possibility that NGC 2915 is like a normal spiral galaxy in terms of , it is more likely that it has a high luminosity normalized cluster content, whereas the mass normalized content is closer to normal.
4.2 A missing link in galaxy evolution?
It is interesting to interpret these results within the framework of hierarchical evolution through comparison with other systems. Blakeslee (1999) has discussed how the of the young Milky Way must have been fairly high, similar to the values for cluster E galaxies, after the formation of the Galactic halo but before stellar disk formation. The increase in luminosity from later star formation in the disk would cause a decrease in the Galactic to its present low value, while leaving the number of GCs per unit mass unchanged. In NGC 2915 we have an example of a present-day galaxy with an old stellar component, including GCs, but a spiral disk that is still mainly in the form of gas.
In this sense, NGC 2915, like the centers of rich galaxy clusters, has an elevated value of compared to typical spirals because of a lower efficiency for converting gas into stars. Clusters typically have 2–5 times as much mass in gas as in stars (Arnaud et al., 1992), similar to what we see in NGC 2915. The difference, however, is that the gas in clusters now resides in the hot intracluster medium, while the gas in NGC 2915 still retains the potential to be converted into stars. To a large extent, the fate of the gaseous disk (and the future evolution of in NGC 2915) must depend on the surrounding environment.
Simulations show that when a disk galaxy enters the environment of a rich galaxy cluster, much of the gas in its disk and halo will be removed by the combination of tidal and ram pressure stripping (Abadi, Moore & Bower, 1999; Bekki, Couch & Shioya, 2002; Bekki et al., 2001; Gnedin, 2003). For example, if a system similar to the Galaxy were to fall into a rich cluster it would have its gas disk truncated down to a radius of a few kpc within a few tens of Myr by ram pressure stripping alone (Abadi et al. 1999). Indeed, models of present day evolution of galaxy clusters invoke mildly truncated star formation in field galaxies accreting onto the cluster as the cause of the Butcher-Oemler effect (Balogh, Navarro & Morris, 2000; Kodama & Bower, 2001). It is likely that in their early evolution clusters were assembled from building blocks similar to NGC 2915 which had their ISM stripped from them by these mechanisms. The stripped gas was then virialized to become the cluster X-ray halo. In this scenario galaxy clusters have high because they formed out of subclumps which had already efficiently formed star clusters but which never had the chance to form disks.
In a less hostile environment, a building block similar to NGC 2915 could go on to form a normal spiral galaxy. If the H i disk of NGC 2915 were to be perturbed enough to efficiently form stars in a fairly quiescent fashion this would result in an additional of stars forming with no additional GCs. Assuming a for the additional stars then the system would evolve towards , a fairly normal value for spiral galaxies, while and remain fixed at their normal values. The in NGC 2915 is then anomalously high because the formation of its disk has not proceeded, presumably due to a lack of external perturbations (MCBF96). If so, then we may expect other galaxies with high ratios and extended H i disks to also have a significant GC population, especially if they have a strong old population.
While this scenario seems compelling, we caution that it is possible that NGC 2915 only superficially resembles the building block we describe. We have not proven that the number of clusters is anomalously high. Furthermore, we can not yet rule out the possibility that the clusters are of higher metallicity and younger than Galactic GCs. This is shown in figure 2 where we overplot Bruzual & Charlot (2003) population models on the two color diagram illustrating the strong age-metallicity degeneracy for the filters used here. If the clusters are not old, they may represent the remnants of a starburst occurring as recently as a few Gyr ago. We are undertaking additional observations (imaging and spectroscopic) to get a more accurate census of star clusters in the NGC 2915 system and determine their nature. The results of these studies should determine whether NGC 2915 is just a gas rich galaxy with a peculiar star formation history, or whether it truly presents us with a rare local view of how galaxies looked in the epoch of cluster assembly.
References
- Abadi, Moore & Bower (1999) Abadi, M.G., Moore, B., & Bower, R.G. 1999, MNRAS, 308, 947
- Arnaud et al. (1992) Arnaud, M., Rothenflug, R., Boulade, O., Vigroux, L., & Vangioni-Flam. E. 1992, A&A, 254, 49
- Balogh, Navarro & Morris (2000) Balogh, M.L., Navarro, J.F. & Moore, S.L. 2000, ApJ, 540, 113
- Bekki et al. (2001) Bekki, K., Couch, W.J., Drinkwater, M.J., & Gregg, M.D. 2001, ApJ, 557, L39
- Bekki, Couch & Shioya (2002) Bekki, K., Couch, W.J., & Shioya, Y. 2002, ApJ, 577, 651
- Bertin & Arnouts (1996) Bertin, E. & Arnouts, S. 1996, A&AS, 117, 393
- Blakeslee (1999) Blakeslee, J.P. 1999, AJ, 118, 1506
- Blakeslee, Tonry, & Metzger (1997) Blakeslee, J.P., Tonry, J.L., & Metzger, M.R. 1997, AJ, 114, 482
- Blakeslee et al. (2002) Blakeslee, J.P., Anderson, K.R., Meurer, G.R., Benitez, N., & Magee, D. 2002, ASP Conf. Ser. 295: ADASS XII, 257
- Bruzual & Charlot (2003) Bruzual, G., & Charlot, S. 2003, MNRAS, in press (astro-ph/0309134)
- Cardelli, Clayton & Mathis (1989) Cardelli, J.A., Clayton, G.C., & Mathis, J.S. 1989, ApJ, 345, 245
- Carretta et al. (2000) Carretta, E., Gratton, R.G., Clementini, G., & Fusi Pecci, F. 2000, ApJ, 533, 215
- Ford et al. (2002) Ford, H.C., et al. 2002, Proc. SPIE, 4854, 81
- Gnedin (2003) Gnedin, O.Y. 2003, ApJ, 589, 752
- Hack (1999) Hack, W.J. 1999, CALACS Operation and Implementation, ISR ACS-99-03 (Baltimore: STScI)
- Harris & van den Bergh (1981) Harris, W.E. & van den Bergh, 1981, AJ, 86, 1627
- Harris (1991) Harris, W.E. 1991, ARA&A, 29, 543
- Harris (1996) Harris, W.E. 1996, AJ, 112, 1487
- Hodge (1961) Hodge, P.W. 1961, AJ, 66, 83
- Ibata, Gilmore & Irwin (1994) Ibata, R., Gilmore, G., & Irwin, M. 1994, Nature, 370, 194
- Kodama & Bower (2001) Kodama, T. & Bower, R.G. 2001, MNRAS, 321, 18
- Karachentsev et al. (2003) Karachentsev, et al. 2003, A&A, 398, 479
- McLaughlin (1999) McLaughlin, D.E. 1999, AJ, 117, 2398
- Meurer, Mackie, & Carignan (1994) Meurer, G.R., Mackie, G., & Carignan, C. 1994, AJ, 107, 2021 (MMC94)
- Meurer et al. (1996) Meurer, G.R., Carignan, C., Beaulieu, S., & Freeman, K.C. 1996, AJ, 111, 1551 (MCBF96)
- Meylan et al. (2001) Meylan, G., Sarajedeni, A., Jablonka, P., Djorgovski, S.G., Bridges, T., & Rich, R.M. 2001, AJ, 122, 830
- Östlin, Bergvall & Rönnback (1998) Östlin, G., Bergvall, N., & Rönnback, J. 1998, A&A, 335, 85
- Pritchet & van den Bergh (1984) Pritchet, C.J., & van den Bergh, S. 1984, PASP, 96, 804
- Secker (1992) Secker, J. 1992, AJ, 104, 1472
- Schlegel, Finkbeiner & Davis (1998) Schlegel, D.J., Finkbeiner, D.P., & Davis, M. 1998, ApJ, 500, 525
| Quantity | Value | Units | Description |
|---|---|---|---|
| mag | foreground extinction | ||
| Mpc | Distance | ||
| ISM mass | |||
| Mass in stars | |||
| Total dynamical mass | |||
| –16.42 | mag | Absolute mag band | |
| band luminosity | |||
| 62 | solar | Mass to light ratio |
| ID | RAaaThe absolute accuracy of the positions in each coordinate is set by the astrometric calibration which employed 86 stars in the HST Guide Star Catalog version 2 (http://www-gsss.stsci.edu/gsc/gsc2/GSC2home.htm). The relative accuracy of the positions is in each coordinate. | DecaaThe absolute accuracy of the positions in each coordinate is set by the astrometric calibration which employed 86 stars in the HST Guide Star Catalog version 2 (http://www-gsss.stsci.edu/gsc/gsc2/GSC2home.htm). The relative accuracy of the positions is in each coordinate. | ||||||
|---|---|---|---|---|---|---|---|---|
| (J2000) | (J2000) | (kpc) | (pc) | |||||
| G1 | 09 25 56.273 | -76 35 14.53 | 3.0 | -9.82 | 0.62 | 0.66 | 8.8 | 0.11 |
| G2 | 09 25 27.445 | -76 36 31.55 | 3.3 | -9.04 | 0.57 | 0.65 | 4.6 | 0.16 |
| G3 | 09 25 41.954 | -76 36 33.70 | 2.4 | -8.92 | 0.59 | 0.64 | 5.9 | 0.13 |
| Quantity | Case (1) | Case (2) | Literature |
|---|---|---|---|
| 0.81 | 7.3 | 0–12.5 | |
| 0.14 | 1.3 | ||
| 0.00067 | 0.0061 |