On the Nature of the Bright Short-Period X-ray Source
in the Circinus Galaxy Field
Abstract
The spectrum and light curve of the bright X-ray source CG X-1 in the field of the Circinus galaxy are re-examined. Previous analyses have concluded that the source is an accreting black hole of mass 50 M⊙ although it was noted that the light curve resembles that of an AM Her system. Here we show that the short period and an assumed main sequence companion constrain the mass of the companion to M⊙. Further a possible eclipse seen during one of the Chandra observations and a subsequent XMM-Newton observation constrains the mass of the compact object to M⊙. If such a system lies in the Circinus galaxy, then the accreting object must either radiate anisotropically or strongly violate the Eddington limit. Even if the emission is beamed, then the companion star which intercepts this flux during eclipse will be driven out of thermal equilibrium and evaporate within yr. We find that the observations cannot rule out an AM Her system in the Milky Way and that such a system can account for the variations seen in the light curve.
1 Introduction
Chandra (see e.g. Weisskopf et al. 2002 and references therein) observations have shown that normal galaxies of the size of the Milky Way (e.g. M81, Tennant et al. 2001; Swartz et al. 2003) host hundreds of discrete X-ray sources with luminosities above erg s-1. These sources are comprised of disparate groups of objects, including supernova remnants, X-ray binaries, and more exotic objects such as the supersoft X-ray sources. While the majority of the X-ray emitters are binaries containing a neutron star or stellar-mass black hole accreting material from a companion star, some appear to be quite luminous, with implied accretion rates well above the Eddington limit for a 1.5-M⊙ compact star. These peculiar bright sources are often referred to as ultra-luminous X-ray sources (ULXs).
Several explanations for ULXs have been proposed. They may be intermediate-mass black holes (IMBHs) with masses M⊙, less than the M⊙ inferred for active galactic nuclei (Colbert & Mushotzky 1999; Matsumoto et al. 2001; also Ebisuzaki et al. 2001). They may be stellar-mass black holes (SMBHs) in high-mass X-ray binaries with mildly beamed radiation during a thermal-timescale mass transfer phase (King et al. 2001), perhaps with contributions from synchrotron and inverse-Compton emission from jets in addition to the thermal X-ray emission from the accretion disks (Körding, Falcke & Markoff 2002). They may be long-lasting outbursts in low-mass X-ray binaries, such as in microquasars (King 2002). The nature of ULXs is still under debate, in part, because the X-ray observations alone have difficulty in distinguishing amongst the various alternatives.
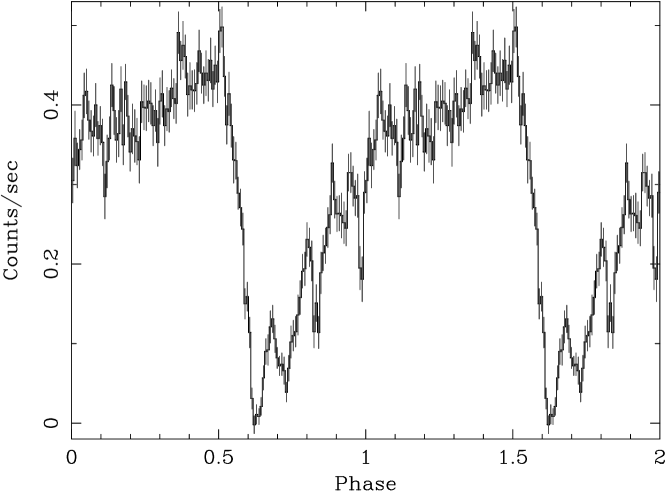
A ULX candidate in the Circinus galaxy ( and , hereafter CG X-1) appears to be periodic with a period of ks (Bauer et al. 2001, Bianchi et al. 2002). Furthermore, at times there is a sharp deep dip in the X-ray light curve reminiscent of eclipses (Weisskopf 2002, and shown in Figure 1). These signatures are important and are useful to determine the nature the system. Bauer et al. (2001) noted the light curve of CG X-1 resembles that of AM Her-type cataclysmic variable (CV) system (for a review of AM Her binaries and CVs, see Cropper 1990; Warner 1995), but argued against an AM Her interpretation as follows: (1) No optical counterpart brighter than 25.3 mag is found in HST images, implying that if the source is an AM Her system its distance is greater than 1.2 kpc, therefore, the X-ray luminosity is too bright for a typical AM Her system. (2) The X-ray spectrum does not have the two components (blackbody and optically thin thermal plasma) typical of AM Her systems. (3) The inferred period of 27 ks (7.5 hr) is significantly larger than those of many AM Her systems, which are typically 1.5-4 hr. (4) The time variability exhibited by CG X-1 shows flickering similar to those seen in the Galactic black-hole X-ray sources. (5) There is only a small probability () of there being a foreground star in the field and an even smaller probability that such a foreground star would be an AM Her system.
Here we re-examine the spectral and timing data of CG X-1 using data from the Chandra (§ 2), XMM-Newton (§ 3), and HST (§ 4) archives. We show that the short period and an assumed main sequence companion constrain the mass of the companion to M⊙ (§ 5.1). Further a possible eclipse constrains the compact object to M⊙ (§ 5.2). It is therefore unlikely that CG X-1 is an IMBH (§ 5.2) or a SMBH in Circinus (§ 5.3). In § 5.4 we consider the possibility of a He-burning companion. Finally, we show that the original arguments of Bauer et al. (2001) do not conclusively rule out a CV system (§ 5.5). Although establishing that a short period ULX is present in the Circinus galaxy would be exciting, we feel that the explanation that this source is a CV in our own galaxy is also compelling and cannot be dismissed.
2 The Chandra Data
The Circinus galaxy has been observed 6 times with the instruments aboard Chandra on 4 separate dates (Table 1). The observations were made either with the back-illuminated CCD, ACIS-S3, or with the High Energy Transmission Grating (HETG)-ACIS-S combination known as the High Energy Transmission Grating Spectrometer (HETGS). The spectral fits discussed below and in §3 use the default abundances and cross-sections in the routine PHABS in XSPEC (Arnaud 1996) in calculating the absorbing column.
| ObsID | Date | Exposure | Instrument | Frame time | Mode |
|---|---|---|---|---|---|
| ks | s | ||||
| 355 | 2000 Jan 16 | 1.8 | ACIS-S3 | 0.40/3.20 | TEa/alternating |
| 365 | 2000 Mar 14 | 5.5 | ACIS-S3 | 0.40 | TE/subframe |
| 356 | 2000 Mar 14 | 23.4 | ACIS-S3 | 3.20 | TE |
| 374 | 2000 Jun 15 | 7.3 | HETGS | 3.20 | TE |
| 62877 | 2000 Jun 16 | 61.4 | HETGS | 3.20 | TE |
| 2454 | 2001 May 02 | 4.5 | ACIS-S3 | 3.20 | TE |
Note. —
a TE — Timed Exposure
2.1 ObsIDs 365 & 356
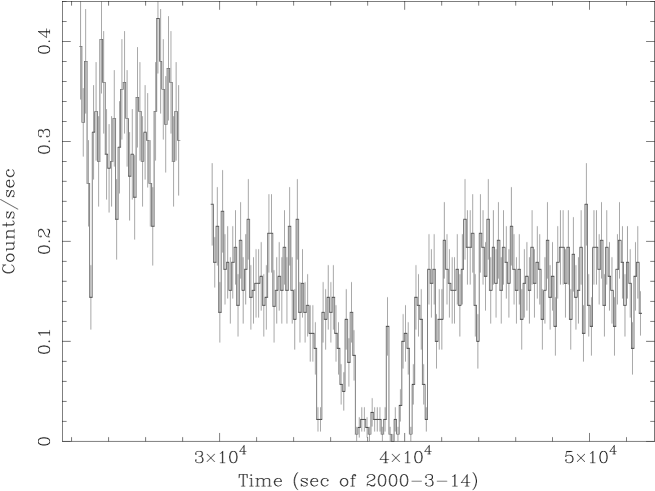
Results from the 2000 Mar 14 observation were reported by Smith & Wilson (2001), who labeled CG X-1 as source J. The viewing time of this ACIS-S3 observation was broken into two segments with different CCD frame times to aid in dealing with pileup. Initially, a 5.5-ks observation (ObsID 365) was made in a subframe mode with a frame time of 0.4 s frame-1. Shortly thereafter, the instrument mode was changed (ObsID 356) to operate in the full frame mode (3.2 s frame-1). The time series, uncorrected for pileup, is shown in Figure 1. The apparent change in the counting rate in the interval between the two observations is entirely due to pileup.
In the first data set (ObsID 365), the counting rate was 0.32 counts s-1 (0.15 frame-1), and the impact of pileup is small. In the second data set (ObsID 356), the same 0.32 counts s-1 corresponds to 1 event frame-1. Using the simple pileup model given in the Chandra Proposer’s Guide444see http://asc.harvard.edu/, the pileup fraction is estimated to be 40%. This degree of pileup should lead to an apparent counting rate of 0.19 counts s-1, close to what is observed.
Flickering is detectable during this observation. Unfortunately, pileup tends to smooth the data at high counting rates which masks any underlying source variability (as well as statistical fluctuations). To test for variability we assumed a steady source and applied a test. We found for the first segment of 39 data points taken using the shorter frame time and thus less susceptible to pileup. We conclude that the source is variable (“flickering”), on time scales of longer than a single bin in the first segment. Applying the same test to the last 39 bins of data in the second segment we found . Since the increased amount of pileup would reduce the apparent variability we conclude that the flickering was more than likely present throughout the entire observation.
The most obvious feature in Figure 1 is the eclipse-like minimum seen near the center of the light curve. During the minimum, the count rate is very low (s-1) and appears to be constant, except for a short flare that extends from 39150 to 39400 s (time as measured in Figure 1). If the short flare signals the end of eclipse, then the eclipse duration is s. Examination of these data at higher time resolution suggests that the counting rate is rising during the flare consistent with what one expects for a source emerging from eclipse.
Spectral fitting the March data is complicated by the pileup. The best approach for dealing with pileup in ACIS data (Davis 2001) does not account for source variability but assumes that the underlying source is steady. Table 2 lists the results of our fitting various spectral models to the data that were least impacted by pileup, that from ObsID 365. All errors in the Table (and in § 3) are 90-percent-confidence single parameter uncertainties. The power law fits were performed with and without corrections for pileup. Ignoring pileup, we found results consistent with the previous analysis of Smith & Wilson (2001). We applied the Davis (2001) pileup correction as implemented in XSPEC 11.2 with the pileup parameter fixed at 0.5 (for small amounts of pileup allowing to vary does not improve the fits but simply increases the uncertainty). Comparing the two power law fits in Table 2 we see that the pileup-corrected spectral index is steeper as one would expect.
The other spectral fits listed in Table 2 also have the pileup correction applied. The 10-keV thermal bremsstrahlung model formally provides the best fit amongst the models. However, given the uncertainties introduced by applying the correction for pileup, the underlying variability of the source, and the small variation in the values of the C-statistic, the other models are equally acceptable. Therefore, we cannot constrain the nature of the source from these spectral analyses.
| Model | Parametera | C-statistic | Fluxb | |
|---|---|---|---|---|
| cm-2 | 646 dof | erg cm-2 s-1 | ||
| power law (uncorrected) | 1.020.12 | 1.440.14 | 580.3 | 5.0 |
| power law | 1.090.12 | 1.600.15 | 580.9 | 5.2 |
| bremsstrahlung | 1.010.10 | 12.2 | 578.5 | 5.1 |
| diskbb | 0.820.08 | 2.04 | 579.0 | 5.0 |
Note. —
aPower law index, ; or bremsstrahlung temperature, , in keV;
or disk blackbody model innermost disk temperature, , in keV.
bObserved flux (0.5 - 8.0 keV).
During the interval covering the 1500 s at eclipse minimum, 26 counts were collected. By Chandra standards the source is bright. The best fitting absorbed power law requires a steeper index and a smaller column than that listed in Table 2. We also fit these data with a mekal model assuming a column density fixed at cm-2. The best fit temperature is keV, and the observed flux (0.5 to 8 keV ) is erg cm-2 s unabsorbed).
For the flare-like event at the end of the eclipse, 19 counts were collected, and only two had energies less than 2 keV. If we assume the power law index has not changed from the value listed in Table 2, the absorbing column would be near cm-2. Such a high column is consistent with what one expects from eclipsing material in the line of sight. A much flatter power law with a much smaller column also provides an acceptable fit (though more difficult to provide an astrophysically sound explanation).
2.2 ObsIDs 374 & 62877
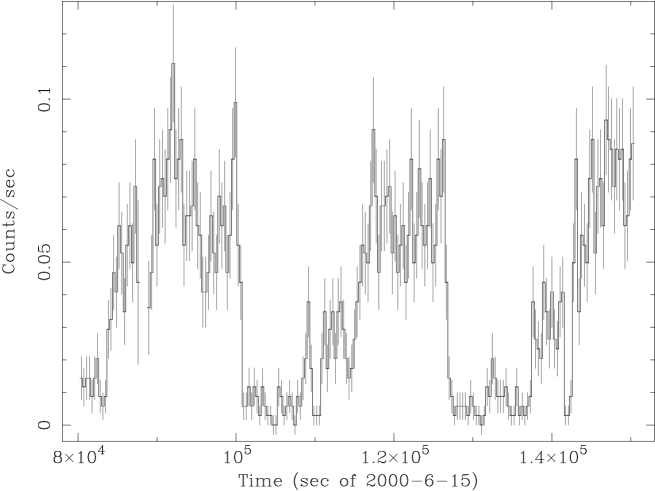
The longest consecutive set of Chandra observations (ObsID’s 374 & 62877) took place in 2000 June. The HETGS data were analyzed by Bauer et al. (2001) who discovered a ks period using the counts from the zero-order image to form the light curve. We have repeated this analysis including the first-order flux from both the High Energy Grating (HEG) and Medium Energy Grating (MEG) which more than doubled the number of counts to . This time series is shown in Figure 2.
The 27 ks periodicity is apparent and has been confirmed with long Beppo-Sax observations (Bianchi et al. 2002) and by us ( § 3). The source is “high” for about half the period and there are suggestions of flickering. Bauer et al. (2001) noted that this light curve looks like one characteristic of an AM Her type magnetic CV (see, for example, the light curve of WW Hor, Tennant et al. 1994). In an AM Her, the matter is being funneled by a magnetic field onto a pole of a white dwarf. If the polar cap is visible, then the source is bright, but if the polar cap is behind the dwarf, then the source is dim. This very naturally leads to a square wave profile. As some matter can fall onto the second pole, it is possible to see some flux in the dim orbital phase. In this scenario, flickering may arise from inhomogeneities in the accretion flow caused by Rayleigh-Taylor or Kelvin-Helmholtz instabilities (Hameury, King & Lasota 1986) or from thermal instabilities of shocks in the accretion column (Imamura, Wolff & Durisen 1984; Saxton et al. 1998). Magnetic CVs can also possess an accretion disk, in which case they are referred to as intermediate polars (IPs). In the Chandra observations, CG X-1 is dim (less than 10% of the high rate) for about 25% of the 27 ks cycle. If an accretion disc is present, some of the X-rays emitted from the accreting pole can be scattered by the accretion disk. However, this scattered radiation contributes no more than 10% of the flux, at least during this particular observation.
Analysis of the zeroth order spectrum was reported in Bauer et al. (2001). We extracted the dispersed spectrum with the express purpose to search for line features. No strong lines were detected, and we set an upper limit to any narrow line of about photons cm-2 s-1. This upper limit corresponds to an equivalent width of 70 eV for a line near 1.7 keV and 450 eV for a line near 6.4 keV. The underlying continuum emission was well fit by either a thermal bremsstrahlung model with a temperature of keV or a Mekal model with similar temperature and an abundance of 0.1 of the solar value.
After accounting for pileup, disparate detector configurations, and the presence/absence of the grating it is apparent that the source has undergone a change of state between the 2000 March and June observations. The average (peak) flux decreased by a factor of 6 (4) and the fraction of time spent at low counting rates increased from % to %. Because of the uncertainty in the orbital period it is impossible to predict, with sufficient accuracy, the eclipse location. Furthermore, an eclipse during the low rate interval would not be detectable above the background.
2.3 ObsIDs 355 & 2454
During the other two Chandra observations (ObsIDs 355 & 2454) the flux was low and highly variable resembling that shown in Figure 2 in the time interval (1.08 1.17) s, and we were unable to glean any information from these observations that had not already been discussed by Bianchi et al. (2002).
3 The XMM-Newton Observations
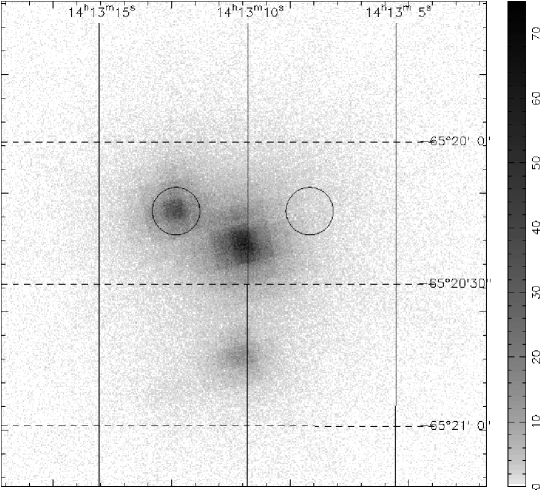
XMM-Newton observed the Circinus galaxy on 2001 Aug 6 for 104 ks (ObsId 0111240101). We first added together data from the EPIC-PN, MOS1 and MOS2 detectors. The summed image is shown in Figure 3 and CG X-1 lies in the wings of the point spread function (PSF) from the nucleus of the galaxy. In addition, another source CG X-2 (using the notation of Bauer et al. 2001) is also nearby. We therefore selected the background region as shown in Figure 3 to remove possible contamination by both the nucleus and CG X-2.
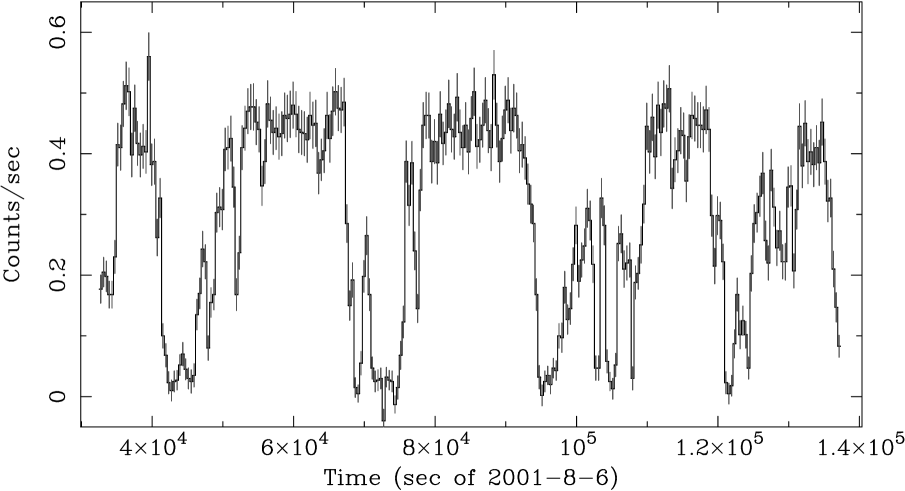
The background subtracted light curve is shown in Figure 4. The 27-ks period is obvious. Due to a longer observation and the higher number of counts than in the Chandra data we obtain a better estimate of the period. By maximizing the statistic through epoch folding we find a period of s (one sigma error).
The folded light curve is shown in Figure 5. It does not necessarily follow that any one of the dips in the light curve is an eclipse. However, if we assume that there is an eclipse, then the dip centered at phase 0.63 is the best candidate. In the Chandra data the count rate during the eclipse was about 5% of the count rate outside the eclipse. In the XMM-Newton data the count rate is below this value for the phase interval at giving one confidence that the eclipse identification is reasonable. The measured eclipse duration depends on the assumed binary period. Examining this dip for the range of periods consistent with the uncertainty in our period measurement leads to an eclipse duration of s.
The XMM-Newton-PN spectrum was extracted using the source and background regions as shown in Figure 3. An Fe line was present and was allowed for in our spectral modeling. Fitting these data to a blackbody did not yield an acceptable fit, with . A powerlaw provided a better fit, with . However, the best-fit model invoked thermal bremsstrahlung (). The parameters of this model are cm-2 and keV, consistent with the Chandra modeling discussed previously (Table 2 & §2.1). The Fe line had central energy of keV, a width of keV, and an equivalent width of eV. The detection of the line feature is below the upper limit set by our analysis of the Chandra data and thus consistent with that result. It is worth noting that the nucleus of the galaxy has very strong narrow lines at both 6.4 and 7.0 keV (Sambruna et al. 2001). These two lines are also seen in the CG X-1 spectrum prior to background subtraction. After subtraction the 7.0 keV feature is consistent with zero indicating that the bulk of the spectral contamination of the nucleus has been properly removed. Also, the narrow 6.4 keV feature also disappeared. The spectrum then shows a broad feature consistent with mixture of 6.4 and 6.7 keV lines, which we attribute to intrinsic emission from CG X-1. However, we cannot totally rule out that some of the 6.4 keV flux is the residual from incomplete removal of the contamination of the galactic nucleus. The average unabsorbed flux in the keV band was erg cm-2s-1.
4 The Optical Data
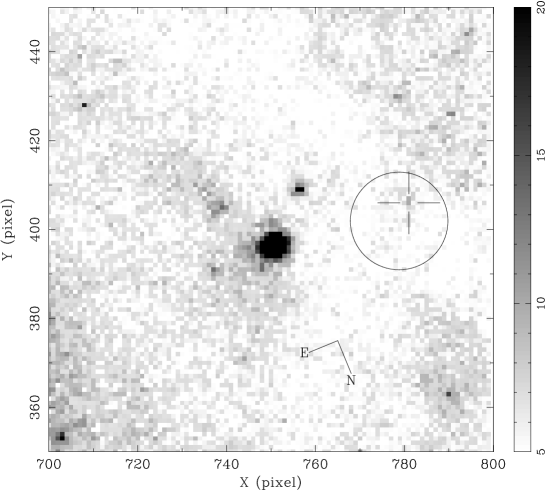
We analyzed the two HST WFPC2 images from the observations made on 1996 Aug 11 with the F606W filter. The two images were combined to remove cosmic rays. The coordinates were adjusted so that the nucleus would match in both the Chandra and HST data sets. The region near CG X-1 is shown in Figure 6.
The circle in Figure 6 is centered at the Chandra position of CG X-1 and has a radius of 0.5 arcsec. There is some weak diffuse emission inside the circle and the location of a point-like source automatically detected with the analysis software is indicated. This source is only 0.25 arcsec from the Chandra position and within our ability to register the two data sets. The HST magnitude in the F606W filter for the point source is 24.3. If we include all flux inside a circle of radius 0.23 arcsec (5 HST pixels) minus the flux in the annulus from 0.23 to 0.36 arcsec, then becomes 23.5. This emission can be seen in both original images and thus is unlikely to be an artifact of the cosmic ray removal process. There is a suggestion of this source in Figure 2 of Bauer et al. (2001) where one sees a slight excess at the bottom of the innermost contour. Thus, a conservative upper limit to an optical counterpart is =24.3 and it is quite possible that there is, in fact, an optical point source near the Chandra source.
5 The Nature of the X-ray source
5.1 Constraints implied by the orbital period
Here, we adopt the interpretation that the 26.2 ks (7.3 hr) period that we infer from the XMM-Newton data is the orbital period of a binary. We further suppose that it is a semi-detached binary system (as it is an X-ray source) and the orbit is circular. In this case, the separation of the centers of the two stars, , is given by
| (1) |
and the secondary star’s effective Roche-lobe radius, , is given by
| (2) |
(Eggleton 1983), where as the orbital period, and are the masses of the primary and secondary stars respectively, and is the mass ratio. It follows, for a large range of , that the mean density of a Roche-lobe filling secondary star is
| (3) |
where , and is the radius of the secondary. Thus, knowing the orbital period allows one to determine the mass-radius relation of the secondary star.
We show in Figure 7 the Roche-lobe radius of the secondary as a function of its mass for the 26.2 ks orbital period. In the same figure we show also the mass-radius relations of a star at the zero-age main-sequence (ZAMS) and at the stage that it begins to evolve away from the main sequence (TAMS). (The case of a core of a more massive evolved star is considered in § 5.4.) From Figure 7 we can see that for a variety of masses of the compact star — from that typical of white dwarfs (0.7 and 1.0 M⊙) to stellar-mass black holes (10 M⊙) to the small version of IMBHs (50 M⊙) — that the near-main sequence mass-donor (secondary) star has a mass 1 M⊙.
5.2 Constraints implied by the eclipse duration
X-rays are emitted from near the surface of the compact star in binary systems and so the emission region is much smaller than the orbital separation. If the binary has a sufficiently large orbital inclination , then the emission region can easily be eclipsed by the mass-donor star. The eclipse fraction is
| (4) |
(eqn. 2.64 of Warner 1995), and its maximum value is
| (5) |
where and is the eclipse duration.
We use the observed and Equation (4) to constrain the size of the mass-donor star and the orbital inclination. Furthermore, we can set constraints on the mass ratio, , through the transcendental equation
| (6) |
We show in Figure 8 the eclipse fraction, , as a function of the inverse of the mass ratio, for different orbital inclinations, . In § 2.1 we found that the eclipse duration was 1500 s. In § 3 we found the eclipse duration to be 1000 s. An eclipse duration of 1000 s corresponds to , implying that the maximum value for is 60 (which requires an extreme orbital inclination of ). Since the secondary (mass-donor) is less massive than M⊙ (§ 5.1), this now implies that the mass of the compact star is M⊙. For modest orbital inclinations around 70∘, both the Chandra and XMM-Newton data suggest that the compact star is much less massive than 10 M⊙.
In summary, an orbital period of 7.3 hr implies a mass 1 M⊙ for a main sequence secondary star. The measured eclipse duration (1000 s 1500 s) requires the ratio to be smaller than 60. Thus, if CG X-1 is an eclipsing binary, it certainly can not contain an IMBH with a mass M⊙.
5.3 CG X-1 as a Stellar Mass Black Hole in Circinus
If CG X-1 is a binary belonging to the Circinus galaxy and it contains a SMBH of mass 10M⊙ with a main-sequence companion, then its X-ray emission must be very anisotropic or, otherwise, greatly violate the Eddington limit. Assuming isotropic emission, the observed X-ray flux corresponds to erg s-1 at the 4 Mpc distance of Circinus. To avoid exceeding the Eddington limit, the emission must be beamed into a cone confined to about 10% of the sky. Assuming an eclipsing system, a substantial fraction of the beam must therefore illuminate the companion star. We estimate that, if this is true, the energy intercepted by the secondary star in CG X-1 in one year is erg.
We have deduced from the orbital period (§ 5.1) that the companion star has a mass M⊙. Main-sequence stars of this mass have an intrinsic luminosity erg s-1, several orders of magnitude less than the power in X-rays that the secondary star in CG X-1 intercepts. The gravitational binding energy of a star of mass and radius is
| (7) |
For a star of mass 1.0 M⊙, erg. If X-ray emission from CG X-1 is beamed, the large amount of energy intercepted by the secondary star not only drives the star out of thermal equilibrium but also can evaporate it within a mere yr. Since it is very unlikely that we have happened to come upon such a short-lived system, we argue that CG X-1 is probably not a SMBH in the Circinus galaxy.
5.4 CG X-1 with a core He-burning companion
Our arguments against the interpretation that CG X-1 is a IMBH or a SMBH are based on the two assumptions: (1) it is an eclipsing system; and (2) the companion is a main-sequence or a slightly evolved star. The assumption of a main-sequence or a slightly evolved star is reasonable, considering stars spend the vast majority of their lifetimes at this evolutionary phase. However, if the black-hole interpretation is retained, the companion star could be at a more evolved stage or have undergone a common envelope phase. In close binary systems, the compact remnant may spiral into the envelope of a massive companion, removing the hydrogen-rich layers, and leave an exposed core (perhaps with a tenuous, low-mass, envelope) mass-donor star. The orbital period of CG X-1 can only constrain the mean density of the companion star, thus a more massive compact core within the Roche-lobe radius can be accommodated.
An example of a system that may have evolved in this manner is Cyg X-3 (e.g., van den Heuvel & de Loore 1973). The orbital period of 4.8 hr and the spectral similarity of the secondary to a WN8 Wolf-Rayet star (Koch-Miramond et al. 2002) are consistent with a core He-burning companion for Cyg X-3 of about 2 M⊙. However, at the distance of the Circinus galaxy, the companion would have to be very bright in the visible (§ 4). If we assume the companion is of low mass (say 2 M⊙) then this implies that the optical flux is fainter than the upper limit we set in §4 and that the optical identification is incorrect. But then, the lifetime problem discussed in the previous section is again relevant.
Thus, while we cannot definitively rule out the possibility of a He-core companion, there are arguments against this scenario. This possibility should be re-examined once the properties of X-ray sources with He-burning companions are better established.
5.5 CG X-1 as a foreground AM Her system
The orbital parameters that we have derived are consistent with those of AM Her systems (see e.g. Downes et al. 2001). We now comment on the arguments against the AM Her binary interpretation put forth by Bauer et al. (2001) and summarized in §1.
(1) The lack of a bright optical counterpart: One can always make a star appear fainter by moving it further away. Thus there are two parts to this argument. First the companion must be located within our Galaxy, and second the inferred X-ray luminosity cannot exceed the effective Eddington limit for a CV. The Galactic coordinates of the Circinus galaxy are 311.3, -3.8. This places Circinus near the Galactic plane and along a line-of-sight that passes the closest to the Galactic center at a distance of 5 kpc from the Sun. Thus, a reasonable distance estimate for purposes of discussion would be 5 kpc. There is a tendency for longer period AM Her systems (Patterson 1984) to have earlier spectral types (K5). If we assume a K5-V spectral type (MV=7.3, VR=1.0), the distance of 5 kpc and 5 magnitudes of visual extinction inferred from the X-ray absorbing column, one would have mV=25.8 and mR=23.8. The HST F606W filter bandpass includes flux from both V and R bands. If we assume the rate is dominated by the R-band flux then a distance slightly greater than 5 kpc would account for the HST data. On the other hand, if the spectral type is later than K5, the inferred distance would be less. We note that the long period AM Her system V1309 Ori (=RX J051542+01047; Garnavich et al. 1994) has an M0 companion. Thus there is no difficulty accounting for the optical flux.555If CG X-1 is a magnetic CV and if its optical luminosity is dominated by emission from the accreting material instead of from the companion star, then the HST brightness upper limit implies that the system could easily be outside the Milky Way, thus contradicting the AM Her interpretation. However, an XMM survey of AM Her systems finds that there is a roughly equal chance that an AM Her system is in an X-ray-on and in an X-ray-off state (Ramsay, G., private communication). In the X-ray-off state, the optical flux cannot be from an accretion disk as there is no accretion taking place. Thus it is possible that the optical emission of the source is dominated by the emission of the companion star during the HST observation. Further simultaneous X-ray and deep optical observations can clarify this issue.
In the above we have used the X-ray column to infer the reddening. This is reasonable since both the X-ray column and interstellar reddening are due to higher Z material (metals) and that it is possible that the interstellar medium has been enriched along this line of sight which is close to the galactic plane. Further, we note that no other source in the Circinus galaxy has an X-ray column significantly smaller than that seen for CG X-1 (Bauer et al. (2001)) and thus the argument that the column is not due to local extinction is bolstered. Conversely, one can assume that the Dickey & Lockman (1990) radio measurement of neutral hydrogen tells us the Galactic X-ray column, in which case the reddening should be based on a column of cm-2. For a typical gas to dust ratio, and assuming any intrinsic column does not contribute to the reddening, we now would have only 3 magnitudes of extinction. For this case, the assumed K5V star would need to be 2.5 times further away placing it 12.5 kpc from the Earth or 9.4 kpc from the Galactic center, still within our galaxy. Of course, the inferred X-ray luminosity would be 6 times greater which would make CG X-1 the most luminous accreting mCV ever observed. Even under these conditions, the case for an mCV is not ruled out.
The second part of the argument has to do with the inferred X-ray luminosity. Using the brightest observed flux and an assumed distance of 5 kpc gives a luminosity of erg s-1 (0.58 keV). For an accreting white dwarf the corresponding Eddington limit is where is the fraction of the white dwarf covered by the polar cap and is the Eddington limit for spherical accretion. For the inferred luminosity and a 0.5 M⊙ white dwarf, we find which is not unreasonable (see Wu & Wickramasinghe 1990). Although this hard X-ray luminosity is far higher than the average bolometric of AM Her-type systems ( erg/s Ramsay & Cropper 2003), it has been observed in another accreting magnetic cataclysmic variable. The unusual system GK Per, a very long period Intermediate Polar, has been observed at erg s-1 in the hard 2-20 keV Ginga band (Ishida et al. 1992).
To rule out an AM Her system one would have to show that most reasonable values for spectral type, reddening, assumed distance, etc. are not allowed. Since even the extreme case considered here is allowed, we conclude that an AM Her cannot be ruled out.
(2) The lack of a soft X-ray spectral component: Some AM Her systems exhibit both a soft X-ray emission pole and a hard X-ray emission pole as does the prototype system AM Her itself (Heise et al. 1985). The emission from the hard pole is mainly bremsstrahlung of keV, and the emission from the soft pole is black-body radiation at a temperature eV. The high column ( 1022 cm-2) associated with CG X-1 makes it essentially impossible that such a low temperature black-body could have been detected. Further, some AM Her systems only show the hard X-ray pole (e.g. CE Gru, Ramsay & Cropper 2002).
(3) The orbital period exceeds that of most AM Her systems: The 7.3-hr period of CG X-1 is, in fact, shorter than the 7.98-hr period of the AM Her system V1309 Ori (Garnavich et al. 1994). Provided that the white dwarf has a magnetic moment large enough to lock the binary into synchronous rotation (see e.g. Wu & Wickramasinghe 1993), the orbital period of an AM Her system does not have to be in the range between 1.5 and 4 hr.
(4) The source shows quasi-periodic like variability: AM Her binaries also show strong X-ray flickering, e.g. AM Her (Heise et al. 1985) and UZ For (Ramsay et al. 1993).
(5) The probability of a foreground AM Her system in the field is low: This is perhaps the strongest argument against the AM Her interpretation. The Circinus galaxy lies close to the Galactic Plane (), which increases the chance of detecting a foreground star in this field. In fact, Bauer et al. (2001) calculated that they expected one background source in the 2 arcmin radius from the Circinus galaxy nucleus where they found 16 sources. The Log-N - Log-S curve of the Circinus galaxy steepens above () and the Log-N - Log-S curve for the Galactic Plane is fairly flat in this region (index , Sugizaka et al. 2001). Thus, in looking toward the Circinus Galaxy, the brighter sources are more likely to be in our Galaxy. Nevertheless, the chance probability for such a source in the field, and further for that source being a magnetic CV is low. However, the argument that CG X-1 is not a foreground object in the Milky Way is statistical, and if only one object is considered there can always be an exception — however small the probability.
6 Summary
We presented spectral and timing analysis of the x-ray source CG X-1 using archival Chandra, XMM-Newton, and HST data. The XMM-Newton spectrum was best fit by a thermal bremsstrahlung model with keV. Based on the interpretation that the observed period is orbital and an assumed main sequence companion, the companion star is 1 M⊙. A possible eclipse constrains the mass of the primary compact star to less than 60 M⊙, thus ruling out an IMBH. Further, we showed that if one assumes the source is a SMBH binary in the Circinus galaxy, then the high luminosity of the X-ray source coupled with the small orbital separation and small mass of the companion would quickly drive the companion out of thermal equilibrium. The high X-ray luminosity in this case also causes the companion to evaporate within yrs. These arguments make it unlikely that CG X-1 is associated with the Circinus galaxy. Based on our analysis of extant HST data we have shown that optical observations do not rule out a K5 or later companion star in the Milky Way. Finally, we emphasize that the roughly square-wave light curve (Figure 2) is similar to that of AM Her systems where the accretion is funneled onto a single pole of a white dwarf and an accretion shock is formed. When the source counting rate is high throughout the orbit (as in Figure 1), accretion is either occurring onto two poles of the white dwarf or a disk has formed. Such changes are naturally explained by the presence of the magnetic white dwarf (see e.g. Warner 1995 and references therein). While the chance probability of finding an AM Her system in this field is small, the AM Her interpretation is consistent with all the data and cannot be ruled out. Further X-ray and optical observation are called for to firmly establish the nature of this source.
References
- (1) Arnaud, K. 1996, in Astronomical Data Analysis Software and Systems V, ASP Conference Series 101, ed. G. Jacoby & J. Barnes (San Francisco:ASP) 17
- (2) Bauer, F. E., et al. 2001, AJ, 122, 182
- (3) Bressan, A., Fagotto, F., Bertelli, G., & Chiosi, C. 1993, A&AS, 100, 647
- (4) Bianchi, S., Matt., G. , Fiore, F., Fabian, A. C., Iwasawa, K.,& Nicastro, F. 2002, A&A, 396, 793
- (5) Colbert, E. J. M., & Mushotzky, R. F. 1999, ApJ, 519, 89
- (6) Cropper, M. 1990, Space Sci. Rev., 54, 195
- (7) Davis, J. 2001, ApJ, 562, 575
- (8) Dickey, J. M., Lockman, F. J. 1990, ARAA, 28, 215
- (9) Downes, R. A., Webbink, R. F., Shara, M., Ritter, H., Kolb, U., & Durebeck, H. W. 2001, PASP, 113, 764
- (10) Ebisuzaki, T., et al. 2001, ApJ, 562, L19
- (11) Eggelton, P. P. 1983, ApJ, 268, 368
- (12) Garnavich, P. M., Szkody, P., Robb, R. M., Zurek, D. R., & Hoard, D. W. 1994, ApJ, 435, L141
- (13) Hameury, J.-M., King, A. R. & Lasota, J. P. 1986, MNRAS, 218, 695
- (14) Heise, J. et al. 1985, A&A, 148, L14
- (15) Imamura, J. N., Wolff, M. T. & Durisen, R. H., 1984, ApJ, 276, 667
- (16) Ishida, M., Sakao, T., Makishima, K., Ohashi, T., Watson, M. G., Norton, A. J., Kawada & Koyama, K. 1992, MNRAS, 254, 647.
- (17) King, A. R., Davies, M. B., Ward, M. J., Fabbiano, G. & Elvis, M. 2001, ApJ, 552, L109
- (18) King, A. R. 2002, MNRAS, 335, L13
- (19) Koch-Miramond, L., Ábrahám, P., Fuchs, Y., Bonnet-Bidaud, J. -M., & Claret, A. 2002, A&A, 396, 877
- (20) Körding, E., Felcke, H., & Markoff, S. 2002, A&A, 342, L13
- (21) Matsumoto, H., et al. 2001, ApJ, 547, L25
- (22) Patterson, J. 1984, ApJS, 54, 443
- (23) Ramsay, G., & Cropper, M. 2002, MNRAS, 335, 918
- (24) Ramsay, G., & Cropper, M. 2003, MNRAS, 338, 219
- (25) Ramsay, G., Rosen, S. R., Mason, K. O., Cropper, M. S., & Watson, M. G. 1993, MNRAS, 262, 993
- (26) Sambruna, R. M., et al. 2001, ApJ, 546, L9
- (27) Saxton, C. J., Wu, K., Pongracic, H. & Shaviv, G. 1998, MNRAS, 299, 862
- (28) Smith, D. A. & Wilson, A. S. 2001, ApJ, 557, 180
- (29) Sugizaki, M., Mitsuda, K., Kaneda, H., Matsuzaki, K., Yamauchi, S., & Koyama, K. 2001, ApJS, 134, 77
- (30) Swartz, D. A., Ghosh, K. K., McCollough, M. L., Pannuti, T. G., Tennant, A. F., & Wu, K. 2003, ApJS, 144, 213
- (31) Tennant, A. F., Bailey, J., Wickramasinghe, D. T., Wu, K., Ferrario, L., & Hough, J. 1994, MNRAS, 271, 733
- (32) Tennant, A. F., Wu, K., Ghosh, K. K., Kolodziejczak, J. J., & Swartz, D. A. 2001, ApJ, 549, L43
- (33) van den Heuvel, E. P. J., & de Loore, C. 1973, A&A, 25, 387
- (34) Warner, B. 1995, Cataclysmic variable stars, Cambridge University Press, Cambridge
- (35) Weisskopf, M. C. 2002, in Proceedings Jan van Paradijs Memorial Symposium “From X-ray Binaries to Gamma-Ray Bursts”, Eds. E. van den Heuvel, L. Kaper and E. Rol, PASP Conf. Series, in press
- (36) Weisskopf, M. C., Brinkman, B., Canizares, C., Garmire, G., Murray, S., & Van Speybroeck, L. P. 2002, PASP, 114, 1
- (37) Wu, K. & Wickramasinghe, D. T. 1990, MNRAS, 246, 686
- (38) Wu, K. & Wickramasinghe, D. T. 1993, MNRAS, 260, 141