A Submm View of the Universe: Clues to the Formation of Massive Galaxies
Abstract
We discuss recent advances in the study of dusty, massive galaxies at arising from the first extensive spectroscopic surveys.
Institute for Computational Cosmology, University of Durham, Durham DH1 3LE, UK
California Institute of Technology, Pasadena, CA91125, USA
Astronomy Technology Centre, Royal Observatory, Blackford Hill, Edinburgh EH9 3HJ, UK
1. Introduction
There is a growing evidence for the existence of a population of massive galaxies at comparatively early epochs in the Universe, –2 (e.g. Franx et al. 2003; Glazebrook et al. 2004). As extreme examples of the process of galaxy formation these systems provide a strong test of theoretical models and an excellent opportunity to observe the interplay of the physical processes involved in galaxy formation. The first question that this population poses is: When and how were these massive galaxies formed? Are they assembled on a timescale comparable to their star-formation in a single massive burst, or from a more prolonged build-up from sub-components which had already undergone substantial star formation?
Observations from the local Universe provide some information on the formation history of massive galaxies. The most luminous, and by implication most massive, galaxies in the local Universe are the giant ellipticals (gE’s) which frequently reside in high-density regions such as clusters. The stellar population of these systems are dominated by old, metal-rich stars suggesting that the bulk of their star-formation activity occurred at high redshifts and hinting at a connection with the massive galaxies seen at high-redshifts, including the passive component of the Extremely Red Object (ERO) population. Quantitative constraints can be placed on the formation redshift from the identification of luminous early-type galaxies in clusters out to , as well as the homogeneity of the colours of these bright galaxies, which imply their stars were formed at –3 (Ellis et al. 1997; Blakeslee et al. 2003).
The gE’s have luminosities of –10L (1010–1011L⊙) and space densities of – Mpc-3 respectively. The central 1-Mpc of a rich cluster can easily contain L⊙ of stars in the L∗ gE population, as well as a substantial amount of metals in the intracluster medium (M⊙ of Fe, Renzini 1997). Further insights into the mode of their assembly comes from modeling the variation in colour of the elliptical population with luminosity (the colour-magnitude relation) and the internal colour gradients within individual elliptical galaxies. Both of these observational trends can be reproduced in models where the metallicity of the stellar populations in gE’s is regulated by the on-set of a superwind in a single, massive starburst (Kodama & Arimoto 1998; Tamura et al. 2000). The presence of a substantial mass of metals in the intracluster medium (and little evolution in this fraction out to ) also suggests significant outflows of material from the cluster population at (transporting energy as well as the metals) and lends credence to the existence of intense, high-density and wind-generating starbursts during the formation of these massive galaxies.

What other observational tests can distinguish between the possible formation scenarios of massive galaxies? If the activity required to produce the population of massive galaxies in a rich cluster occurred over a short period of time, say Gyrs (or between –3), this would need an average star formation rate (SFR) of M⊙ yr-1 in a volume of roughly 1000 Mpc-3. The visibility of this activity of course depends on how it is distributed. If the galaxies form as single entities then the bulk of this activity will occur in massive gas-rich systems on a timescale which is probably no more than 100-Myrs – each must therefore form stars at 200 M⊙ yr-1. Locally such high levels of star-formation activity are uniquely associated with highly-obscured ultraluminous infrared galaxies (ULIRGs) such as Arp 220, which has LL⊙. Dusty, gas-rich galaxies of this luminosity would be identifiable via their strong, redshifted far-infrared emission in the submillimetre (submm) waveband. Alternatively, if the massive galaxies form through the more extended merger of many subclumps then the individual star-formation events will be much less intense, 10’s M⊙ yr-1. Thus one simple route to test the formation mechanism of massive galaxies is to search for populations of strongly-clustered and gas-rich, luminous submm galaxies (SMGs) at –3, using submm cameras such as SCUBA on the JCMT (Holland et al. 1999) or MAMBO on the IRAM 30-m.
2. Locating SMGs and estimating their redshifts
A population of apparently luminous submm sources has been identified in deep maps with SCUBA and MAMBO, with a surface density of 0.25 per sq. arcmin brighter than 5 mJy at 850m. Moreover, gravitational lens-augmented submm surveys show that most of the extragalactic background in the submm arises in sources with apparent fluxes in the decade between 5 mJy and mJy (e.g. Smail et al. 2002; Cowie et al. 2002). However, the book-keeping exercise of resolving the submm background misses the critical issue — What is the nature of the bright sources making up the background and how do they relate to the formation of massive galaxies?
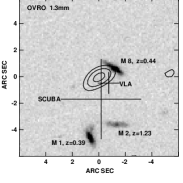
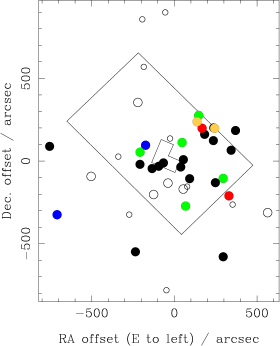
Measuring the redshift distribution of SMGs has been a crucial aspect of our interpretation of this population. In particular, with a sufficiently accurate redshift for an SMG it is possible to search for molecular CO emission which would confirm the masses and gas content of these systems. The measurement of a spectroscopic redshift for an SMG came within weeks of the first deep SCUBA map, with the identification of SMM J023990135 as a ULIRG Seyfert-2/BAL-QSO at (Ivison et al. 1998). Subsequent studies of larger samples of SMGs took a variety of approaches to try to identify counterparts in the optical and near-infrared and then attempt to estimate the likely redshifts photometrically or spectroscopically (Hughes et al. 1998; Smail et al. 1998; Barger et al. 1999; Lilly et al. 1999; Frayer et al. 2003). The complication in identifying optical/near-infrared counterparts to SMGs results from the large submm error-boxes (due to the poor signal-to-noise of the detections and the large beam of SCUBA) which may contain many plausible counterparts (Fig. 1). As expected for a young field, a fair proportion of the identifications initially suggested proved incorrect, compare Smail et al. (2002) and Frayer et al. (2003) with Smail et al. (1998) or Dunlop et al. (2003) with Hughes et al. (1998), which at least demonstrates that we’re making progress. What we learned was that there is no easy method to identify an SMG from its optical magnitude or colours – for example their I-band counterparts span a range of 10,000 in brightness and while they are on-average redder than the typical field galaxy, this may not be a sufficiently unique feature to unambiguously locate the submm source (rather than a companion).
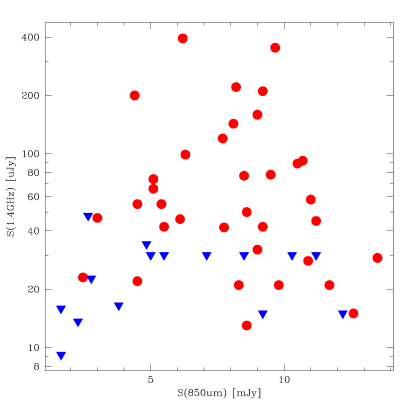
In contrast, the radio waveband provides a relatively clean route to accurately locate the position of the submm source. This arises from the tight correlation between the far-infrared emission from dust heated by young, massive stars and the synchrotron emission in the radio waveband, which has its origin in electrons accelerated in supernovae remanents from the same young, massive stars. This close relationship between the far-infrared and radio emission suggests that many SMGs should be detectable at 1.4 GHz, and indeed 60–70% of the 5-mJy SMG population appear to have radio counterparts brighter than about 30Jy (Fig. 1; Chapman et al. 2002; Ivison et al. 2002) [We’ll discuss the missing third of the population in more detail below]. The astrometric precision and resolution of 1.4-GHz VLA maps taken in A/B configurations thus provides sub-arcsecond error-boxes for any radio counterparts to SMGs, substantially better than possible from the raw SCUBA (or MAMBO) maps.
As well as locating the SMGs, the radio waveband promised the opportunity of estimating their redshifts, without any reference to their optical/near-infrared counterparts, based on the form of the spectral energy distribution (SED) in the submm/radio wavebands (Carilli & Yun 1999; Aretxaga et al. 2002; Efstathiou & Rowan-Robinson 2003). Unfortunately, the precision of these estimates is low and concerns have been voiced about the degeneracy between the source redshift and its effective dust temperature (Blain 1999). In particular, these uncertainites mean the estimates are too crude to reliably target the sources for CO follow-up. In addition the redshift/temperature degeneracy means it is impossible to simultaneously estimate the redshifts and bolometric luminosities of these sources from their submm/radio colours and hence derive star formation densities for the SMG population.
The low precision and systematic degeneracies in the submm/radio photometric redshifts mean we still need a method for determining accurate and reliable redshifts for a large sample of SMGs. Until sensitive, broad-band CO millimetre spectrometers are in use we are forced back to measuring redshifts in the optical/near-infrared wavebands. Such deep spectroscopic observations on a case-by-case basis had yielded redshifts for only about seven robustly-identified SMGs, at =0.66–3.35, by the beginning of 2002. To make substantial progress in understanding the properties of SMGs we would need a sample an order of magnitude larger and hence we would need a more efficient technique. Here we are again aided by information from the radio, but rather than fluxes it is the precise positions which are the key.
3. Measuring redshifts for SMGs
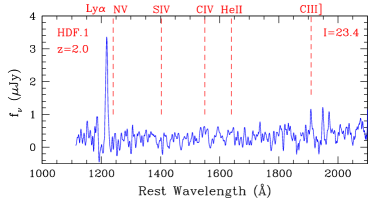
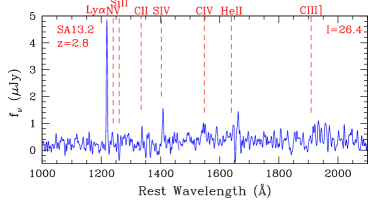
For the two-thirds of SMGs with Jy radio counterparts we have positions precise enough to place a spectrograph slit on the submm source (even if we can’t see an optical/near-infrared counterpart). By exploiting both wide-field submm surveys and targeted submm observations of radio sources it is possible to build-up high enough surface densities of SMGs that a reasonable multiplex gain () can be obtained within the typical field-of-view of a multi-object spectrograph on an 10-m class telescope, thus justifying exposure times of a few hours per field. Using this approach Chapman et al. (2003 & in prep.) have measured redshifts for 66 SMGs (Fig. 2 & 3). The two key elements of this survey, in addition to the radio-derived positions, are: the use of a highly-efficient, blue-optimised spectrograph: LRIS-B on Keck; and a cavalier disregard for the apparent magnitude of any optical counterpart.
The high through-put achieved with LRIS-B right down to the atmospheric cut-off at Å, represents a substantial gain over any other spectrographs on 8/10-m class telescopes. Its total through-put at 4000Å is % (including the telescope), compared to –20% for a single-beam spectrograph such as FORS or GMOS. More importantly, the through-put of LRIS-B drops only a third as fast as GMOS or FORS going from 4000Å to 3200Å. Thus detecting the third of the SMG population at –2.3 which have Ly- at Å, is an order-of-magnitude easier with LRIS-B (Fig. 2).
As with all redshift surveys of multiwavelength samples, the issue of spectroscopic completeness is complicated by the huge range in optical properties of SMGs. Nevetheless, we note that these sources, while sometimes faint in a particular optical passband, can still have strong emission lines at other wavelengths. Hence, the incompleteness is likely to be determined by the absence of strong lines in the observed wavelength region, rather than the exact continuum signal-to-noise achieved (which will usually be low). Moreover, as only a small fraction of their luminosity comes out in the UV/optical, %, the continuum properties in these wavebands are unlikely to be critical for our basic understanding of the characteristics of SMGs. Therefore we concluded that trying to produce a “complete” magnitude-limited redshift survey of SMGs will prove difficult (and is irrelevant anyway).
We have therefore targeted a sample of radio-detected SMGs with I=22–27 in seven fields (HDF, Lockman Hole, ELAIS-N2, SA13, SA22, CFRS 3hr and 14hr) with no regard to their optical magnitudes. The submm data comes from SCUBA mapping surveys in these areas, supplemented by photometry-mode observations of samples of optically-faint radio galaxies. The submm sources have 850-m fluxes of 3–20 mJy, with a median of mJy. In addition, we include a number of other sources in our masks: candidate counterparts or companions to SMGs without radio detections, identified through their extreme colours (e.g. EROs) or simply their optical properties (the latter are somewhat analogous to those targeted by Barger et al. 1999). These sources could be SMGs at somewhat higher redshifts than the radio-identified population (as the radio fluxes of SMGs at fall below our detection limit) or galaxies with colder characteristic dust temperatures lying at similar redshifts to the radio-identified population. We also include optically-faint Jy radio galaxies without SCUBA observations which could be subsequently targeted with SCUBA. Finally, we add in samples of UV-selected populations at –3.5 (Steidel et al. 2003 & in prep.). These are included to allow us to relate the clustering and environments of these various classes of high-redshift galaxies.

Exposure times ranged between 2–6 hrs per mask, with the equivalent of 10 clear nights used for the programme. The spectroscopic identification rate is high for such faint galaxies, %, underlining the frequent occurrence of strong emission lines in many systems, including Ly-, a surprising line to detect in these dusty galaxies (Fig. 2).
The median redshift of the population is with a quartile range of =1.9–2.6 (Fig. 3) and a space-density within the quartile range of Mpc-1. This confirms that most SMGs are luminous sources at sufficiently high redshifts that they could be the precursors of the massive galaxies identified at –2, as well as the progenitors of the old, massive elliptical galaxies seen at the present-day. If the submm-luminous phase of the SMG’s evolution lasts for Myrs (Smail et al. 2003a), this is roughly 10% of the cosmic time spanned by the quartile redshift range of the population. Hence to estimate the density of the present-day counterparts to this population we need to correct the apparent space density for the visibility of the bright SMGs at these redshifts by a factor of 10. The descendents of the SMGs will therefore have a space density of Mpc-3, comparable to L∗ ellipticals. A comparison of the SMG redshift distribution and that from the “classical” LBG photometric selection (Steidel et al. 2003) shows only a modest overlap, %, which might help explain the weak correlation between the two populations (Chapman et al. 2000; Webb et al. 2003).
The incompleteness in our radio-detected SMG survey, compared to a putative complete, purely submm-selected redshift survey has two components: a) the % of radio-detected SMGs where we fail to measure a redshift; b) the % of the SMG population which lack radio counterparts brighter than Jy. The former can be attributed to galaxies falling in the spectroscopic desert at and SMGs lacking strong emission lines (at similar redshifts to those we detect). While the latter may be either due to: i) sources with somewhat colder dust at similar redshifts to the bulk of the population; ii) a separate SMG population at much higher redshifts, ; iii) spurious submm detections. As we show in Fig. 3, the incompleteness due to radio non-identifications is consistent with that expected from the distribution of dust temperatures in the local luminous infrared galaxies (Chapman et al. 2003). This would place the missing population in the same volume as that probed by the radio-identified sources, which is supported by the redshifts of many of the tentative ERO and non-radio candidate SMG identifications. Alternatively, the lack of radio, X-ray and in some cases millimetre-band, counterparts to a modest fraction of SCUBA sources may simply point to some of these low significance detections being spurious (Alexander 2003; Greve et al. 2003).
4. Masses of SMGs
Armed with (relatively) precise redshifts for a substantial sample of luminous SMGs we can now directly tackle the issue of the dynamics, gas masses and fractions of this population to test whether these are consistent with those required for the monolithic progenitors of massive galaxies. To this end we are undertaking a long-term survey of the molecular CO emission from this population using the IRAM Plateau de Bure interferometer (PI’s Reinhard Genzel & Rob Ivison; Neri et al. 2003). This builds upon the earlier CO follow-up of SMG in the SCUBA Lens Survey (Frayer et al. 1998, 1999), and to date 10 SMGs are detected in CO, at –3.35 of which data for 5 have so far been published (Neri et al. 2003; Greve et al. in prep.). The mean 850m flux for these sources is 6.4-mJy, corresponding to a far-infrared luminosity of L⊙ and a star formation rate of M⊙ yr-1 for stars more massive than 5 M⊙. Their mean restframe V-band luminosity is L⊙ (based on their K-band magnitudes and corrected for lensing where appropriate) suggesting minimum starburst masses of M⊙, assuming mass-to-light ratios typical of Myr-old starbursts and a Salpeter IMF. The FWHM of the CO lines of the ensemble is km s-1 (this compares to 260 km s-1 for the FWHM of H emission lines in LBGs, Erb et al. 2003), with the emission typically spatially-unresolved ( kpc) giving dynamical mass of M⊙ assuming the systems are merging (c.f. Genzel et al. 2003; Neri et al. 2003). The H2 masses are similarly high, M⊙ (assuming low–metallicity gas and hence (CO/H2)=5, these gas masses would drop by a factor of if we used (CO/H2) for local ULIRGs) implying that the central regions are likely to be baryon-dominated. These gas reservoirs would support the observed star formation rates for 50 Myrs (assuming half is lost through outflows) and produce an additional M∗’s worth of stars in that time. Truncating or tilting the IMF to provide a larger fraction of high-mass stars will potentially prolong the active phase (and decrease the visibility correction to the estimated space density). Such a tilt would also explain the large metal yield required to produce the iron abundance in the intracluster medium.
The availability of precise redshifts for a large sample of SMGs has allowed us to confirm that these are gas-rich, massive galaxies with individual characteristics consistent with the progenitors of L∗ massive galaxies seen at the present-day. Such galaxies are expected to be strongly clustered and we can also test this with our sample.
5. Clustering of SMGs
Trying to measure the clustering strength of SMGs from their distribution on the sky is one situation where the small number statistics in current surveys and the very broad redshift selection function of this population conspire to make the estimates very uncertain (Scott et al. 2002; Borys et al. 2003: Webb et al. 2003). Even the largest area submm surveys correspond to 1:300 aspect ratio pencil-beams, with widths Mpc and lengths of 3 Gpc. Hence, redshifts for SMGs are again very helpful for making progress.
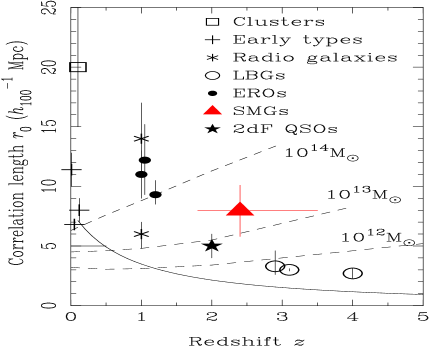
Using our spectroscopic survey we can identify SMGs which lie close to each other in redshift. We therefore search for small-velocity separation associations ( km s-1) within each field and find four close-pairs of SMGs, a triplet and quintet all with projected separations of Mpc on the sky (Fig. 4). The strong clustering of the SMG population is underlined by the fact that we can reliably detect the clustering signal in a sample of only 66 SMGs spread across seven distinct fields. The likelihood of finding these systems by random chance is 0.01% and using Monte Carlo simulations we can constrain the correlation length of the sample to be rh-1 Mpc. This suggests that SMGs represent one of the most strongly clustered populations of high-redshift sources known (Fig. 4). The simple interpretation of this clustering is that SMGs are a highly-biased population residing in massive halos, M⊙. Their clustering strength (although uncertain) is consistent with them being the precursors of the passive ERO population at and perhaps evolving into the massive gE’s seen in clusters at the present-day (Fig. 4).
There is also evidence for clustering of the SMG population with other classes of high-redshift galaxies. For example, SMGs are found in the over-dense regions around high-redshift radio galaxies, which are also traced by LBGs, Chandra X-ray sources and Ly- galaxies (e.g. Stevens et al. 2003; Smail et al. 2003b). Less obscured galaxies are frequently found within Mpc of SMG’s, such as the companion to the multiply-imaged SMG behind A 2218 (Kneib et al. in prep.) or the Ly- emitter at close to SMM J023990135 behind A 370 (Santos et al. 2003). Equally the multiplets of SMGs appear to pin-point the redshifts of strong overdensities of UV-selected systems – for example the triplet of SMGs in the SA22 field lies in the well-studied “spike” of LBGs/Ly- sources (Steidel et al. 2000). This provides circumstantial support for the claim that SMGs reside in the highest density regions at –3, which evolve into the cores of clusters at the present-day.
6. Discussion and Conclusions
To summarise, we have exploited the broad overlap between bright submm sources ( mJy) and Jy radio sources (Jy) to precisely locate the sources of the submm emission. By targeting these with LRIS-B/Keck we have measured redshifts for at least half of the bright SMG population, confirming that these are high redshift, ultraluminous infrared galaxies at . The space density of these SMGs is higher than similar luminosity galaxies at the present-day and once the likely timescale for their visibility is taken into consideration they have a space density comparable to L∗ ellipticals at .
The precise redshifts for luminous SMGs enable us to search for CO emission from these systems using millimetre interferometers. These observations probe the gas mass and dynamics in the inner regions of the SMGs, showing that these are both massive and extremely gas-rich systems: median dynamical and gas masses of M⊙. The typical bright SMG in our survey hosts a reservoir of gas which is sufficient to produce the stellar mass of an L∗ galaxy on a timescale Myrs (in addition to their substantial existing stellar populations). These characteristics are precisely those expected for the prompt formation of massive galaxies through a rapid starburst at high redshifts. The connection between the high-redshift luminous SMG population, passive EROs at and massive galaxies at is further strengthened by the detection of strong clustering in the SMG population. This analysis also relies on the precise redshift measurements available from our Keck survey and shows that the SMGs at –3 may be more strongly clustered than either optical QSOs or LBGs at these epochs (although see Scannapieco & Thacker 2003). If the SMG halos are really this strongly clustered then it makes it difficult to see how these systems could evolve into typical LBGs. We note that this difference in the clustering strength of bright SMGs and typical LBGs is in the same sense as the factor of mass difference implied by their respective CO and H line widths. However, claims of stronger clustering in more luminous LBGs may provide a link between these two populations, as will on-going studies of the relative distribution of SMGs and the less luminous, but more common the UV-selected population at –3.
Acknowledgements
We thank our collaborators on the Plateau de Bure survey (Frank Bertoldi, Pierre Cox, Reinhard Genzel, Thomas Greve, Roberto Neri, Alain Omont and Linda Tacconi). IRS acknowledges support from the Royal Society and Leverhulme Trust. AWB acknowledges support through NSF grant AST-0205937.
References
Alexander, D.M., 2003, ESO/USM Venice workshop
Aretxaga, I., et al., 2003, MNRAS, 342, 759
Barger, A.J., et al., 1999, AJ, 117, 2656
Blain, A.W., 1999, MNRAS, 309, 955
Blakeslee, J., et al., 2003, ApJ, 596, L143
Borys, C., et al., 2003, MNRAS, 344, 385
Carilli, C., Yun, M.S., 1999, ApJ, 513, L13
Chapman, S.C., et al., 2000, MNRAS, 319, 318
Chapman, S.C., et al., 2002, ApJ, 570, 557
Chapman, S.C., et al., 2003, Nature, 422, 695
Cowie, L.L., et al., 2002, AJ, 123, 2197
Dunlop, J.S., et al., 2003, MNRAS, submitted
Efstathiou, A., Rowan-Robinson, M., 2003, MNRAS, 343, 322
Ellis, R.S., et al., 1997, ApJ, 483, 582
Erb, D., et al., 2003, ApJ, 591, 101
Franx, M., et al., 2003, ApJL, 587, L79.
Frayer, D., et al., 1998, ApJ, 506, L7
Frayer, D., et al., 1999, ApJ, 513, L87
Frayer, D., et al., 2000, AJ, 120, 1668
Frayer, D., et al., 2003, AJ, in press
Genzel, R., et al., 2003, ApJ, 584, 633
Glazebrook, K., et al., 2003, these proceedings
Greve, T.R., et al., 2003, ESO/USM Venice workshop
Holland, W., et al., 1999, MNRAS, 303, 659
Hughes, D., et al., 1998, Nature, 394, 241
Ivison, R.J., et al., 1998, MNRAS, 298, 583
Ivison, R.J., et al., 2002, MNRAS, 337, 1
Kodama, T., Arimoto, N., 1998, A&A, 334, 99
Lilly, S., et al., 1999, ApJ, 518, 641
Neri, R., et al., 2003, ApJ, in press
Overzier, et al., 2003, A&A, 405, 53
Renzini, A., 1997, ApJ, 488, 55
Santos, M.R., et al., 2003, ApJ, submitted
Scannapieco, E., Thacker, R., 2003, ApJL, 590, L69
Scott, S., et al., 2002, MNRAS, 331, 817
Smail, I., et al., 1998, ApJ, 507, L21
Smail, I., et al., 2002, MNRAS, 331, 495
Smail, I., et al., 2003a, MNRAS, 342, 1185
Smail, I., et al., 2003b, ApJ, in press
Steidel, C., et al., 2000, ApJ, 532, 170
Steidel, C., et al., 2003, ApJ, 592, 728
Stevens, J.A., et al., 2003, Nature, 425, 264
Tamura, N., et al., 2000, AJ, 119, 2134
Webb, T., et al., 2003, ApJ, 582, 6