11email: wkollat@uni-sw.gwdg.de
Spin orientation of supermassive black holes in active galaxies
Accretion of gas onto a central supermassive black hole is generally accepted to be the source of the emitted energy in active galactic nuclei. The broad emission lines we observe in their optical spectra are probably formed in the wind of an accretion disk at distances of light days to light years from the central black hole. The variable fraction of the emission lines originates at typical distances of only 1 to 50 light days from the central supermassive black hole. We derived a central black hole mass of in the Seyfert galaxy Mrk 110 assuming the broad emission lines are generated in gas clouds orbiting within an accretion disk. This figure depends on the inclination angle of the accretion disk. Here we report on the detection of gravitational redshifted emission in the variable fraction of the broad emission lines. We derive a central black hole mass of . These measurements are independent on the orientation of the accretion disk. The comparison of both black hole mass estimates allows to determine the projection of the central accretion disk angle to . in Mrk 110 and therefore the orientation of the spin axis of the central black hole.
Key Words.:
Accretion disks – Black hole physics – Gravitation – Line: profiles – Galaxies: active – Galaxies: individual: Mrk 110 –1 Introduction
Mass and spin of the central black holes in galaxies as well as geometry and kinematics of their immediate stellar and gaseous surroundings are of fundamental interest for understanding the origin of the enormous energies emitted in the nuclear regions of active galaxies (e.g. Blandford & Begelman blandford99 (1999), Murray & Cheng murray97 (1997)). Furthermore, the central black hole masses and their evolution might be connected to the general properties of their host galaxies. The black hole mass has been estimated in some active galaxies by reverberation mapping (e.g. Wandel et al. wandel99 (1999)). A basic assumption of this method is that the broad emission line gas is gravitationally dominated by the central black hole. Here a major uncertainty is introduced by the geometry and orientation of the line-emitting gas. An independent mass determination of the central black hole can be obtained by the gravitational redshift effect in the optical emission lines of active galaxies. However, in this respect only the detection of a gravitationally redshifted Fe K X-ray line has been reported in a few active galaxies (Tanaka et al. tanaka95 (1995), Fabian et al. fabian00 (2000)).
2 Observations and data reduction
We selected the narrow-line Seyfert 1 galaxy Mrk 110 as our primary target to determine the central black hole mass independently both by reverberation mapping and by gravitational redshift effects. From earlier long term campaigns we knew of the extreme continuum and line intensity variations in this galaxy (Bischoff & Kollatschny bischoff99 (1999), Peterson et al. peterson98 (1998)). We carried out our optical variability campaign with the 9.2m Hobby-Eberly Telescope (HET) at McDonald Observatory. We took 26 spectra of Mrk 110 between 1999 November 13 and 2000 May 14. All observations were made under identical conditions with exactly the same instrumentation at the HET. The spectra cover a wavelength range from 4200Å to 6900Å with a resolving power of 650. The data were reduced in a homogeneous way with IRAF reduction packages. In most cases we reached a S/N 100 per pixel in the continuum. Great care was taken of a very accurate internal calibration of the spectra with respect to wavelength and flux (Kollatschny et al.kollatschny01 (2001)).
3 Results and discussion
3.1 Mean and rms line profiles
We determined mean and rms emission line profiles of the most intense lines H, H, HeI5876, and HeII4686 from our variability campaign. The rms profiles are a measure of the variable component of the line profile. The profiles shown in Fig. 1 are plotted in velocity space and normalized to the same maximum intensity.

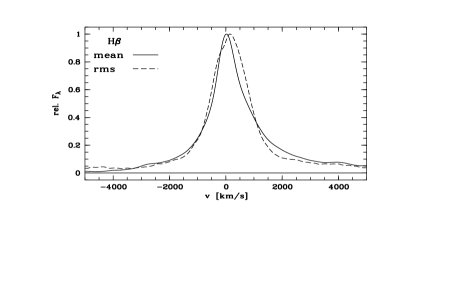
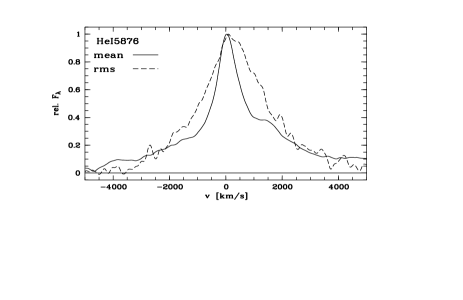
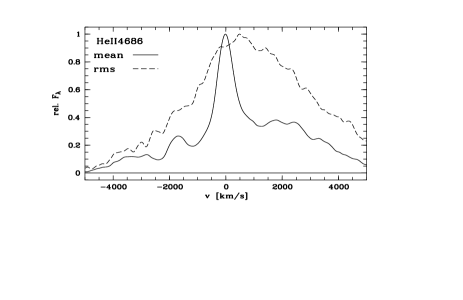
The fraction of the variable component in these lines amounts to 9, 12, 14, and 39% , respectively. The line widths (FWHM) of the rms profiles are listed in Table 1.
| Line | FWHM(rms) | (rms) | ||
|---|---|---|---|---|
| [km s-1] | [km s-1] | [days] | [] | |
| (1) | (2) | (3) | (4) | (5) |
| HeII | 4444 200 | 541 60 | 3.9 2 | 13 3 |
| HeI | 2404 100 | 186 60 | 10.7 6 | 12 4 |
| H | 1515 100 | 118 50 | 24.2 4 | 17 4 |
| H | 1315 100 | 74 50 | 32.3 5 | 14 5 |
3.2 Virial mass of the central black hole
We calculated the characteristic distances of the line emitting regions by cross-correlating the light curves of the emission lines with the optical continuum light curve. The broader emission lines originate systematically closer to the galaxy center in Mrk 110 (see Table 1) (Kollatschny et al. kollatschny01 (2001), Kollatschny kollatschny03 (2003)). The fraction of the variable line component is correlated with the distance of the line emitting region from the black hole. The distances of the line emitting regions we determined from the cross-correlation function (CCF) analysis correspond to the widths of the rms profiles (Table 1). The non-variable components of the emission lines originate at larger distances from the black hole. We determined the central black hole mass assuming Keplerian orbits of the line emitting clouds:
where v is the characteristic emission-line velocity (rms line width), is the gravitational constant, and c is the distance of the line emitting region ( = calculated cross-correlation lag of line emitting region). The derived black hole mass in Mrk 110 is
The dimensionless factor depends amongst other things on the geometry and (unknown) orientation of the BLR. We could show that the velocities in the broad emission line region are not randomly oriented as for instance in a turbulent flow but that the lines are formed in an accretion disk (Kollatschny et al. kollatschny02 (2002), Kollatschny kollatschny03 (2003)). The line widths of the rms spectral lines are interpreted as the line-of-sight Doppler widths. We observe only the projected velocity of the rotating accretion disk. Thus, the derived mass is a lower limit. The systematic errors in the estimation of black hole masses by reverberation mapping have been discussed by Krolik (krolik01 (2001)). He pointed at a systematic underestimate of the central AGN mass caused by the possible inclination of the line emitting region.
3.3 Emission line shifts
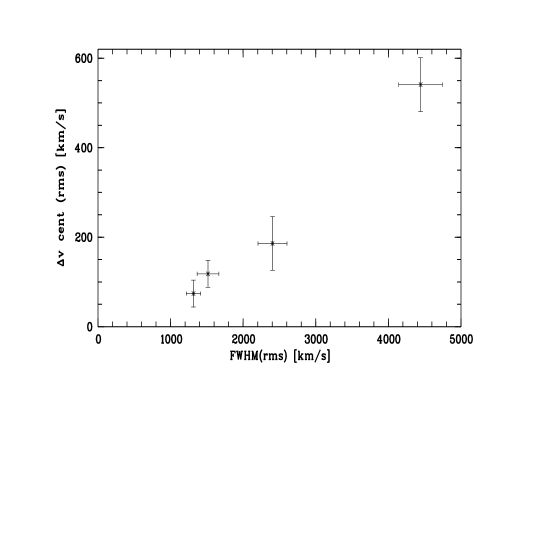
We determined from the spectra in Fig. 1 the shift of the rms line centers (uppermost 20%). It is a known effect that rms line profiles sometimes show narrow forbidden line residuals that are caused by variable seeing and small shifts in wavelength calibration (e.g. Kaspi et al. kaspi00 (2000)). The degree of this contamination is strongest in the HeI5876 line which is the weakest one. The redshift () of the rms profiles with respect to the narrow emission lines increases as a function of line width and ionization potential as seen in Fig. 1. The correlation of rms line width with observed central line shift is shown in Fig. 2.
High-ionization broad emission lines originate closer to the central supermassive black hole than the low-ionization ones (e.g. Peterson & Wandel peterson99 (1999), Kollatschny et al. kollatschny01 (2001)). The redshifts derived from different integrated emission lines in AGN often do not agree with each other. High-ionization broad emission lines are sometimes blueshifted with respect to the low-ionization broad emission lines and narrow emission lines (Gaskell gaskell82 (1982), Sulentic et al. sulentic00 (2000)). Therefore, the shift of the integrated broad line profiles cannot be explained by gravitationally redshift effects. But is has been demonstrated recently that the observed blueshift in the highly ionized lines is mimicked by absorption in the red line wings (Richards et al. richards02 (2002)). This effect is more pronounced in the higher ionized lines. Additionally, one has to consider that the integrated emission lines originate at distances of light weeks to light years from the black hole. A verification of a gravitational redshift in these lines is beyond the detection limit.
3.4 Central black hole mass derived from gravitational redshift
The variable broad line components originate far more closely to the central black hole than the constant line components. A gravitational redshift effect in this variable component might thus be present. We measured the differential shifts of the strongest rms emission profiles with respect to their mean line profiles (Fig. 1, Table 1). The observed shifts of the rms profiles are identified as gravitational redshifts. The mean profiles of the strongest broad emission lines are not shifted with respect to the forbidden narrow lines on the other hand. Therefore, the differential shifts of the rms profiles with respect to the narrow lines are identical to their shifts with respect of the mean profiles.
We calculated the central black hole mass in Mrk 110 using the formula (e.g. Zheng & Sulentic zheng90 (1990))
The distances () of the individual line emitting regions are known from the cross-correlation analysis (Table 1). We determined a black hole mass of to with a mean value of
from the line shifts. The rms line profile shifts are shown in Fig. 3 as a function of distance to the center.
The internal shifts of all four emission lines (H, H, HeI5876, and HeII4686) are different. They depend on the distance of the line emitting region from the center. It is intriguing that the black hole masses we derived from the four different line shifts are identical within the error limits. This verifies our interpretation of the observed differential line shifts as gravitaional redshifts.
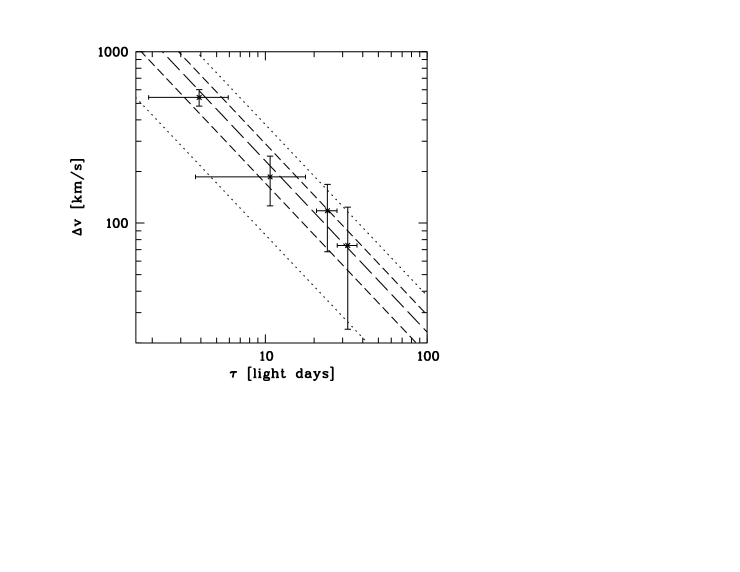
The dotted and dashed lines represent theoretical models. They show the correlation between distance (i.e. cross-correlation lag ) and gravitational redshift for different central black hole masses of 5.0, 10.0, 13.5, 17.0, and , respectively.
Other evidence for the detection of a gravitational redshift has been shown before in the spectra of the Seyfert galaxy NGC4593 (Kollatschny et al. kollatschny97 (1997)). In this galaxy the Balmer lines originate at distances of 2 to 4 light days only. On the other hand, the quality of the spectra in the NGC4593 variability campaign was not as good as in Mrk110. The derived black hole mass in NGC4593 was by a factor of 1.6 higher in comparison to the mass derived from the line widths. An additional hint for a gravitational redshift can be seen in the HST spectra of the NGC5548 variability campaign. The line center of the rms CIV1550 profile is redshifted with respect to the mean profile by about 10Å (see Fig. 4 in Peterson peterson01 (2001)).
3.5 Inclination angle of central accretion disk
The determination of black hole masses in AGNs through their gravitational redshift effect has clear advantages. The derived central black hole mass is not affected by the orientation of the central accretion disk in contrast to the mass derived from the emission line widths. It has been mentioned before that only an accretion disk model of the BLR in Mrk 110 can reproduce the observed line profile variations (Kollatschny et al. kollatschny01 (2001), Kollatschny kollatschny03 (2003)). The mutual comparison of both mass estimates gives us information on the orientation angle of the accretion disk: . For the narrow line Seyfert galaxy Mrk 110 we derive a nearly pole-on line-of-sight of the central accretion disk. The inclination angle amounts to . A disk inclination angle of has been previously estimated from line profile variations (Kollatschny kollatschny03 (2003)). This confirms independently the nearly pole-on view of the accretion disk in Mrk 110.
The variable HeII line component originates at a mean distance of 3.9 light-days ( cm) only. This distance corresponds to 230 Schwarzschild radii () for a central black hole mass of . It is very plausible that the rotation axis of the inner accretion disk is oriented parallel to the spin axis of the central black hole. Altogether, the black hole mass derived from the gravitational redshift is not only more reliable: a comparison with the black hole mass deduced from the line widths opens up the possibility to determine the orientation of the central black holes in radio-quiet AGN. A good test of the method proposed here would be to check the inclination of optical broad emission line regions with that of radio/optical jets in radio-loud objects.
Acknowledgements.
WK thanks the UT Astronomy Department for warm hospitality during his visit. He thanks K. Bischoff and M. Zetzl for valuable comments. Part of this work has been supported by the Deutsche Forschungsgemeinschaft, DFG grant KO 857/24 and DAAD.References
- (1) Bischoff, K., & Kollatschny, W. 1999, A&A, 345, 49
- (2) Blandford, R.D., & Begelman, M.C. 1999, Mon.Not.RAS, 303, L1
- (3) Fabian, A.C., Iwasawa, K., Reynolds, C.S., & Young, A.J. 2000, PASP, 112, 1145
- (4) Gaskell, M. 1982, ApJ 263, 79
- (5) Kaspi, S., Smith, P.S., Netzer, H., Maoz, D., Jannuzi,B.T., & Giveon, U 2000, ApJ 533, 631
- (6) Kollatschny, W. 2003, A&A, 407, 461
- (7) Kollatschny, W., & Bischoff, K. 2002, A&A, 386, L19
- (8) Kollatschny, W., & Dietrich, M. 1997, A&A, 323, 5
- (9) Kollatschny, W., Bischoff, K., Robinson, E.L., Welsh, W.F., & Hill, G.J. 2001, A&A, 379, 125
- (10) Krolik, J.H. 2001, ApJ 551, 72
- (11) Murray, N., & Cheng, J. 1997, ApJ 474, 91
- (12) Peterson, B.M 2001, Proceedings of a conference on ’The starburst-AGN connection’, ed. I.Aretxaga, Singapore: World Scientific, p.3
- (13) Peterson, B.M., Wanders, I., Bertram, R., et al. 1998, ApJ 501, 82
- (14) Peterson, B.M., & Wandel, A. 1999, ApJ 521, L95
- (15) Richards, G.T., Vanden Berk, D.E., Reichard, T.A., et al. 2002, Astron.J 124, 1
- (16) Sulentic, J.W., Marziani, P., & Dultzin-Hacayan, D. 2000, Ann. Rev, Astron. Astrophys 38, 521
- (17) Tanaka, Y., Nandra, K., Fabian, A.C., et al. 1995, Nature 375, 659
- (18) Wandel, A., Peterson, B.M., & Malkan, M.A. 1999, ApJ 526, 579
- (19) Zheng, W., & Sulentic, J.W. 1990, ApJ 350, 512