Structure and kinematics of candidate double-barred galaxies.††thanks: Based on observations carried out at the 6m telescope of the Special Astrophysical Observatory of the Russian Academy of Sciences, operated under the financial support of the Science Department of Russia (registration number 01-43), at the 2.1m telescope of the Observatorio Astronónico Nacional, San Pedro Martir, México, and from the data archive of the NASA/ESA Hubble Space Telescope at the Space Telescope Science Institute. STScI is operated by the association of Universities for Research in Astronomy, Inc. under NASA contract NAS 5-26555.
Results of optical and NIR spectral and photometric observations of a sample of candidate double-barred galaxies are presented. Velocity fields and velocity dispersion maps of stars and ionized gas, continuum and emission-line images were constructed from integral-field spectroscopy observations carried out at the 6m telescope (BTA) of SAO RAS, with the MPFS spectrograph and the scanning Fabry-Perot Interferometer. NGC 2681 was also observed with the long-slit spectrograph of the BTA. Optical and NIR images were obtained at the BTA and at the 2.1m telescope (OAN, México). High-resolution images were retrieved from the HST data archive. Morphological and kinematic features of all 13 sample objects are described in detail. Attention is focused on the interpretation of observed non-circular motions of gas and stars in circumnuclear (one kiloparsec-scale) regions. We have shown first of all that these motions are caused by the gravitational potential of a large-scale bar. NGC 3368 and NGC 3786 have nuclear bars only, their isophotal twist at larger radii being connected with the bright spiral arms. Three cases of inner polar disks in our sample (NGC 2681, NGC 3368 and NGC 5850) are considered. We found ionized-gas counter-rotation in the central kiloparsec of the lenticular galaxy NGC 3945. Seven galaxies (NGC 470, NGC 2273, NGC 2681, NGC 3945, NGC 5566, NGC 5905, and NGC 6951) have inner mini-disks nested in large-scale bars. Minispiral structures occur often in these nuclear disks. It is interesting that the majority of the observed, morphological and kinematical, features in the sample galaxies can be explained without the secondary bar hypothesis. Thus we suggest that a dynamically independent secondary bar is a rarer phenomenon than follows from isophotal analysis of the images only.
Key Words.:
Galaxies: kinematics and dynamics – Galaxies: spiral – Techniques: spectroscopic1 Introduction
More than a quarter of a century ago de Vaucouleurs (vauc (1975)) found that an inner bar-like structure was nested in the large-scale bar in the optical image of NGC 1291. The first systematic observational study of this phenomenon was made by Buta & Crocker (butacr (1993)), who published a list of 13 galaxies, where the secondary (inner) bar was arbitrarily oriented with respect to the primary (outer) one. In the following years the isophotal analysis technique made it possible to detect secondary bars in optical (Wozniak et al., woz (1995); Erwin & Sparke, erw99 (1999); Erwin & Sparke, erw03 (2003)) and NIR images of barred galaxies (Friedli et al., fri96 (1996); Jungwiert et al., jung (1997); Laine et al., laine02 (2002)). Up to now, we have found 71 candidate double-barred galaxies in the literature (see references in Moiseev, 2001b ). A new revised catalog of 67 barred galaxies including 50 double-barred ones is presented by Erwin (erwcat (2004)). Although various theoretical studies exist, the secondary bar dynamics is still far from being well understood. Shlosman et al. (shlosman89 (1989)) have shown that an additional circumnuclear bar may be formed as a result of instabilities of the gaseous ring in the Inner Lindblad Resonance (ILR) within a large-scale bar. Heller et al. (heller01 (2001)) present a detailed simulation of this process, which, unfortunately, results in the appearance of an elliptical gaseous ring instead of the “real” stellar-gaseous bar. Maciejewski & Sparke (mac00 (2000)) found some families of closed orbital loops, able to support both bars. Similar independently rotating structures sometimes appear in stellar-gaseous simulations of galactic disks (Pfenninger & Norman, pfenninger (1990); Friedli & Martinet, frimar (1993)). New hydrodynamical simulations of the gas behavior in double bars, with an analysis of the problems arising during modeling and interpretation of the double-barred structures are presented by Maciejewski et al. (mac02 (2002)) and Shlosman & Heller (shlosman02 (2002)).
Various observational data indicate that we are probably seeing a new structural feature of barred galaxies in the case of double bars. However, the majority of observational results has been based on photometric measurements only, when an elongated elliptical structure appears inside the large-scale bar. Moreover, using the isophotal analysis formalism (Wozniak et al., woz (1995)) has allowed even “triple bars” (Friedli et al., fri96 (1996); Jungwiert et al., jung (1997); Erwin & Sparke, erw99 (1999)) without any arguments about the dynamical behavior of such complex stellar systems. At the same time, the structures seen in direct images can be explained in a less exotic manner, without using the hypothesis of double or triple bars. Many structural features would be able to create an illusion of a secondary bar (Friedli et al., fri96 (1996); Moiseev, 2001b ; Petitpas & Wilson, petit (2002)), such as for example, an oblate bulge, a complex distributions of dust and star formation regions in the circumnuclear region, or elliptical rings at the ILRs of a primary bar (Shaw et al., shaw (1993)). Therefore new observational data are required to test our understanding of the secondary bar phenomenon.
Kinematic data (the stellar and gas line-of-sight velocities and velocity dispersion) over the circumnuclear regions of barred galaxies are of crucial importance for this kind of studies. Recently, Emsellem et al. (2001a ) have studied the kinematics of double-barred galaxy candidates and reach a conclusion on dynamical decoupling of the circumnuclear regions in NGC 1097, NGC 1808 and NGC 5728. This conclusion is based on the fact that peaks of the relative line-of-sight velocities and stellar velocity dispersion drops are seen in the circumnuclear regions from long-slit cross-sections. Wozniak (woz99 (2000)) has supposed that “counter-rotation” of stars, observed in the nuclear region of NGC 5728, may be associated with secondary bar influence on stellar kinematics. All these features observed in the one-dimensional data may be explained without using the hypothesis of secondary bars. This may be related to the specific mass distributions in the inner kiloparsec and to non-circular motions of stars and gas within the primary bar only (-families of stellar orbits lead to “counter-rotation” properties). Also Wozniak et al. (woz03 (2003)) in their self-consistent N-body simulations have shown that the velocity dispersion drops observed by Emsellem et al. (2001a ) can be independent on the presence of a secondary bar and are reproduced in the model of a single-barred galaxy.
Since the motions of stars and gas inside the bar region are strongly non-circular, and such objects are non-axisymmetric by definition, panoramic (also named 2D, 3D or integral-field) spectroscopy should give us more detailed information on circumnuclear kinematics in compared to “classical” (long-slit) spectroscopy. Integral-field spectroscopy makes it possible to map two-dimensional fields of line-of-sight velocities and velocity dispersion. Therefore, during 2000-2002 we have carried out a series of observational programs on 2D-kinematics and morphology of double-barred galaxies candidates. The main goal was to find an answer to the question – Are the secondary bars dynamically decoupled systems?
This problem is complicated and ambiguous because of the lack of theoretical studies, where the “observed” velocity fields in the double-barred galaxies had been modeled. It is important to collect a full sample of candidate double-barred galaxies with observable 2D-kinematics of stars and gas. These observations must be used to search for common dynamical (kinematic) features in these kinds of galaxies. Recently, Shlosman, & Heller (shlosman02 (2002)) have written: “..clearly, the most promising method in detecting the nuclear bars is two-dimensional spectroscopy of the central kiloparsec, which can reveal the underlying kinematics”.
Our observational program was finished in 2002. Independently similar observations were started at the 3.6m CFHT using the integral-field spectrographs OASIS and TIGER. Recently, the velocity fields of stars and ionized gas in some double-barred candidates have been presented by Emsellem & Friedli (eric00 (2000)), Emsellem et al. (2001b ) and Emsellem (eric470 (2002)). The velocity fields of the molecular gas were also investigated in double-barred candidates NGC 2273 and NGC 5728 (Petitpas & Wilson, petit (2002)) and NGC 4303 (Schinnerer et al., eva (2002)).
In this work, we present the observational data (integral-field spectroscopy and NIR/optical surface photometry) for 13 galaxies and discuss the problem of central region dynamical decoupling. The paper is structured as follows. In Sect. 2 we describe the observations and data reduction technique. The methods of analysis of the velocity fields and surface brightness distributions are considered in Sect. 3. In Sect. 4 we present the notes for individual observed galaxies and discuss their common properties in Sect. 5; a short conclusion is drawn in Sect. 6.
2 Observations and data reduction
We have compiled our sample from Moiseev (2001b ) by applying the following restrictions: , and the size of the major axis of the probable secondary bar is smaller than or equal to the MPFS field of view (). We have obtained full observational data for 13 galaxies, that is for about one third of the candidates in the Northern sky.
2.1 Integral-field spectroscopy with the MPFS
Circumnuclear regions of all the galaxies were observed at the 6m
telescope of the Special Astrophysical Observatory, Russian
Academy of Sciences (SAO RAS) with the Multipupil Integral Fiber
Spectrograph (MPFS, Afanasiev et al., mpfs (2001)). A description
of the spectrograph is also available through the Internet at
SAO WEB-page http://www.sao.ru/hq/lsfvo/devices.html. The
spectrograph takes simultaneous spectra from 240 spatial elements
(constructed in the form of square lenses) that form an array of
elements on the sky. The field of view is
, and the angular size is /element.
Three galaxies, NGC 2273, NGC 3368, and NGC 3945 were observed in two different positions of the multilens array on the sky, with each frame containing a galactic nucleus. After preliminary data reduction, the “data cubes” were combined. The resulting field of view was for NGC 2273, for NGC 3368 and for NGC 3945. Together with target spectra, we took a night-sky spectrum from an area located 45 from the center of the field of view. The detector was a TK1024 pixels CCD array. The spectrograph reciprocal dispersion was Å/pixel and the spectral resolution was about Å. The log of MPFS observations is given in Table 1. It contains the names of galaxies, dates of the observations, the total exposures , the spectral range and the seeing quality during the exposures.
We reduced the observations by using the software developed at the SAO RAS by V.L. Afanasiev and running in the IDL environment. The primary reduction included bias subtraction, flat-fielding, cosmic-ray hits removal, extraction of individual spectra from the CCD frames, and their wavelength calibration using a spectrum of a He-Ne-Ar lamp. Subsequently, we subtracted the night-sky spectrum from the galaxy spectra. The spectra of spectrophotometric standard stars were used to convert the fluxes into absolute energies.
The reduced spectra were represented as “data cubes”: each spatial element of the two-dimensional field has an individual 1024-channel spectrum. We constructed the maps of line intensity and light-of-sight velocity fields in the Hβ , [O III] Å and/or [N II] Å lines by means of the Gaussian fitting of the emission line profiles. A double-gaussian model was used for doublet separation. The absolute accuracy of the velocity determination, evaluated from the air-glow lines wavelengths, was about . For the continuum map construction we summed the fluxes in the spectral ranges free of emission lines ( Å for “green” and Å for “red” spectra).
The line-of-sight velocity and velocity dispersion fields for the stellar component were constructed by means of a cross-correlation technique, modified for the MPFS data (Moiseev, 2001a ). The used spectral region included some stellar absorption features; MgI Å, FeI Å, FeI+CaI Å, and NaI Å among others. The spectra of G8-K3 giant stars and the twilight sky, observed during the same nights, were obtained as velocity templates. To take into account the variations of the instrumental contour (see Moiseev, 2001a )the observations of the template, the images of stars were out-of-focus to fill the MPFS field of view. The accuracies were of , and respectively for the velocity and velocity dispersion determinations (the errors are dependent on the cross-correlation peak amplitudes).
2.2 Observations with the Fabry-Perot Interferometer
Six galaxies with bright emission lines were observed at the 6m telescope with the scanning Fabry-Perot Interferometer (IFP). The Queensgate interferometer ET-50 was used in 235th interference order (for the Hα line). The free spectral range between neighboring orders (interfringe) was about 28 Å (). For preliminary monochromatization, a set of narrow-band filters, with a Å and centered on the spectral region containing redshifted Hα or [N II] Å emission lines were used. During the observations we successively take 32 interferometric images of an object with different gaps between IFP plates. The spectral channels have a width of Å (), the spectral resolution (the width of instrumental contours) was Å . The detector was a CCD TK1024 ( pixels). The CCD was operated with binning for reading-out time economy. Therefore each spectral channel has a pixel format.
In February and March, 2000, the IFP was installed into the parallel beam, inside the focal reducer (Dodonov et al., dodo (1995); Moiseev, mois00 (2000)). The resulting focal ratio at the prime focus of 6m telescope was , with a field of view of 58 and a scale of .
In September and November 2000, the observations were carried out
with the new multi-mode focal reducer SCORPIO. A brief description
of this device is given on Internet
(http://www.sao.ru/hq/moisav/scorpio/scorpio.html), also
the IFP mode in SCORPIO is described by Moiseev (2002a ).
With this configuration, the focal ratio was , with a field
of view of 48 and a scale of . The log of
the IFP observations is presented in Table 2.
To reduce the interferometric observations we used a custom development software (Moiseev, 2002a ), running in the IDL environment. After primary reduction (bias, flat-fielding etc.), removing the night-sky emission lines and converting to the wavelength scale, the data were presented as “data cubes”. In such a cube, to every pixel of the field, a 32-channel spectrum is attached. The “data cubes” were smoothed by Gaussians with a width, in the spectral domain, of channel, and in the spatial (sky-plane) domain of pixels under the ADHOC package111 ADHOC software was written by J. Boulesteix (Observatoire de Marseille). See http://www-obs.cnrs-mrs.fr/ADHOC/adhoc.html). The velocity fields of the ionized gas, and the images in the emission line were mapped by means of a Gaussian fitting of the emission line profiles. Moreover, we created the images of the galaxies in the “red” continuum near to the emission lines.
| Name | Date | , sec | ,Å | Seeing |
|---|---|---|---|---|
| NGC 470 | 01/09/2000 | 2.8′′ | ||
| NGC 2273 | 01/12/2000 | 2.5′′ | ||
| NGC 2681 | 30/03/2000 | 2.0′′ | ||
| 09/03/2002 | 1.7′′ | |||
| NGC 2950 | 27/03/2000 | 2.0′′ | ||
| NGC 3368 | 27/03/2000 | 2.5′′ | ||
| NGC 3786 | 27/03/2000 | 2.5′′ | ||
| NGC 3945 | 01/12/2000 | 2.5′′ | ||
| 13/05/2002 | 1.5′′ | |||
| 13/05/2002 | 1.5′′ | |||
| NGC 4736 | 11/05/2000 | 1.8′′ | ||
| NGC 5566 | 10/05/2000 | 2.3′′ | ||
| NGC 5850 | 13/08/2001 | 2.7′′ | ||
| 13/05/2002 | 1.2′′ | |||
| NGC 5905 | 30/03/2000 | 2.0′′ | ||
| NGC 6951 | 03/09/2000 | 2.2′′ | ||
| NGC 7743 | 02/09/2000 | 2.0′′ |
| Name | Date | , sec | Line | Seeing |
|---|---|---|---|---|
| NGC 470 | 02/11/2000 | Hα | 2.1′′ | |
| NGC 2273 | 03/11/2000 | Hα | 2.0′′ | |
| NGC 3368 | 28/02/2000 | Hα | 2.7′′ | |
| 28/02/2000 | [N II] | 3.5′′ | ||
| NGC 3945 | 03/11/2000 | [N II] | 2.0′′ | |
| NGC 4736 | 02/03/2000 | Hα | 2.7′′ | |
| 02/03/2000 | [N II] | 3.5′′ | ||
| NGC 6951 | 23/09/2000 | Hα | 2.5 | |
| 23/09/2000 | [N II] | 2.5′′ |
2.3 NIR photometry at 2.1m telescope
The NIR surface photometry of the sample galaxies was carried out with the CAMILA camera (Cruz-Gonzalez et al., camila (1994)) in the JH bands, on the 2.1m telescope of the Observatorio Astronómico Nacional, San Pedro Martir, México. CAMILA is equipped with a NICMOS3 pixels detector. Observations were carried out with two telescope focuses, with different focal ratios. In the mode the field of view was 13 and the pixel size 030. The mode provided a field of view of 36 with a scale of . The log of the NIR observations is given in Table 3.
Each observation consisted of a sequence of object and sky exposures, with the integration time of an individual exposure limited by the background level, which was kept well below the non-linear regime of the control electronics. The nearby sky frames were taken with the same exposure times and at adjacent positions to the object, through an observing sequence that alternates the object and sky frames.
The routines from Image Reduction and Analysis Facility (IRAF) were used in the reduction and analysis of all the data. The image processing involved subtraction of sky frames, division by flat field frames, registration of the images to a common coordinate system and stacking all the images in a filter. Bias subtraction was carried out during the data acquisition. Some of the images had a horizontal band at the joints of the individual quadrants of the NICMOS 3 array detector. We eliminated this feature by subtracting a 2551 pixels median smoothed image from the original images.
| Name | Date | Mode | Filters | Seeing |
|---|---|---|---|---|
| NGC 2273 | 09/03/2001 | J, H, | ||
| NGC 2681 | 09/03/2001 | J, H, | ||
| 18/03/2000 | J, H, | |||
| NGC 2950 | 12/03/2001 | J, H | ||
| 18/03/2000 | J, H, | |||
| NGC 3368 | 12/03/2001 | J, H | ||
| 18/03/2000 | J, H, | |||
| NGC 3786 | 19/03/2000 | J, H | ||
| NGC 3945 | 09/03/2001 | J, H | ||
| 18/03/2000 | J, H, | |||
| NGC 4736 | 20/03/2000 | J, H, | ||
| NGC 5566 | 18/03/2000 | J, H, | ||
| 12/03/2001 | J, H | |||
| NGC 5850 | 18/03/2000 | J, H, | ||
| NGC 5905 | 19/03/2000 | J, H |
2.4 Direct imaging on the 6m telescope
Optical direct imaging observations of some galaxies were carried out with the focal reducer SCORPIO (Sect. 2.2) at the 6m telescope. The detector (CCD TK1024, pixels) provided a field of view of 48 with a pixel scale of 028. The log of the observations is presented in Table 4. We used 3 filters: V (Johnson), (Cousins) and a medium-band red filter (SED755) for the continuum imaging of the objects (without any pollution from the emission lines of the object). The SED755 filter has a width of Å and is centered at Å. The data reduction included bias and flat-field corrections, and cosmic hits removing.
2.5 Hubble Space Telescope data
We also used the high-resolution images of the sample galaxies available from the HST Archive. The HST images were obtained with the optical WFPC2 and the infrared NICMOS cameras. WFPC2 has an image scale of and a field of view of 27 and for the Planetary Camera (PC), with a field of view of . The NICMOS detector includes three chips. Its pixel scale and field of view are 0043 and for NIC1, 0075 and for NIC2, and 02 and for NIC3. The information about the archival images is given in Table 5. Here ID is an archive identification of the observational program.
| Name | Date | Filters | Seeing |
|---|---|---|---|
| NGC 470 | 03/11/2000 | V, , SED755 | 1.4′′ |
| NGC 2273 | 03/11/2000 | V, | 1.0′′ |
| NGC 2681 | 25/10/2000 | V | 1.0′′ |
| NGC 2950 | 04/11/2000 | V, | 1.5′′ |
| NGC 3945 | 03/11/2000 | V, | 1.0′′ |
| NGC 6951 | 04/11/2000 | V, , SED755 | 1.2′′ |
| NGC 7743 | 03/11/2000 | V, , SED755 | 1.5′′ |
| Name | Date | Camera | Filters | ID |
|---|---|---|---|---|
| NGC 2273 | 05/02/1997 | WFPC2 | F791W | 6419 |
| 03/04/1998 | NIC2 | F160W | 7172 | |
| 03/04/1998 | NIC3 | F164N, F166N | 7172 | |
| NGC 2681 | 07/06/1998 | NIC3 | F187N, F160W | 7919 |
| 03/09/2000 | WFPC2 | F300W | 8632 | |
| NGC 2950 | 26/01/1999 | WFPC2 | F450W, F555W, | 6633 |
| F814W | ||||
| NGC 3368 | 04/05/1998 | NIC2 | F160W | 7331 |
| 08/05/1998 | NIC2 | F110W | 7331 | |
| 12/12/2000 | WFPC2 | F814W | 8602 | |
| NGC 3786 | 30/03/1995 | WFPC2 | F606W | 5479 |
| 29/04/1998 | NIC1 | F110W, F160W | 7867 | |
| NGC 3945 | 11/05/1997 | WFPC2 | F450W, F555W | 6633 |
| F814W | ||||
| NGC 4736 | 02/07/2001 | WFPC2 | F814W | 9042 |
| NGC 5566 | 04/04/1999 | WFPC2 | F606W | 6359 |
| NGC 6951 | 30/10/2000 | WFPC2 | F814W | 8602 |
| 18/11/2000 | WFPC2 | F606W | 8597 | |
| NGC 7743 | 30/05/1994 | WFPC2 | F547M | 5419 |
| 11/10/1994 | WFPC2 | F606W | 5479 | |
| 16/09/1997 | NIC2 | F160W | 7330 |
2.6 Long-slit observations of NGC 2681
When all the data were reduced and analysed we concluded that the photometric and MPFS data were not enough for understanding the outer morphology in NGC 2681; first of all, the of the disk was very uncertain (Sect. 4.4). For this goal additional observations of this galaxy were performed in April-May of 2003 at the 6m telescope with the SCORPIO focal reducer in a long-slit mode. The detector was the EEV42-40 pixels CCD array. The spectrograph reciprocal dispersion was Å/pixel, and the spectral resolution was about Å. The slit of was centered onto the nucleus under three fixed orientations near possible minor (PA= and ) and major (PA=) axes. The log of the observations is given in Table 6. Though the seeing was on April 7, this is not important for the study of the kinematics of the outer regions.. The primary reduction included bias subtraction, flat-fielding and cosmic-ray hits removal. Then the individual spectra were sampled along the slit with a bin of at distances from the center and with a bin of at larger distances. The spectrum of a He-Ne-Ar lamp was used for wavelength calibration. The line-of-sight velocity distributions along the slit were constructed by means of a cross-correlation technique. The spectra of the K0III stars observed in the same nights were used as velocity templates. The errors of the velocity measurements are from in the galactic center to at distances of .
| Name | Date | PA | , sec | Seeing |
|---|---|---|---|---|
| NGC 2681 | 07/04/2003 | 30∘ | 2.6′′ | |
| NGC 2681 | 07/04/2003 | 61∘ | 3.5′′ | |
| NGC 2681 | 01/05/2003 | 121∘ | 1.5′′ |
3 Analysis of the velocity fields and photometric data
The isophote analysis of the images was performed with the FITELL program written by V.V. Vlasyuk (SAO RAS) which uses the well-known algorithm of Bender & Möellenhoff (bender (1987)). It yields a surface brightness value () and the orientation parameters of elliptical isophotes: position angle , and ellipticity , where and are the semi-major and semi-minor axis of ellipses respectively.
The velocity fields were analyzed by means of the “tilted-ring” method (Begeman, begeman (1989)), with fixed systemic velocity and position of the center as described by Moiseev & Mustsevoi (mm (2000)). Here we briefly describe the method. The velocity field is broken up into elliptical rings, with a width aligned with the direction of the line of nodes. Using the minimization of the deviations of the observational points from the model, we calculate all 6 parameters characterizing pure circular rotation at a radius in the galactic plane. They are: the coordinates of the rotation center on the sky plane (, ), the systemic velocity , the position angle of the major axis (dynamical position angle), the galactic plane inclination to the line-of-sight , and the mean rotation velocity . However, since all galaxies contain large-scale bars in the inner and spiral arms in the outer regions, the “circular” velocity fields in the observed galaxies must be distorted by non-circular motions. The non-circular motions cause in the systematic errors when determining the disk orientation parameters (see Appendix in Lyakhovich et al., lyakh (1997); Barnes & Sellwood, barsel (2003); Fridman et al., monument (2004)).
In such a situation it is convenient to fix some model parameters. A good first approach is to assume , leaving only two free parameters for fitting in each ring: and . The deviation from the line of nodes of the whole disk () is used to characterize the type of non-circular motions (oval distortion, polar disk, etc.). In the case of the motions of gas clouds in a bar potential, the observable ceases to be aligned with the disk’s line of nodes (Chevalier & Furenlid, chev (1978), Moiseev & Mustsevoi, mm (2000)). A turn of the “dynamical axis” must occur in the opposite direction, with respect to position angle of the inner isophotes, or to the “photometric axis” (Moiseev & Mustsevoi, mm (2000)). The same effects should be also observed in the velocity field of the stars, as is shown by numerical simulations (Miller & Smith, mil (1979); Vauterin & Dejonghe, vd (1997)), and by analytical calculations of the stellar motions under the effects of a triaxial gravitational potential (Monnet et al., monnet (1992)). On the other hand, in the case of a pure circular rotation in a warped (polar, inclined) inner disk, the dynamical axis must follow the photometric one.
In determining the set of optimal galactic disk orientation parameters we were faced with some problems. For the systemic velocity we took its mean value over all radii. As a first approach, for the center position we took the coordinates of the symmetry center of the velocity field. If this “dynamical center” is at a distance less than from the center of the inner isophotes of the continuum image, then the photometric center is accepted as the ultimate position of the center. In NGC 470 (Sect. 4.2), the difference between the positions of the dynamical and photometric centers exceeded the error of their measurement (the case of a lopsided galaxy). For this galaxy we adopted the dynamical center as the center of rotation.
The main problem is to accurately calculate the values of the position angle of the line of nodes () and the inclination (). To use the averaged parameters of the outer isophotes is not always correct for this, because the outer parts of the spiral structure distort these isophotes in galaxies possessing well-developed spiral arms. The choice of radius range for which the average values of and are calculated is also not obvious. In addition, some galaxies (NGC 3368, NGC 3945) have ring-like structures at large distances from the center. If a ring has a resonant origin, then it could be elliptical in the galactic plane (Buta, buta96 (1996)) with uncertain ellipticity for an observer. Finally, the errors in flat-fielding and background-removing procedures (mainly for JH images) also distort the shape of the low-brightness isophotes of the outer regions of galaxies. Therefore, we used the “spiral criterion”, proposed by Fridman et al. (monument (2004)), for and determinations for the main part of our sample. This method is based on applying of a Fourier-series expansion to the surface brightness distribution in the galactic plane , where is the radial distance, and the azimuthal angle:
| (1) |
, and are the amplitude and phase of the -th harmonic, and to is the maximum number of the terms. If a -armed spiral structure appears on the image, then the line of the maximum of the harmonic number should also be spiral. Clearly, in the bar region the line of the maximum of the harmonic must be straight and elongated along the position angle of the bar. It appears that the shape of the spiral, traced by the maximum of the harmonics, is very sensitive to the selection of the orientation parameters. It can be shown that, if for a two-armed galaxy the inclination is underestimated, then the line of the maximum of the harmonic at large radii will be fixed near the direction of the line of nodes.
Similarly, if the adopted differs from the “true” value, then the line of the maximum of the harmonic will be approximate to the direction of the “true” in the outer part of the disk. Our experience shows that for moderate inclinations (), the parameters of disk orientations may be calculated with an uncertainty of a few degrees. A more detailed description of this method is given in Fridman et al. (monument (2004)). In Table 7 we present the and for our sample galaxies. During the search for the orientation parameters we tried to obtain some consistency between all three methods (isophotal analysis, analysis of the IFP velocity fields, and the “spiral criterion”). Nevertheless, preference was given to the “spiral criterion”. The details of the orientation results are considered in the discussion of individual galaxies.
4 The results
4.1 The Atlas
The images and the results of the velocity field analysis are presented in Figs. 1-18. The left panels of Figs. 1-13 show the MPFS data. The top row contains the continuum images, the velocity field of the stars, and the map of the line-of-sight velocity dispersion (). The image in the brightest emission line of the ionized gas, the velocity field of this emission line and the map of the velocity dispersion of the ionized gas () are given in the middle row. For the last map the width of the instrumental contour was taken into account. There are no ionized maps for NGC 2950, NGC 3368, NGC 4736, and NGC 5566, because emission lines are absent in the MPFS spectra of these galaxies. A gray scale is drawn, in , for the velocity fields and for the velocity dispersion maps; while it is in for the continuum and emission line images, except for NGC 5850 in the [N II] emission lines, where the scale is in arbitrary counts. The cross marks the position of the adopted center of rotation in all MPFS maps. At the bottom we show the radial dependences of the rotation velocity and the position angle on the dynamical axis for the stellar and gaseous components. The dotted line marks the adopted position angle of the line of nodes ().
Examples of the images and isophotal analysis results are shown in the right panels of Figs. 1-13. The left column contains the ground-based images with the largest field of view, while the right column contains the same data for the circumnuclear regions , observed with the HST. The best-resolution ground-based images are presented for those galaxies where there are no HST data. The logarithm-scaled images with the corresponding isophotes are presented in the top row of the panels. In the middle row we present the residual brightness distributions, after the removal of elliptical isophotes from the top images. In this case, the gray scale is linear. The thick dotted line shows the maximum of the harmonic for the surface brightness, overlapped onto the ground-based images. At the bottom, we plot the parameters of the isophotes: and ellipticity versus major semi-axis. The scatter of the measurements, through the different filters, gives us some information about the errors of the elliptical model. The horizontal dotted line corresponds to the value, and the vertical dotted line (in the left plot) marks the radial range, which is zoomed in on the right-hand plots.
The results of the IFP observations are shown in Figs. 14-18, which include the continuum and Hα or/and [N II] emission line images. A square-root gray-scale is used. The cross marks the dynamical center. Also shown is the velocity field with isovelocities. The thick black contour corresponds to the systemic velocity, while the thin contours indicate line-of-sight velocities in steps of . The last plot shows the rotation curve and the kinematic position angles ( ). Here the dotted line marks the value. For NGC 3368, NGC 4736, and NGC 6951 we present data in the Hα and [N II] emission lines.
It is necessary to note briefly the errors in the determination. The formal errors of the model usually are because every elliptical ring for fitting contains from several tens up to hundreds of points (the latter for IFP velocity fields). Nevertheless, the rotation curve, determined in the frame of pure circular motions, will be affected by systematic errors on the order of the spread in the observational velocities around the average values at the given radius (Lyakhovich et al., lyakh (1997); Fridman et al., monument (2004)). The error bars of in our figures must be interpreted as the deviation of the line-of-sight velocities from the models of circular rotation in each ring; i.e. the mean value of non-circular velocities. Therefore the “real” circular rotation curve should coincide with our curves within the errors which are given in Figs. 14-18.
In the following subsections we will present the results for individual sample galaxies.
4.2 NGC 470
The adopted orientation parameters, , , have negligible differences from the measurements of Garcia-Gomez & Athanassoula (gar (1991)). However, the parameters from Table 7 allow us to obtain a more smooth well-ordered spiral of the maximum of the harmonic. In the circumnuclear region, of the SED755 isophotes matches the NIR data of Friedli et al. (fri96 (1996)), but it deviates by more than from the measurements in the V and bands. This can be related to the dust extinction, which is more significant in the optical bands. The deviations of from the line of nodes at (from the IFP data, see Fig. 14) are explained by us as an effect of the large-scale (primary) bar on the ionized gas velocities. The turn of occurs in the opposite direction with respect to the inner isophotes (Fig. 1), in agreement with existing models of the gas flowing within the bars (see Sect. 3). Also the MPFS data reveal that the dynamical axis, for the stellar component, turns in the same direction as the gaseous (in Hα ) one at .
The center of rotation (dynamical center) of the MPFS velocity fields of stars and gas is shifted by ( kpc), in the NW direction, from the photometric center. The discrepancy between the positions of both centers is considerably larger than the measurement errors or a possible effect of dust absorption. The difference in the locations of the centers is also observed in the large-scale Hα velocity field, which confirms the result of Emsellem (eric470 (2002)). Such a discrepancy in the photometric and dynamical centers locations or between the centers of the inner and outer isophotes (lopsided-structure) have been seen in numerous galaxies (Richter & Sancisi, lops_obs (1994)). The nature of the lopsidedness could be different at different radial scales, from the circumnuclear disk precessing around a super-massive black hole to development of a spiral azimuthal disturbance mode in the large-scale stellar-gaseous disk (Junquera & Combes, lopside (1996); Emsellem et al., 2001a ; Emsellem, eric470 (2002)).
Turnbull et al. (turn (1997)) have proved that NGC 474 shows signs of interaction with NGC 470. They also noted that both galaxies are perhaps embedded in a common HI-cloud. Hence, the excitation of the non-axisymmetrical harmonics in NGC 470 may be caused by a tidal interaction with the companion.
An alternative explanation can also be proposed for the lopsidedness since the distorted region is relative small and located inside the large-scale bar. It is possible to suppose an abnormal development of the non-axisymmetrical harmonics in the surface brightness during the secular evolution of a barred galaxy. A similar shift between the isophotal center and the dynamical center is observed in the central regions of some barred galaxies (Zasov & Khoperskov, zashop (2002)).
Wozniak et al. (woz (1995)) assumed that the isophotal turn at was connected with a secondary bar. However later Friedli et al. (fri96 (1996)) have explained this feature by a triaxial bulge in the primary bar. This explanation is problematic from our point of view, because the position angle of the inner isophotes (at the ) is close to the disk value. Also the amplitude of isophotal deviations from decreases sharply when passing from short wavelengths (V) to longer ones (SED755). Such behaviour of the isophotes can be explained by dust extinction. Moreover, the apparent ellipticity of the inner isophotes (Fig. 1) corresponds to the projection of a circular disk onto the sky plane (if problems with bulge and outer bar deprojection are taken into account). In Sect. 5.3 we decompose the surface brightness distribution in NGC 470 and justify the assumption. Thus we think that there is a circumnuclear disk within the large-scale bar (see Sect. 5.3 for additional arguments). In the Hα velocity field the turn of occurs in the same direction with respect to the of isophotes at (Fig. 14). Such a dynamical feature is also in agreement with circular motions in the decoupled disk which may be slightly inclined to the galactic plane (Sect. 3). An asymmetrical harmonic is developed in this disk, which also has a large concentration of molecular CO (Sofue et al., co93 (1993)), as well as of ionized hydrogen (see the Hα -image on Fig. 14). The decoupling of the central disk may be caused by its location at the ILR of the large-scale bar.
Vega Beltrań et al., (vega (2001)) gave an estimation of the central velocity dispersion of stars; from their long-slit observations of NGC 470. However, such a low value of is doubtful, as it is difficult to explain the fact that the rotation velocity (from our MPFS data) of stars in the central region is smaller by than the gas velocity. Our measurements support a central velocity dispersion of , which looks more realistic and agrees with estimations of Heraúdeau et al. (hera (2001)). The disagreement with the Vega Beltrań et al. (vega (2001)) results may be due to a template mismatching problem, at was already marked in their article.
In the Hα velocity field, at distances of to the East from the center, we observe a region with line-of-sight non-circular motions about . The profile of the Hα emission line has a complex multicomponent structure. Clearly, two or more systems of gaseous clouds, with different velocities along the line-of-sight, are present in this abnormal region. The non-circular motions apparently are not related to the bar dynamics because they are not symmetric relative to the galaxy center. We suppose an extragalactic gas cloud falling into the galactic disk. Similar shapes of the emission line profiles (at much larger distances from the center) were observed by us in NGC 1084 (Moiseev, mois00 (2000)).
4.3 NGC 2273 (Mrk 620)
Van Driel & Buta (vanbuta (1993)) have described a complex morphology of this galaxy: a large-scale bar of in diameter and two systems of spiral arms ending at distances 11 and 16 from the center. The influence of this large-scale bar appears clearly in the IFP velocity field in the Hα emission line (Fig. 14): the dynamical axis deviates by more than from the line of nodes at radii . The turn of occurs in the opposite direction with respect to the of the isophotes at these distances (Fig. 2), in accordance with a common picture of gas flows in barred galaxies. The residual line-of-sight velocities along the minor axis have amplitudes of more than (after pure circular model subtraction) at radial distances of . The sign of the residual velocities corresponds to the gas inflow motions222We assume that spiral arms are trailing. Thus the NW-side of the galaxy is the nearest to an observer. due to the large-scale bar. The radial variations in the Hβ velocity field (from the MPFS observations) are in agreement with those in the Hα velocity field. Nevertheless, the amplitude of the Hβ rotation curve (at ) is less by than the Hα rotation curve, and almost coincides with the rotation velocity of stars (Fig. 2). Apparently, the relatively weak Hβ emission line is distorted by the broad absorption line from the underlying stellar spectrum.
The [OIII] velocity field is significantly different from the measurements in the Balmer lines. At the [OIII] line-of-sight velocities are constant, therefore the and are uncertain in this region. At larger distances from the center the [OIII] gradient of the line-of-sight velocities is smaller than that of the hydrogen lines. We suggest that the existence of non-circular motions in forbidden lines is caused by the jet propagating outward from the Seyfert 2 nucleus. Ferruit et al. (ferruit (2000)) found a jet-like feature in the HST [OIII]-images and ionized maps (). It is seen, up to to the east from the nucleus and coincides with the extended radiostructure. The spatial geometry of the gas motions around the jet cannot be restored from the MPFS data, most probably these motions are outside the galactic plane.
The stellar velocities do not reveal any non-circular motions in contrast with the gaseous velocities. The elliptical structure, elongated in E-W direction, appears in the stellar velocity dispersion map with a small drop of by in the rotation center (Fig. 2).
Mulchaey et al. (mulch (1997)) have discussed a secondary bar at from their NIR-photometry data. The high-resolution HST images showed that this “bar” breaks up into several elliptical arcs with radii of (see the residual brightness image in Fig. 2). Ferruit et al. (ferruit (2000)) described these features as a “pseudo-ring”, and we suggest that it is a symmetrical spiral twisted into a ring. This conclusion agrees with the opinion of Erwin & Sparke (erw02 (2002), erw03 (2003)). However Petitpas & Wilson (petit (2002)) returned toward a secondary bar assumption in the central kpc of NGC 2273 based on their radio observation. We will discuss the molecular gas properties of the sample galaxies in Sect. 5.7. It will be shown that in the case of NGC 2273 the CO morphology agrees with an assumption of the inner stellar-gaseous disk embedded into the large-scale bar. The disk lies in the galactic plane and possesses a circumnuclear spiral, as is mentioned above.
4.4 NGC 2681
The sharp variations of the isophotal parameters (Fig. 3) reflect the complex morphological structure of the galaxy. Friedli et al. (fri96 (1996)) connected the radial turns of the isophotes with two bars, first proposed by Wozniak et al. (woz (1995)). Erwin & Sparke (erw99 (1999)) offered a model of the circumnuclear structure of NGC 2681, consisting of three independent bars, with position angles of the major axes ), and . The smallest bar-like structure is seen in the HST NICMOS images (Fig. 3).
However, only isophotal analysis results are not enough to prove triple-barred structure because the photometry of the galaxy is a puzzle. We must note two items.
Firstly, this lenticular galaxy has no global spiral arms but its optical color maps (Wozniak et al., woz (1995); Erwin & Sparke, erw99 (1999)) reveal short tightly wound spiral arms and numerous dust lanes in the region of the “middle bar” (). The majority of the dust lanes are located to the south of the nucleus and are extended along the spiral arms. These flocculent mini-spirals also can be seen in our model-subtracted V-band image (Fig. 21) and unsharp masked R-band image by Erwin & Sparke (erw99 (1999)).
Secondly, the disk’s position angle is uncertain from available imaging data. It varies from (Friedli et al., fri96 (1996)) to (Erwin & Sparke,erw99 (1999); erw03 (2003)). The outer V-band isophotes (Fig. 3) have . Also the in the circumnuclear region (Fig. 3) differs from all these values. We tried to use a Fourier expansion method to search for disk orientation parameters and failed completely, because there are no symmetrical spirals in the galaxy.
The long-slit data help to determine the disk orientation. Fig. 19 shows that the line-of-sight velocity gradient is absent along . Hence this is the direction of the minor axis (here we neglect possible non-circular motions in the bars). For more precise analysis we fitted velocities in all cross-sections by a model of pure circular rotation. The following values were found from a -minimization: and . These parameters roughly agreed with the orientation of the outermost isophotes and (Erwin & Sparke, erw03 (2003), they do not quote an uncertainty, but it is probably at least ).
The panoramic spectroscopy data (Fig. 3) show that stars at exhibit a circular rotation where the value of matches the disk’s line of nodes. But at we observe strong changes of the dynamical axis of the stars by . The variations in the velocity field of the ionized gas are smaller, but differ systematically from that of the stars by at . Also the symmetry center of the gas velocity field is shifted by to the east from the continuum center, similarly to NGC 470. In addition, a sharp turn of the isovelocities is seen at (80 pc). So this region is dynamically decoupled concerning both the stars and the gas. At these distances, the value of of the stars is closer to the orientation of the HST inner isophotes (). Such a relation between the “photometric” and “kinematic” axes does not point in the direction of the bar hypothesis, but of disk-like kinematics. Thus an inclined (or polar) stellar-gaseous disk exists in the central few tens parsecs of NGC 2681. This disk is seen on HST-images of the galaxy from UV (WFPC2) to NIR (NICMOS). Erwin & Sparke (erw99 (1999)) accepted this disk as a third (inner) bar on HST-images. Unfortunately, the spatial sampling of the MPFS data is not sufficient for more certain conclusions on kinematics in this region (the seeing was ).
Cappellari et al. (cap (2001)) have proved that NGC 2681 hosts a nuclear starburst of yrs old. They considered a merger process with a small gaseous companion as the most probable trigger of the nuclear star formation. If the companion had a spin direction inclined to the galactic plane, then the remnants of the merged gas will be observed as a central inclined disk, and the non-orthogonal disk will precess toward the galactic plane. However, a polar disk may be stable enough and rather long-living (Arnaboldi & Sparke, polar_t (1994)). From this point of view the central structure of NGC 2681 is similar to that of galaxies with inner polar rings, such as IC 1689 (Hagen-Thorn & Reshetnikov, hagen (1997)) or UGC 5600 (Shalyapina et al., u5600 (2002)). Nevertheless, the polar disk in NGC 2681 is smaller, of about pc in diameter.
The merger hypothesis makes it possible to explain the spiral arms and dust lanes at , which have a shape differing from ordinary dust lanes in large-scale spiral arms. Also these flocculent non-symmetrical spirals differ from the symmetrical two-armed dust spirals which are usually observed near a shock front in barred galaxies. The Hα [NII] ionized gas emission lines is also observed only at (Wozniak et al., woz (1995)). Thus, the stellar-gaseous disk, with spiral arms and perturbed dust layer333We suggest that the spiral in NGC 2681 probably has a dust origin. Indeed, the spiral appears in the optical images and is absent in the J-band residual image (Fig. 3) as well as in NIR color maps (Friedli et al., fri96 (1996)), is nested in the center of the large scale-bar at ( pc). A strong asymmetry in the dust distribution may be associated with a possible warp of the gaseous-dust disk relative to the stellar one. We suggest that all the features mentioned above (inner polar disk, abnormal shape of the spirals, and warp of dust layer) are caused by a recent merging event.
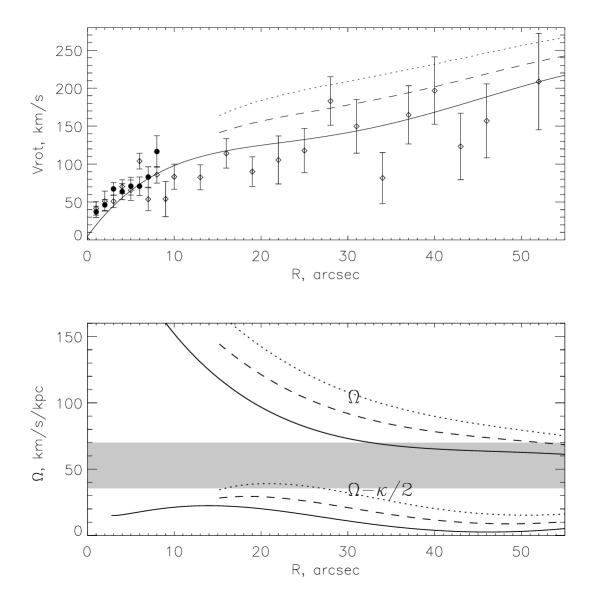
We try to estimate the positions of ILRs in NGC 2681. Figure 20 shows the polynomial approximation of the stellar rotation curve. However, the amplitude of circular velocities must be larger than these streaming velocities because velocity dispersion provides additional support against gravity. For asymmetric drift correction we used Eq. (2) from Aguerri et al. (fast (2003)) and their assumptions (the ratio of azimuthal to radial components of the velocity dispersion , and a decrease of the volume density of the disk that is exponential with radius). The drift correction was calculated for values 0.7 and 1.0, bracketing the possible range for early-type galaxies (Aguerri et al., fast (2003)). The corrected circular velocities and the resonance curves shown in Fig. 20 are truncated at the radius of because the asymmetric drift approximation fails in the bulge-dominated region (see surface brightness profile in Fig. 21). For the calculation the angular velocity of the bar we make the following assumptions: the maximal circular velocity is about ; the bar size is ; the ratio of the radii can be 1 to 1.6 , this is the range observed for bars in lenticular galaxies (Aguerri et al., fast (2003)). The probable range of the large-scale bar angular velocity, , is marked as gray rectangular in Fig. 20. This figure also demonstrates that one or two ILRs could exist near the radius , if the is smaller than the value mention above. This distance coincides with the approximate size of the inner dust/gaseous disk described above. In this case the gas was accumulated by the gravitational forces of the bar. Of course we must remember that the resonance curves are calculated for a symmetric potential without any bar perturbations. But we think that our evaluation of the ILR radius can be used as a zero approximation of the position of the resonances.
In conclusion, we suggest the following interpretation of the global morphology of NGC 2681. The large-scale low-contrast bar dominates in the optical and NIR images at and has the ILRs at . The decoupled gaseous disk is observed inside the resonance region. This inner disk is elliptical (non-circular) because the elongated orbits of stars change their major axis orientation at the resonances (Lindblad, lind (1999)). This elliptical disk was accepted by Erwin & Sparke (erw99 (1999)) as a secondary (“middle”) bar. The recent dwarf companion merging leads to the structure perturbation of the kiloparsec-size disk with inclined (polar) orbits in the central 100 pc.

4.5 NGC 2950
Our value of differs slightly (by ) from the measurements of Friedli et al. (fri96 (1996)). The radial dependences of the isophotal and , in all observed bands, coincide with those of Wozniak et al. (woz (1995)) and Friedli et al. (fri96 (1996)). The large-scale bar ( in size) is seen over the distributions of the Fourier harmonic and has a turn of isophotal accompanied by an ellipticity peak (Fig. 4).
Wozniak et al. (woz (1995)) and Friedli et al. (fri96 (1996)) explained the inner turn, and the peak, at , as a secondary bar. Surprisingly, this “bar” does not distort the circular rotation of stars in the circumnuclear region. The of the stellar velocity field coincides with of the line of nodes.
We do not detect any non-circular motions in this velocity field despite the strong turn of isophotes at these radii. There are sharp elliptical structures decoupled in the stellar velocity dispersion map at (Fig. 4). It is extended along , which is the direction of the major axis of the primary (external) bar.
4.6 NGC 3368 (Messier 96)
Sil’chenko et al. (leo (2003)) analyzed the results of panoramic spectroscopy of this galaxy including our observational data. However, that work is mostly focused on the stellar population properties. We will briefly describe the main properties of the inner kinematics of this galaxy, which is a member of the Leo I group.
Observations with the scanning IFP allow us to map the large-scale velocity fields of the gas in two emission lines (Fig. 15). The Hα emission is mostly concentrated in the starforming ring, at distances of from the center. Unfortunately, the stellar absorption features and the overlapping interference orders distort the emission line profiles in the Hα data-cube, over the whole central region of the galaxy. We cannot resolve this problem because the free spectral range of the IFP is rather small (28Å). In contrast, the [NII] velocity field has been constructed over the full range of radii. The dynamical position angle of the outer gaseous disk, , at , differs strongly from the orientation of the line of nodes of the stellar disk, . The last value was calculated from the Fourier expansion of the NIR images (“spiral criterion”, Sect. 3). So the line of the maximum of the harmonic has a regular spiral shape and fits both spiral arms of the residual brightness distribution (Fig. 5) only for this value of . The isophotes, distorted by these spiral arms, were erroneously interpreted by Jungwiert et al. (jung (1997)) as a large-scale primary bar.
The orientation of the ionized gas disk is in good agreement with the outer part of the neutral hydrogen velocity field (Schneider, hi3368 (1989)) and with CO kinematics at (see Fig. 1 in Sakamoto et al., sakamoto (1999)). Thus, we suggest that the gas (ionized/neutral) and the stars in this galaxy rotate in different planes. All the gas in this galaxy, which is the brightest member of the western half of Leo group, has an external origin, in agreement with Schneider (hi3368 (1989)). See Sil’chenko et al. (leo (2003)) for detailed arguments in favor of this possibility.
Good agreement exists between the measurements of the from two independent IFP velocity fields. Nevertheless, the [NII] rotation velocities are systematically lower, by , than the Hα ones. If the gaseous disk is inclined to the main galaxy plane, then shock-wave fronts can develope at the cross-section of the global stellar and gaseous disks, because the gas strikes the gravitational well. Thus, the low [NII] velocities may be explained if the shock-excited gas, which is slowed down by collisions with the stellar disk and spiral arms (these intensify the contrast of the gravitation potential), emits mostly in the forbidden emission line. The discrepancy between the velocities in the different emission lines is not an artificial instrumental effect. NGC 4736 was also observed, with the same technique, in Hα and [NII] lines during the same observation run. In the NGC 4736 data cubes the velocities in both emission lines are consistent with each other.
There is no large-scale (“primary”) bar in this galaxy, as it was mentioned above. However, a small-scale () nuclear mini-bar is present and extends along . This bar provokes a turn of in the stellar velocity field by , from the line of nodes in the opposite direction with respect to the turn of the inner isophotes (Fig. 5). The central asymmetry of the distribution is confirmed by long-slit spectroscopy of Vega Beltrań et al. (vega (2001)).
The sharp turn of the isophotes, in the HST images inside , may be associated with strong dust lanes. Each of these lanes crosses the images near the nucleus and can be seen both in the optical and NIR images (Fig. 5). In Sil’chenko et al. (leo (2003)) we argue that a gaseous-dust mini-disk is located in the polar plane of the bar. Unfortunately, our MPFS and IFP data have too low angular resolution to study the polar disk kinematics.
4.7 NGC 3786 (Mrk 744)
Our disk orientation parameters for this galaxy are in agreement with the results of Afanasiev & Shapovalova (af_shap81 (1981)). Afanasiev et al. (trans (1998)) from their imaging data found two bars with semi-major axes of and in this Sy 1.8 galaxy. However, our Fourier analysis of the optical and NIR images shows that the line of the maximum of the harmonic, at , is wound into a regular spiral that coincides with the global two-armed spiral pattern of the galactic disk. This spiral also appears in the residual brightness maps (Fig. 6). Thus, the radial variations of of the inner isophotes caused by the spiral arms have led Afanasiev et al. (trans (1998)) to an erroneous conclusion about a large-scale bar in NGC 3786. The situation is the same as in the case of NGC 3368.
The of the velocity field of stars at , differs from the of the line of nodes by more than . The deviations occur in the opposite direction relative to the central isophotes (Fig. 6). This indicates a dynamically decoupled central mini-bar of kpc in diameter. The line of the maximum of the harmonic at has a constant azimuthal angle, a further confirmation of the existence of the mini-bar. The mini-bar was predicted by Afanasiev & Shapovalova (af_shap81 (1981)) from their long-slit data and confirmed photometrically by Afanasiev et al. (trans (1998)).
The ionized-gas velocity fields in the Hβ and [OIII] lines are different. More precisely, the orientations of in velocity field of the stars and gas in Hβ coincide, but the position angle, calculated from the [OIII] velocity field of the gas, deviates from the stellar one. The deviations may be due to the presence of shock fronts at the bar edges, formed in the disk gas under the action of the gravitational well of the bar. The post-shock gas decelerates and emits in forbidden lines (Afanasiev & Shapovalova af_shap81 (1981), af_shap96 (1996)). The rotation velocities in the [OIII] line are smaller than those in the Hβ (Fig. 6). This feature may also be connected to braking shock-excited gas at the bar edges.
The stellar velocity dispersion field has drops by in the center compared with at . This feature will be discussed in Sect. 5.6.
4.8 NGC 3945
The radial variations of the isophotal parameters over all observed bands are in accordance with early observations of Friedli et al. (fri96 (1996)) and Erwin & Sparke (erw99 (1999)). The global spiral pattern is absent in this galaxy. The parameters of the disk orientation were calculated under the assumption of a circular shape of the outer low-brightness ring (). The values of and agree (within the errors given in Table 7) with the results of Erwin & Sparke (erw99 (1999)) and Erwin et al. (erwet03 (2003)).
A large-scale bar extends along the galactic minor axis. Erwin & Sparke (erw99 (1999)) accepted that the circumnuclear disk nests in the bar, because the isophotal matches at . They also favored the existence of a secondary small bar embedded in the disk, and found a low-contrast ring at as well. This ring is seen in our residual HST-images (Fig. 7). The origin of this ring is discussed by Erwin et al. (erw01 (2001)).
The velocity field of the stars in the circumnuclear disk shows a regular circular rotation ( coincides with the ). That the kinematics is disk-like agrees with the conclusion by Erwin et al. (erwet03 (2003)) that the inner disk is more luminous (and massive) than the bulge in this region. Also we find no any non-circular motions of the stars due to a possible secondary bar at suggested by Erwin & Sparke (erw99 (1999)). The rotation curve agrees with early measurements of Bertola et al. (bertola95 (1995)). A small difference in the amplitude of the rotation curves, observed in 2000 and 2002, is probably due to a velocity gradient, smoothed by beaming effects, in observations with a worse seeing in 2000 (Table 1).
The velocity field of the ionized gas is puzzle. Bertola et al. (bertola95 (1995)) found [OII]Å line emission only in the very central region () and showed that the gas co-rotates with the stars. Nevertheless, our MPFS data contradict their conclusions. First of all, we confidently detect the [NII] line emission up to a distance of from the center. Secondly, inside the radius of (about kpc), the line-of-sight velocities of the gas are inverted with respect to the stellar velocities. Thus, a counter-rotating gaseous disk is located at .
The direction of gas rotation becomes coterminous with the stellar rotation at larger distances from the nucleus (see Fig. 7). The large-scale IFP velocity field (Fig. 16) confirms the fact of normal gas rotation at large radii, up to ( kpc). The variations of at in the IFP velocity field are not real. This artifacts are caused by spectral overlapping of the strong stellar Hα absorption and low-contrast [NII] emission lines in the central region. The small spectral range of the IFP observations does not allow us to separate absorption and emission lines. In contrast, at the stellar continuum has a low contrast, while the [NII] lines are bright since they are emitted by some HII-regions in two spirals twisted into the outer ring.
4.9 NGC 4736 (Messier 94)
The outermost isophotes of our NIR images are limited to , and we cannot calculate the parameters of the outer disk orientation from these images. The application of the “tilted-ring” model to the [NII] velocity field at makes it possible to obtain the value. The disk inclination is small and uncertain from velocity field analysis. Mulder (mulder (1995)) found from the outer optical isophotes. We accept this value throughout our paper.
The stellar velocity field shows a regular circular rotation with (Fig. 8). These values differ slightly from the accepted , but fall inside the errors (Table 7). From long-slit observations, Mulder (mulder (1995)) obtained for the stellar component in the galactic disk as a whole. This value differs certainly from our measurements at .
Our Hα velocity field is similar to the data of Mulder (mulder (1995)), but it has no measurements inside . Here the broad Hα absorption line distorts the emission line profile. The absorption does not affect the [NII] emission. The [NII] velocity field reveals non-circular ionized gas motions, as is shown from the fact that turns at . The non-circular motions are most likely connected with bar-like structure at , detected from isophotal parameters variations: a turn of and a peak (Fig. 8). This conclusion confirms the result by Wong & Blitz (wong (2000)) who suggest that molecular gas kinematics is consistent with radial flows in the central stellar bar ( in diameter).
Shaw et al. (shaw (1993)) also considered a twist of NIR isophotes at , which may be explained as a secondary bar effect. We must notice that the most highest-contrast part of the circumnuclear mini-spiral is located at these radii and distorts the shape of the isophotes in the HST images. This spiral structure is studied in recent work by Elmegreen et al. (elmegreen (2002)).
The dust lanes in the spiral appear in the HST image up to . Thus, the deviations of of the ionized gas velocity field from at these radii can be explained by non-circular gas motions in the mini-spirals instead of motions inside a large-scale bar as was mentioned above.
4.10 NGC 5566
The disk inclination is considerably smaller than the value of measured by Jungwiert et al. (jung (1997)). We found by means of the “spiral criterion”. This value is in good accordance with the outer isophote ellipticity (Fig. 9) and with Kent’s (kent (1984)) CCD-observations. The large-scale bar of in size is elongated at . Two strong spiral arms start from the bar ends. The velocity field of stars lacks significant non-circular motions as coincides with within the errors. The stellar rotation velocity at reaches , which corresponds to the HI rotation curve of Helou et al. (helou (1987)).
Jungwiert et al. (jung (1997)) explained the isophotal ellipticity peak and the turn at as secondary bar features. We disagree with this interpretation for the following reasons. First of all, the position angles of the “secondary bar” and the line of nodes are very similar. Secondly, two symmetrically twisted spiral arms appear in the JH residual images. This distribution of the underlying stellar component is not characteristic for a bar (Fig. 9). And finally, a grand-design two-armed nuclear spiral is seen also in the HST residual image (Fig. 9) at these radii.
We must note that a slowly rotating mini-bar can produce a spiral-like response in the disk outside the ends of the bar, where an ILR must be located, as has been shown in the numerical simulations by Combes & Gerin (comb (1995)) and in the analytic estimations by Fridman & Khoruzhii (fridman (2000)). But in the case of NGC 5566 the mini-spiral develops inside the radius, where a possible nuclear mini-bar is proposed by Jungwiert et al. (jung (1997)). Secondly, we find no non-circular motions produced by a possible nuclear bar in the stellar velocity field, because agrees with the disk (see above). And thirdly, a possible bar-like structure is not visible in the residual brightnesses deprojected to the galactic plane (see Fig. 21).
For all these reasons we suggest that the mini-spiral is not connected with a possible secondary bar. Therefore, NGC 5566 is an ordinary barred galaxy. It has a circumnuclear disk (, or pc in linear radius) with a mini-spiral nesting inside this bar. The properties of the inner isophotes (, ) indicate that this kiloparsec-size inner disk lies in the galactic plane. The mini-spiral is traced by dust lanes but the majority part of the dust clouds is concentrated outside the spiral arms in the NW half of HST PC2 image.
4.11 NGC 5850
Since our NIR images have a field of view that is not large enough to cover the entire galaxy, we used the R-band image, from the digitized atlas of Frei et al. (frei (1996)) to determine the orientation parameters. The spiral arms are low-contrast outside the ring around a large-scale bar (). Higdon et al. (higdon (1998)) have shown that the outer spirals have a mixed (2- and 3-armed) structure. However, the orientation parameters, determined by means of the “spiral criterion”, from the harmonic are in good agreement with preliminary data of Friedli et al. (fri96 (1996)), and with the kinematics of neutral hydrogen if the possible warp of the HI-disk is taking into account (Higdon et al., higdon (1998)). Since the inner isophotes have a sharp turn at , Friedli et al. (fri96 (1996)) have assumed the existence of a secondary bar in this galaxy.
The MPFS data show that of the stellar rotation coincides with , while in the ionized gas , in the circumnuclear region, differs by more than from the line of nodes position angle (Fig. 10). Note that the ionized gas almost aligns with the of the inner isophotes. This radial behavior of is typical for a disk inclined to the galactic plane. Nevertheless, if we assume that the gas motions are produced in the galactic plane, they would correspond to a radial outflow from the nucleus444Here, we use Higdon’s et al. (higdon (1998)) suggestion about the galaxy disk orientation, namely that its western half is closest to the observer. with velocities of , without assuming any circular rotation. Such outflows are typical of Seyfert galaxies, nevertheless, no AGN or starburst-like features are observed in the optical spectrum of the galaxy nucleus (see discussion in Higdon et al., higdon (1998)). A more reasonable assumption is that the gas, at , rotates in a polar plane with respect to the global galactic disk. In this case, the polar gaseous disk lies roughly in the smallest principal-plane cross-section of the outer bar, orthogonal to the major axis of the bar, as in NGC 3368 (Sect. 4.6). The hypothesis of a polar disk is supported by the fact that NGC 5850 has undergone a recent collision with the nearby galaxy NGC 5846 (Higdon et al. 1998). Through their interaction, part of the gas could be transported to polar orbits. What is the inclination of this disk to the line-of-sight? It is easy to show that the angle between the inner disk plane and the outer galactic disk, , satisfies the following relation:
| (2) |
where is the angle between the line-of-sight and the plane perpendicular to the disk, and is the position angle of the major axis of the disk. By substituting , (Table 7), and into this expression, we predict that the disk will be polar () for . The gas rotation curve in Fig. 10 was calculated for .
At , the gas rotation velocities may be lower than the stellar ones, but both velocities are consistent within the errors. An extrapolation of the HI rotation curve (Higdon et al., higdon (1998)) to the inner radii gives at , in good agreement with our ionized gas measurements.
4.12 NGC 5905
Unfortunately, we have not obtained the image of the outer isophotes, extended beyond a large-scale bar at (the bar size is taken from Friedli et al., fri96 (1996)). Therefore, we accepted , which was derived by van Moorsel (van (1982)) from the HI kinematics analysis. Also we calculated from inspection of the HI isovelocities map (Fig. 8 in van Moorsel, van (1982)). The last value agrees perfectly with the results of deep CCD-photometry by Kent (kent (1984)).
The Hβ velocity fields of stars and ionized gas exhibit deviating from at , in the opposite direction with respect to the s of the inner isophotes. Hence they should be caused by non-circular motions in the large-scale bar. The observed slower [OIII] ionized gas rotation compared with the Hβ value and the difference of the values in these lines are most likely connected with shock fronts in the bar edges, as in the case of NGC 3786 (Sect. 4.7).
Friedli et al. (fri96 (1996)) showed that the turn of the inner isophotes, at , is caused by a secondary bar. Nevertheless, they used an obviously wrong value of . Note that a relatively small value of the ellipticity of the inner isophotes, and the coincidence of the isophotal with does not allow us to explain the central structure with a secondary bar. Most probably, the twist of the central isophotes at is caused by the transition of the surface brightness distribution character from a bar-dominated to a central prolate bulge or circumnuclear disk. This situation is similar to that of NGC 5566 (Sect. 4.10), but without introducing the mini-spirals.
4.13 NGC 6951
The orientation parameters from Table 7 agree with Pérez’s et al. (perez (2000)) results. The ionized gas velocities, measured by them in three different positions of the slit, coincide completely with our velocity fields. However, we did not detect the two kinematic components in stellar rotation, perhaps because of the low MPFS spectral resolution, relative to that of Pérez et al. (perez (2000)) long-slit data. In the star velocity field, the differs, by , from the (Fig. 12). The turn of the dynamical axis is not very significant. This fact is connected with non-circular motions in the external bar, because the bar isophotes deviate in the opposite direction relative to .
At large distances from the center, the IFP Hα and [NII] velocity fields are similar (Fig. 18). Nevertheless, the [NII] rotation velocities are lower than those of the Hα inside the circumnuclear starforming ring at , while the IFP Hα and [NII] and the MPFS Hβ variations are the same. In contrast, the MPFS [OIII] velocity field exhibits more significant non-circular ionized gas motions. The dynamical axis, found from this line measurements, turns by at , and the rotation velocity is lower than the Hβ velocities by a factor of 2. The intensity of the [OIII] emission decreases sharply outside this region. It is possible that radial motions of highly excited ionized gas, with a speed of the same order of the rotation velocities, occur here. Radial motions are connected with the outflow from an active nucleus, which is of a transition type between a LINER and a Sy 2 (Pérez et al., perez (2000)). Moreover, the non-thermal radio continuum image shows a jet-like feature, extended from the nucleus up to 80 pc (Saikia et al., saikia (2002)). Unfortunately, the MPFS data cannot resolve this asymmetric structure.
There is a circumnuclear ring at , nested in the large-scale bar, which has a . The turn of isophotes, in the ground-based optical images, inside was explained by Wozniak et al. (woz (1995)) with a possible secondary bar. However, Friedli et al. (fri96 (1996)), based on NIR-photometry, have assumed that the isophote distortion is caused by a complex distribution of dust and star-forming regions inside the central kiloparsec. The HST image resolved this ring into individual starforming knots. The ring seems to be elliptical, but it is almost circular after deprojection onto the galactic plane ( and of the central isophotes correspond to the outer disk orientation). Indeed, the HST high-resolution images confirm the lack of a secondary bar as an elongated stellar structure (Fig. 12).
The HST residual brightness maps reveal a multi-armed flocculent spiral (Fig. 12), described in detail by Pérez et al. (perez (2000)). The mini-spiral is probably associated only with the distribution of gas and dust rather than with the stellar component. As has been shown by Pérez et al. (perez (2000)), the nuclear spiral structure, clearly seen in the V band, completely disappears in the H band, where the effect of dust absorption is much weaker.
Figs. 12 and 18 reveal that the position angle of the dynamical axis, calculated from the Hα , Hβ , and [NII] velocity fields, at deviates by from the . This proves the significant role of non-circular motions in the disk kinematics. Since there is no inner bar in this region, we can offer the following interpretation of the observed picture. A gaseous dusty disk of ( pc) in radius is embedded into the large-scale bar. In this disk, a multiarmed spiral structure has developed and perturbs the circumnuclear gas rotation. The dynamical decoupling of this disk is also confirmed by a high central molecular-gas density (Kohno et al., koh (1999)), and by the location of two ILRs of the large-scale bar (Pérez et al., perez (2000)).
Based on their IFP observations, Rozas et al. (rozas (2002)) presented similar arguments to explain the kinematic decoupling of the inner ionized-gas disk in NGC 6951. However, they tried to interpret the gas non-circular motions in terms of an inclined disk or a dissipation of the secondary bar. In a forthcoming paper we are going to consider a detailed kinematics and circumnuclear structure of this galaxy, based on new 2D-spectroscopy data, with sub-arcsecond angular resolution (Moiseev, private communication).
4.14 NGC 7743
A regular two-armed spiral is seen in the ground-based images, most clearly in residual images (Fig. 13). The turn of the isophotes, inside , was explained by Wozniak et al. (woz (1995)) as the combined influence of a bar and a triaxial bulge, with the bulge dominating at . Our analysis of residual images and the behavior of the Fourier harmonic show that the bar has a smaller size, and that the spiral structure distorts the elliptical isophotes at . The sharp isophote twist, at , can be seen as well in ground-based as in HST images (see Fig. 13). The WFPC2 residual optical images reveal a complex multi-armed spiral (Fig. 13).
This spiral completely disappears in the near-infrared NICMOS images. Apparently, this spiral has a dust origin (like the gaseous-dusty spiral in NGC 6951). Unfortunately, our MPFS ionized-gas velocity field, in the mini-spiral region, is uncertain. The [OIII] emission line is weak and noisy. We can only conclude that at the gas follows the stellar rotation. A region with non-circular motions is located at large distances, South from the center .
The velocity field of the stars shows a regular rotation with almost constant , while the mean value differs, by , from . The deviation goes in the same direction as the turn of the inner isophotes. Moreover, the coincides with the orientation of the inner NICMOS isophotes. This is normal for an inclined rotating nuclear disk. Nevertheless, on the our ground-based and HST images this region () is not distinguish, except by the mini-spiral at . It is possible that the accepted value of is not correct. Additional observations of this galaxy focused on the large-scale gas and stellar kinematics are needed.
5 Discussion
5.1 Circumnuclear morphology of the candidate double-barred galaxies
In Table 8 we collect all structural and kinematic features which have been found in the observed galaxies. The table contains galactic name, type (according to the RC3 catalogue), accepted distance from the HyperLeda database (), bar major-axis length and position angle555 The values of and were estimated from our isophotal analysis using same method as in Wozniak et al.(woz (1995)). Erwin (erwcat (2004)) has provided new definitions for bar semi-major axis measurement. and brief description of the structures at different radial scales. The properties for a single bar are given in each case because we could not confirm kinematically secondary bars in any galaxy. Usually the bars described were denoted as “primary” in the references. However in NGC 3368 and NGC 3786 only nuclear dynamically decoupled bars are present (denoted as “secondary” in the references), and “large-scale primary bars” are, in fact, a consequence of isophotes distorted by spiral arms (Sect. 4.6 and 4.6).
We have detected various types of deviations of the stellar and gaseous motions from the normal regular rotation in the circumnuclear regions of the galaxies observed. These types are separated below.
| Name | Type | D1 | Bar | Circumnuclear structure | |||
|---|---|---|---|---|---|---|---|
| (RC3) | Mpc | a,′′ | PA,∘ | r, ′′ | r, kpc | type of the feature | |
| NGC 470 | SAb | 32.6 | 30 | 20 | lopsided nuclear disk | ||
| gas radial motions in the bar | |||||||
| NGC 2273 | SBa | 25.7 | 25 | 108 | jet outflow in [OIII] line | ||
| nuclear disk with mini-spirals | |||||||
| gas radial motions in the bar | |||||||
| NGC 2681 | SAB0/a | 9.6 | 60 | 30 | stellar/gaseous polar (inclined) disk | ||
| decoupled disk with dusty mini-spiral | |||||||
| NGC 2950 | SB0 | 18.9 | 40 | 155 | – | – | – |
| NGC 3368 | SABab | 10.6 | 5 | 125 | 0.1 | gaseous polar disk | |
| stellar radial motions in the mini-bar | |||||||
| global gaseous disk inclined to the stellar one | |||||||
| NGC 3786 | SABa | 36.1 | 6 | 70 | gas/stellar radial motions in the mini-bar | ||
| NGC 3945 | SB0 | 17.7 | 40 | 72 | counter-rotating gaseous disk | ||
| NGC 4736 | SAab | 4.8 | 18 | 20 | mini-spiral structure with non-circular gas motions | ||
| NGC 5566 | SBab | 19.9 | 20 | 155 | nuclear disk with mini-spiral | ||
| NGC 5850 | SBb | 34.2 | 80 | 115 | polar gaseous disk | ||
| NGC 5905 | SBb | 47.2 | 200 | nuclear disk; gas/stellar radial motions in the bar | |||
| NGC 6951 | SABbc | 21.9 | 80 | 90 | jet outflow in [OIII] line | ||
| stellar radial motions in the bar | |||||||
| nuclear disk with mini-spiral and non-circular gas motions | |||||||
| gas radial motions in the bar | |||||||
| NGC 7743 | SB0 | 24.4 | 30? | 95 | mini-spiral structure | ||
| warped (inclined) disk? Need more information | |||||||
5.2 Non-circular motions in bars
The calculated over the ionized gas velocity fields disagrees with the of the lines of nodes in all galaxies where emission lines have been detected. In Sect. 4 we have shown that the central turns of ionized-gas occur in opposition to the “primary bar” isophotes independent of the orientation of the secondary bar-like structure (excluding galaxies with inner polar and counter-rotated gaseous disks, Sect. 5.4 and 5.5). We explain such behaviour of the “dynamical axes” as non-circular gas motions (radial flows) in a large-scale bar (or nuclear mini-bars in the case of NGC 3368 and NGC 3786) in agreement with models described in Sect. 3. In the stellar velocity fields the amplitudes of deviations are usually less than those of the gas; in half of the sample is close to the value. In NGC 3368, NGC 3786, NGC 5905, and NGC 6951 significant (by ) deviations are detected. Again comparing these with the isophotal they are typical signatures of non-circular motions of the stars in a single-barred galaxy, or of radial motions due to elongated stellar orbits, including the case of twisted orbits.
NGC 2950 is an interesting case, where the inner isophotes are turned by more than (Fig. 4), but the for the stellar component is aligned with the line of nodes. Neither the outer bar nor the inner bar-like structure have an appreciable effect on the stellar velocity field. It is possible that both disk stellar motions within the bar and the rotation of the bulge, whose contribution in this SB0 galaxy must be significant, are observed along the line-of-sight. Since the spectral resolution was too low to separate two dynamical components within the line-of-sight velocity distribution (LOSVD), the mean velocity field corresponds to circular rotation. The stellar component associated with the outer bar in NGC 2950 affects the velocity dispersion distribution, whose increase (elliptical peak of ) implies a broadening of the LOSVD in the bar region (Sect. 5.6).
5.3 Embedded disks?
In a significant fraction of the galaxies inner disks nested in the central regions of the large-scale bars are found from kinematical and morphological analysis (in NGC 470, NGC 2273, NGC 2681, NGC 5566, NGC 5905, and NGC 6951)666Here we do not mention NGC 3945 which has a massive inner disk embedded in the bar, discussed by Erwin et al. (erwet03 (2003)). In his last paper based on photometric data Erwin (erwcat (2004)) also argued an inner disk origin for the isophotal twists in NGC 470 and NGC 2273.. Below we summarize the signatures indicating this inner-disk structure:
-
•
Photometry: an orientation of the inner isophotes agrees with the of the line of nodes of an outer disk.
-
•
Kinematics: the central of the stellar velocity field lies near the .
-
•
Morphology: There are inner mini-spirals at distances corresponding to the nuclear disk ( kpc) in NGC 2273, NGC 2681 NGC 5566, and NGC 6951. The origin of the mini-spirals is not understood yet; various models are proposed (for review see Elmegreen et al., elmegreen (2002); Englmaier & Shlosman, engl (2000)). Nevertheless, a “spiral” is some disk instability developed in the relatively thin and flat layer. The mini-spirals also appear in the images of NGC 4736 and NGC 7743, though we cannot determine inner disks in these galaxies.
-
•
Resonances: In the case of NGC 2681 and NGC 6951 we have shown that an inner disk region is kinematically decoupled because it lies inside the ILR of a global bar.
To confirm the inner disk hypothesis we tried to extract their brightness distribution in the galactic plane. For this goal we subtracted a large-scale model of galaxy as a whole from the available images. A two-dimensional model of the surface brightness distribution is needed, because barred galaxies are actually non-axisymmetric. Our model included a disk with central brightness and exponential scale , Sérsic (sers (1968)) bulge and global bar. A two-dimensional surface distribution of the bulge brightness is characterized by three parameters: effective brightness , radius , and apparent ellipticity (see Eq. (1) in Moriondo et al., mor (1998)). For a bar surface brightness distribution we adopted Ferrer’s ellipsoidal distribution (Binney & Tremaine, bin (1987)) projected onto the sky plane as:
| (3) |
(the bar is aligned with the x-axis). Here and are the semi-axes of the bar, is an integer parameter, (or when given in magnitudes) is the central brightness. Also the position angle of the bar must be added for an arbitrary coordinate axes orientation.
The model was calculated through the iterative technique by means of the IDL-based software GIDRA (Moiseev, gidra (1998)). As a first step we average the original image data in the ellipses with and and calculate a first approximation of the and in the disk-dominated region from the brightness profile obtained. The 2D model of the exponential disk is subtracted from the original image. The bar-dominated region of the residual images then is interactively fitted for the determination of the parameters of the bar. After removal of the 2D model of the bar we accept the ellipticity of the isophotes as a first approximation for the bulge ellipticity and construct the averaged profile again. This profile is fitted by Seŕsic’s law. Then the cycle is repeated to refine the model. Usually 2-3 iterations are enough for a realistic model. The model-subtracted images and the accepted parameters of the models are shown in Fig. 21. We note that the profiles in the right plots of Fig. 21 are calculated by averaging all component images, these are not a “classical” one-dimensional fitting! Also we have deprojected the residual images to the galactic plane (Fig. 21, middle column). The nuclear over-subtraction for NGC 470 relates to the atmospheric seeing limitation. The deprojected images reveal positive brightness residuals as true circular structures around the nucleus of NGC 470 and spiral structures in the inner round disks in NGC 2273 and NGC 5566. The case of NGC 2681 is more complex, the residual disk is elliptical in the galactic plane, which can be connected with a turn of orbits inside the ILRs. Unfortunately there is no 2D kinematic information for , new observational data are needed for a more definite conclusion about this galaxy.
The main conclusion is that the residual brightness distribution shows a disk-like morphology (including ring-like one in NGC 470). Note that our decomposition has a preliminary character. More complex 2D models combining images in different bands (optical, NIR) and with different resolutions (HST plus ground-based) is required for a detailed inspection of the inner disks in barred galaxies. But such modelling is beyond the scope of our paper.
5.4 Polar (inclined) disks
The kinematic data provide evidence for inner polar disks in NGC 2681 and NGC 5850. Significant deviations (by more than ) of the from the line of nodes occurring in the same direction as the of the inner isophotes are used as the main argument for this conclusion. Also a similar disk in NGC 3368 is detected on the basis of the HST morphology (the dust lane corresponds to the edge of the disk etc., see Sect. 4.6 and Sil’chenko et al., leo (2003)) because the angular resolution of our 2D spectrographs fails at these spatial scales. What is the origin of these disks? We see two possibilities.
Firstly, the disks could be formed by an accretion of external matter with specific orientation of the angular moment, as in “classical” large-scale stable polar rings (see, for example, Arnaboldi & Sparke, polar_t (1994)). Indeed, NGC 2681 demonstrates some spectral (widely distributed starburst) and structural (disturbed dust lanes in the central disk) features, which have been ascribed to the merging of external gas (see Cappellari et al., cap (2001) and Sect. 4.4). It is possible that in NGC 3368 all ionized/neutral/molecular gas collected in the global warped disk has an external origin (Sect. 4.6 and Sil’chenko et al., leo (2003)), which is is implied by the large-scale distribution of the neutral gas in the Leo I group (Schneider, hi3368 (1989)). Also the morphology of the neutral gas in NGC 5850 suggests a high-speed encounter with the nearby NGC 5846 (see Sect. 4.11 and Higdon et al., higdon (1998)).
For the second point of view, we must note that the polar nuclear disks in NGC 3368 and NGC 5850 are orthogonal to the major axes of the bars. In recent years, such polar mini-disks associated with a large-scale bar or a triaxial bulge have been detected in the circumnuclear regions of several isolated galaxies, for example in NGC 2841 (Afanasiev & Sil’chenko, afanasil (1999)) or NGC 4548 (Sil’chenko, sil_polar (2002)). It is possible that the gas in the centers of these galaxies has been moved into polar orbits due to the effect of the bar as is suggested in a qualitative model by Sofue & Wakamatsu (cof94 (1994)). Unfortunately, detailed numerical simulations of this process and a check of its stability are absent.
It is possible that both mechanisms (internal as well as external ones) are at work in the described galaxies. For a detailed discussion on polar disks with sizes of a few hundred parsecs see Sil’chenko (sil_polar (2002)) and Corsini et al. (2003a ). In the last paper a list of 15 galaxies with nuclear polar disks has been collected and their properties were investigated. New observations and numerical simulations are needed to understand completely these galactic structures. We hope that increasing amounts of observational information about inner polar disks will stimulate new theoretical work in this field.
5.5 A counter-rotation
We have found that the ionized gas in the central kiloparsec of NGC 3945 rotates in the opposite direction with respect to the stellar disk. According to Kuijken et al. (kui (1996)), the gaseous disks in lenticular galaxies demonstrate a counter-rotation phenomenon in of all cases. Therefore, this is a frequent kinematic feature in early-type galaxies. This is probably attributable to a merger of an accreted gaseous cloud with the corresponding direction of angular momentum (Bertola et al., bertola92 (1992)). Against this background, counter-rotation of the gas in the center of NGC 3945, one of four S0 galaxies in our sample (see Table 8) and one of three with gaseous disks (NGC 2681, NGC 3945, and NGC 7743), comes as no surprise.
5.6 Stellar velocity dispersion appearance
Simple models of single-barred galaxies have shown (Miller & Smith, mil (1979); Vauterin & Dejonghe, vd (1997)) that the central ellipsoidal peak in the distribution of must be aligned with the orientation of the outer bar. In our sample the ellipsoidal peaks of the distributions are found in six galaxies (NGC 470, NGC 2273, NGC 2681, NGC 2950, NGC 3945, NGC 5905). As has been shown in our previous papers (Moiseev et at., mexic (2002); Moiseev, 2002b ), over our sample the position angle of the peaks reveals a strong correlation with the of the major axis of the large-scale bar (see Fig. 4 in Moiseev, 2002b ). But there is no any correlation between the symmetry axis of the velocity dispersion and the inner isophotal orientation. So in these objects the large-scale bars determine the dynamics of the stellar component even in the regions where the photometric “inner bars” are observed.
In NGC 3786 a central drop of the stellar velocity dispersion is found (Sect. 4.7). Recently, Emsellem et al. (2001a ) and Márquez et al. (drop (2003)) have observed similar drops in the radial distributions in the central parts of some barred galaxies with AGN. These drops can probably be attributed to the “cold” (from the dynamical point of view) stellar disk embedded into the bar. Indeed, the recent self-consistent N-body simulations by Wozniak et al. (woz03 (2003)) show that “young stars born in the nuclear regions from dynamically cold gas have a lower velocity dispersion than the older stellar populations”. Such a drop was also previously observed in NGC 6951 (Pérez et al., perez (2000); Márquez et al., drop (2003)) up to distances of from the center (Fig. 5 in Márquez et al., drop (2003)). Unfortunately, our map for this galaxy has a smaller size (Fig. 12), so we could not detect this interesting feature of the stellar kinematics.
5.7 Molecular gas morphology
Recently Petitpas & Wilson (petit (2002), petit03 (2003)) proposed a new method for resolving the origin of the secondary bar. They compared turns of NIR isophotes with molecular gas (CO) distributions. Namely, if NIR and CO images have similar features, this may suggest that the isophote twists are related to structures hosted by disks and not to triaxial bulges. In our sample, we have found detailed CO-maps for NGC 470 (Jogee et al., jog (2001)), NGC 2681 (Jogee et al., jog (2001)), NGC 2273 (Petitpas & Wilson, petit (2002)), NGC 3368 (Sakamoto et al., sakamoto (1999)), NGC 4736 (Wong & Blitz, wong (2000)), and NGC 6951 (Kohno koh (1999)). In five galaxies (except NGC 3368) the orientation of the CO-distribution coincides with the isophotes of our NIR (or optical) images. We think that the physical reasons for this effect can be different:
-
•
In NGC 470, NGC 2273, and NGC 6951 the iso-contours of the inner CO distribution match the and of the outer isophotes. We suggest that molecular gas is distributed in the nuclear disks discussed above (Sect. 5.3), as the radial scale of the CO concentration and the photometric disks are the same. Two gaseous clumps, symmetric with respect to the center found by Petitpas & Wilson (petit (2002)) in NGC 2273, can be connected with bright segments of the inner mini-spiral (Fig. 21), or may correspond to the stellar and gas orbit crowding near the ILR of the primary bar (see Petitpas & Wilson, petit (2002)). Moreover, in the center of NGC 6951 the molecular gas distributed in the pseudo-ring agrees with the star-forming ring visible in optical images (Sect. 4.13). But in contrast with the optical bands, the CO emission is dominated by a “twin peaks” morphology, which is also interpreted by Kohno (koh (1999)) as “ orbit-crowding regions”. Therefore, the distribution of the molecular gas in the discussed galaxies can differ from purely disk-like, because these disks nest in the non-axisymmetric potential of a large-scale bar. Nevertheless, the CO emission is concentrated on the same scales as the photometric nuclear disks.
-
•
In NGC 2681 and NGC 3368 the central molecular gas is confined to the inner polar disks, hence these disks are CO-rich. But in NGC 3368 the NIR isophotes cannot be related to the polar disk, because this disk is seen in the dust distribution only, not in that of the stellar component (see scheme in Fig. 18 in Sil’chenko et al., leo (2003)).
-
•
In NGC 4736 there is a molecular bar present elongated along the stellar bar (see notes in Sect. 4.9).
So the molecular gas morphology does not contradict the existence of the structures found in this paper (nuclear coplanar and polar disks).
5.8 Where are the secondary bars?
The circumnuclear regions (of a few kiloparsec in size) in all candidate double-barred galaxies of our sample (except NGC 5566) are dynamically decoupled, because deviations of the gaseous/stellar dynamical axes relative to the lines of nodes or elliptical peaks of are detected on our 2D maps. Various peculiar structures (inner polar and coplanar disks, mini-spirals) were revealed. Such a large fraction of peculiar structures is not surprising, because different structural features can produce twists of the inner isophotes (see Introduction). However, we have not found any kinematic features connected with inner (secondary) bars. This cannot be explained by the limited angular resolution of our kinematic data, because we confirm definitively the nuclear mini-bars (without large bars) in NGC 3368 and NGC 3786. We see two possibilities to explain this.
Firstly, it is possible that the twist of the inner isophotes of galactic images has no connection with a dynamically decoupled inner bar. In this case a “secondary bar” is an illusive structure, and different reasons may cause the isophotal distortion: inner disks or rings, nuclear spirals etc. Indeed, Shaw et al. (shaw (1993)) had constructed a model where the inner twist of the stellar isophotes is triggered by a secular evolution of the gaseous component in a single-barred gas-rich galaxy. See also papers by Friedli et al. (fri96 (1996)), Moiseev (2001b ), and Petitpas & Wilson, (petit (2002)) where various mechanisms are considered for an isophotal twist explanation.
Secondly, the kinematics of the inner bar in a double-barred galaxy differs essentially from single-bar dynamics. In this case, the deviations of and the peaks of the velocity dispersion must be interpreted in a different manner than in this paper. For example, in their last work Corsini et al. (2003b ) have measured different pattern speeds for secondary and primary bar-like structures in NGC 2950. However, of the stellar velocity field coincides with the line of nodes (see Sect. 4.5). New self-consistent models of barred galaxies must be used to investigate this phenomenon.
Of course, selection effects must be kept in mind because our sample is small: we studied only 13 galaxies from Moiseev’s (2001b ) list, or only 6 objects from 50 “photometrically confirmed” double-barred galaxies of Erwin (erwcat (2004)). However, our sample contains the most “classical” double-barred objects with strong twist of the inner isophotes (NGC 2681, NGC 5850).
Nevertheless, the existing samples of double-barred candidates must be revised. First of all, additional 2D kinematics data (panoramic spectroscopy, HI and CO interferometric radio observations) must be acquired for studying any dynamical decoupling of the circumnuclear regions. We hope that our paper is only the first small cautious step in this promising way.
6 Conclusion
The analysis of the morphology and kinematics of 13 double-barred galaxy candidates observed by means of panoramic spectroscopy at the SAO RAS 6m telescope is presented in this paper. We tried to collect the maximum possible information from observed 2D distributions of the optical and NIR surface brightness and kinematic properties. For this goal, panoramic spectroscopy observations were carried out at the 6m telescope. Velocity fields and velocity dispersion fields of ionized gas and stars were constructed from these observations. The rotation curves and radial variations of the dynamical axis position angle were calculated. The analysis of the morphology of the galaxies was done by means of isophote analysis of NIR and optical ground-based and HST archival images.
We suggest that candidate double-barred galaxies are, in fact, galaxies with very different circumnuclear structure. It is necessary to note that the majority of the observed morphological and kinematic features in our sample galaxies may be explained without the secondary bar hypothesis. Three cases of inner polar disks, one counter-rotating gaseous disk and seven nuclear disks (with and without mini-spirals) nested in large-scale bars were found in this work. However, we think that the observational data presented here, particularly the 2D data, will be useful to proponents as well as to opponents of the secondary bar hypothesis. Doubtless the models of such galaxies must explain all their observed kinematic properties.
Acknowledgements.
We would like to thank Olga Sil’chenko, Victor Afanasiev, Lilia Shaliapina and Enrico Corsini for their interest and numerous discussions. We also thank the referee, Glen Petitpas for careful reading and useful comments. This research has made use of the NASA/IPAC Extragalactic Database (NED), which is operated by the Jet Propulsion Laboratory, California Institute of Technology, under contract with the National Aeronautics and Space Administration. Also HyperLeda database and data from Canadian Astronomy Data Center (CADC) were used. CADC is operated by the Herzberg Institute of Astrophysics, National Research Council of Canada. The authors would like to thank all the staff of the Observatorio Astronómico Nacional, in San Pedro Martir, México for their assistance during the NIR observations. This work was partially supported by the RFBR grants No. 03-02-06070mas, 02-02-16878 and by the Russian Science Support Foundation.References
- (1) Aguerri, J.A.L., Debattista, V.P., Corsini, E.M., 2003, MNRAS, 338, 465
- (2) Afanasiev, V.L., Dodonov, S.N., Moiseev, A.V., 2001, in “Stellar dynamics: from classic to modern”, eds. Osipkov L.P., Nikiforov I.I., Saint Petersburg, 103
- (3) Afanasiev, V.L., Mikhailov, V.P., Shapovalova, A.I., 1998, Astron. Astrophys. Trans, 16, 257
- (4) Afanasiev, V.L. & Shapovalova, A.I., 1981, Astrophysics, 17, 221
- (5) Afanasiev, V.L. & Shapovalova, A.I., 1996, ASP Conf. Ser., 91, 221
- (6) Afanasiev, V.L., & Sil’chenko, O.K., 1999, AJ, 117, 1725
- (7) Arnaboldi, M. & Sparke, L.S., 1994, AJ, 107, 958
- (8) Barnes, E.I., & Sellwood, J.A., 2003, AJ, 125, 1164
- (9) Begeman, K.G., 1989, A&A, 223, 47
- (10) Bender, R. & Möellenhoff, C., 1987, A&A, 177, 71
- (11) Bertola, F., Buson, L.M., Zeilinger, W.W., 1992, ApJ, 401, L79
- (12) Bertola, F., Cinzano, P., Corsini, E. M., Rix, H.-W., Zeilinger, W.W., 1995, ApJ, 448, L13
- (13) Binney, J., & Tremaine, S., 1987, Galactic Dynamics: Princeton
- (14) Buta, R., 1986, ApJS, 61, 609
- (15) Buta, R., & Crocker, D.A., 1993, AJ, 105, 1344
- (16) Cappellari, M., Bertola, F., Burstein, D., et al., 2001, ApJ, 551, 197
- (17) Chevalier, R.A., & Furenlid, I., 1978, AJ, 225, 67
- (18) Combes, F., & Gerin, M., 1995, A&A, 150, 327
- (19) Corsini, E.M., Pizzella, A., Coccato, L., Bertola, F., 2003a, A&A, 408, 873
- (20) Corsini, E.M., Debattista, V.P., Aguerri, J.A.L., 2003b, ApJ, 599, L29
- (21) Cruz-Gonzalez, I., Carrasco, L., Ruiz, E., et al., 1994, Rev. Mex. Astron. Astrofis., 29, 197
- (22) de Vaucouleurs, G., 1975, ApJS, 29, 193
- (23) Dodonov, S.N., Vlasyuk, V.V., Drabek, S.V., 1995, “Interferometer Fabry-Perot: user manual”, N.Arkhiz
- (24) Ferruit, P., Wilson, A. S., Mulchaey, J., 2000, ApJS, 128, 139
- (25) Englmaier, P., & Shlosman, I., 2000, ApJ, 528, 677
- (26) Erwin, P., 2004, A&A, accepted
- (27) Erwin, P., & Sparke, L.S., 1999, ApJ, 521, L37
- (28) Erwin, P., & Sparke, L.S., 2002, AJ, 124, 65
- (29) Erwin, P., & Sparke, L.S., 2003, ApJS, 146, 299
- (30) Erwin, P., Vega Beltrań, J.C., Beckman, J., 2001, ASP Conf. Proc., 249. 171 (astro-ph/0112056)
- (31) Erwin, P., Vega Beltrań J.C., Graham, A.W., Beckman, J.E., 2003, ApJ, 597, 929
- (32) Elmegreen, D.M., Elmegreen, B.G., Eberwein, K.S, 2002, ApJ, 564, 234
- (33) Emsellem, E., 2002, astro-ph/0202522
- (34) Emsellem, E., Greusard, D., Combes, F., et al., 2001a, A&A, 368, 52
- (35) Emsellem, E., Greusard, D., Friedli, D., Combes, F., 2001b, Astrop. and Space Science (Suppl.), 277, 455
- (36) Emsellem, E., & Friedli, D., 2000, ASP Conf. Ser., 197, 51, (astro-ph/9910260)
- (37) Fridman, A.M., Afanasiev, V.L., Dodonov, S.N. et al., 2004, submitted to A&A
- (38) Fridman, A.M., & Khoruzhii, O.V., 2000, Physics Letters A, 276, 199
- (39) Frei, Z., Guhathakurta, P., Gunn, J.E., Tyson, J.A., 1996, AJ, 111, 174
- (40) Friedli, D., & Martinet, L., 1993, A&A, 277, 27
- (41) Friedli, D., Wozniak, H., Rieke, M., Martinet, L., Bratschi, P., 1996, A&AS, 118, 461
- (42) Hagen-Thorn, V.A. & Reshetnikov, V.P., 1997, A&A, 319, 430
- (43) Heller, C., Shlosman, I., Englmaier, P., 2001, ApJ, 553, 661
- (44) Helou, G., Salpeter, E.E., Terzian, Y., 1987, AJ, 87, 1443
- (45) Heraúdeau, P., Simien, F., Maubon, G., Prugniel, P., 2001, A&AS, 136, 509
- (46) Higdon, J., Buta, R., Purcel, G.B., 1998, AJ, 115, 80
- (47) Garcia-Gomez, C., & Athanassoula, E., 1991, A&AS, 89, 159
- (48) Jogee, S., Baker, A.J., Sakamoto, K., Scoville, N.Z., Kenney, J.D.P., ASP Conf. Proc., 2001, 249, 612 (astro-ph/0201209)
- (49) Jungwiert, B., Combes, F., Axon, D.J., 1997, A&AS, 125, 479
- (50) Junquera, S., & Combes, F., 1996, A&A, 312, 703
- (51) Kent, S.M., 1984, ApJS, 56, 105
- (52) Kohno, K., Kawabe, R., Vila-Vilaro, B., 1999, ApJ, 511, 157
- (53) Kormendy, J., 1982, ApJ, 257, 75
- (54) Kuijken, K., Fisher, D., Merrifield, M.R., 1996, MNRAS, 283, 543
- (55) Laine, S., Shlosman, I., Knapen, J.H., Peletier, R.F., 2002, ApJ, 567, 97
- (56) Lindblad, P.O., A&ARev., 1999, 9, 221
- (57) Lyakhovich, V.V., Fridman, A.M., Khoruzhii, O.V., Pavlov, A.I., 1997, Astron. Reports, 41, 447
- (58) Maciejewski, W., & Sparke, L.S., 2000, MNRAS, 313, 745
- (59) Maciejewski, W., Teuben, J., Sparke, L.S., Stone, J.M., 2002, MNRAS, 329 502
- (60) Márquez, I., Masegosa, J., Durret, F., et al., 2003, A&A, 409, 459
- (61) Miller, R.H., & Smith, B.F., 1979, ApJ, 227, 785
- (62) Moiseev, A.V., 1998, preprint of the SAO RAS, 134, 1
- (63) Moiseev, A.V., 2000, A&A, 363, 843
- (64) Moiseev, A.V., 2001a, Bull. Spec. Astrophys. Obs., 51, 11 (astro-ph/0111219)
- (65) Moiseev, A.V., 2001b, Bull. Spec. Astrophys. Obs., 51, 140 (astro-ph/0111220)
- (66) Moiseev, A.V., 2002a, Bull. Spec. Astrophys. Obs., 54, 74, (astro-ph/0211104)
- (67) Moiseev, A.V., 2002b, Astronomy Letters, 28, (astro-ph/0211105)
- (68) Moiseev, A.V. & Mustsevoi, V.V, 2000, Astro. Letter., 26, 665 (astro-ph/0011225)
- (69) Moiseev, A.V., Valdes, J.R., Chavushan, V.O., 2002, ASP Conf. Ser., 282, 261 (astro-ph/0202192)
- (70) Monnet, G., Bacon, R., Emsellem, E., 1992, A&A, 253, 366
- (71) Moriondo, G., Givanardi, C., Hunt, L.K., 1998, A&AS, 130, 81
- (72) Mulchaey, J.S., Regan, M.W., Kundu, A., 1997, ApJS, 110, 299
- (73) Mulder, P.S., 1995, A&A, 303, 57
- (74) Petitpas, G.R., & Wilson, C.D., 2002, ApJ, 575, 814
- (75) Petitpas, G.R., & Wilson, C.D., 2003, ApJ, 587, 649
- (76) Pérez, E., Márquez, I., Durret, F., et al., 2000, A&A, 353, 893
- (77) Pfenninger, D., & Norman, C.A., 1990, ApJ, 363, 391
- (78) Richter, O.-G., & Sancisi, R., 1994, A&A, 290, L9
- (79) Rozas, M., Relano, M., Zurita, A., Beckman, J.E., 2002, A&A, 386, 42
- (80) Saikia, D.J., Phookun, B., Pedlar, A., Kohno, K., 2002, A&A, 383, 98
- (81) Sakamoto, K., Okumura, S.K., Ishizuki, S., Scoville, N.Z., 1999, ApJS, 124, 403
- (82) Schinnerer, E., Maciejewski, W., Scoville, N., Moustakas, L.A., 2002, ApJ, 575, 826
- (83) Schneider, S.E., 1989, ApJ, 343, 94
- (84) Sérsic, J.-L. 1968, Atlas de Galaxias Australes (Cordoba: Obs. Astron.)
- (85) Shalyapina, L.V., Moiseev, A.V., Yakovleva, V.A., Astronomy Letters, 28, 443, (astro-ph/0206397)
- (86) Shaw, M.A., Combes, F., Axon, D.J., Wright, G.S., 1993, A&A, 273, 31
- (87) Shlosman, I., Frank, J., Begeman, M.C., 1989, Nature, 338, 45
- (88) Shlosman, I., & Heller, C., 2002, ApJ, 565, 921
- (89) Sil’chenko, O.K., 2002, Astro. Letter., 28, 207
- (90) Sil’chenko, O.K., Moiseev, A.V., Afanasiev, V.L., Chavushyan, V.H., Valdés, J.R., 2003, ApJ, 591, 185
- (91) Sofue, Y., Wakamatsu, K.I., Taniguchi, Y., Nakai, N., 1993, PASJ, 45, 43
- (92) Sofue, Y., & Wakamatsu, K.I., 1994, AJ, 107, 1018
- (93) Tonry, J., & Davis M., AJ, 84, 1511
- (94) Turnbull, A.J., Bridges, A.J., Carter, D., 1997, MNRAS, 307, 967
- (95) van Driel, W., & Buta, R.J., 1993, A&A, 245, 1991
- (96) van Moorsel, G., 1982, A&A, 107, 66
- (97) Vauterin, P., & Dejonghe, H., 1997, MNRAS, 286, 812
- (98) Vega Beltrań, J.C., Pizzella, A., Corsini, E. M., et al., 2001, A&A, 374, 394
- (99) Wong, T., & Blitz, L., 2000, ApJ, 540, 771
- (100) Wozniak, H., Friedli, D., Martinet, L., Martin, P., Bratschi, P., 1995, A&AS, 111, 115
- (101) Wozniak, H., 2000, ASP Conf. Ser., 197, 75,(astro-ph/9910007)
- (102) Wozniak, H., Combes, F., Emsellem, E., Friedli, D., 2003, A&A, 409, 469
- (103) Zasov, A.V. & Khoperskov, A.V., 2002, Astronomy Reports, 46, 173