The Planetary Nebula System and Dynamics in the Outer Halo of NGC 5128
Abstract
The halos of elliptical galaxies are faint and difficult to explore, but they contain vital clues to both structure and formation. We present the results of an imaging and spectroscopic survey for planetary nebulae (PNe) in the nearby elliptical NGC 5128. We extend the work of Hui et al. (1995) well into the halo of the galaxy—out to distances of 100 and 50 kpc along the major and minor axes. We now know of 1141 PNe in NGC 5128, 780 of which are confirmed. Of these 780 PNe, 349 are new from this survey, and 148 are at radii beyond 20 kpc. PNe exist at distances up to 80 kpc (), showing that the stellar halo extends to the limit of our data. This study represents by far the largest kinematic study of an elliptical galaxy to date, both in the number of velocity tracers and in radial extent. We confirm the large rotation of the PNe along the major axis, and show that it extends in a disk-like feature into the halo. The rotation curve of the stars flattens at km s-1 with between 1 and 1.5, and with the velocity dispersion of the PNe falling gradually at larger radii. The two-dimensional velocity field exhibits a zero-velocity contour with a pronounced twist, showing that the galaxy potential is likely triaxial in shape, tending toward prolate. The total dynamical mass of the galaxy within 80 kpc is , with . This mass-to-light ratio is much lower than what is typically expected for elliptical galaxies.
Subject headings:
dark matter — galaxies: elliptical and lenticular, cD — galaxies: halos — galaxies: individual (NGC 5128) — galaxies: kinematics and dynamics — planetary nebulae: general1. Introduction
| Data | Acquired AT/With | Date |
|---|---|---|
| [O III] on-/off-band, inner halo | CTIO, Prime Focus CCD | 1993 Jun 17–19 |
| [O III] on-/off-band, outer halo | CTIO, Prime Focus CCD | 1995 Mar 24–28 |
| [O III] and V imaging | CTIO, Mosaic II CCD camera | 2000 Jun 4 |
Extragalactic planetary nebulae (PNe) are powerful tools for studying the dynamical states of early-type galaxies. Using their bright [O III] emission lines, we can identify PNe and typically measure their radial velocities to an accuracy of . Traditionally, the kinematics of old stellar populations are derived from absorption line profiles in integrated spectroscopy (e.g. Bender, Saglia, & Gerhard 1994; Kronawitter et al. 2000). This method, however, is limited to the relatively high surface brightness central regions of galaxies (), where the mass density is dominated by baryons. Unlike in spirals where the rotation curves can be measured out to a large radii using H I observations, very few ellipticals have large scale H I disks or polar rings that can be used to probe the potential in the halo. So, while current theories of structure formation predict that elliptical galaxies should reside in massive dark matter halos, the dynamical evidence for these halos is not nearly as complete or as conclusive as it is for spiral galaxies (e.g. Gerhard et al. 2001, Romanowsky et al. 2003).
Using PNe, we can now obtain kinematical information in the halos of early-type galaxies at radii up to 80 kpc, allowing us to study the two-dimensional stellar kinematics and the mass distribution in these galaxies. Because PNe are evolved asymptotic giant branch (AGB) stars, their kinematics must trace that of the underlying stellar population, making them ideal test particles for dynamical studies. PNe have been used successfully as velocity test particles in many elliptical galaxies. As early as a decade ago, Ciardullo et al. (1993) measured velocities for 29 PNe within kpc for NGC 3379. Other examples include Arnaboldi et al. (1998), who discovered 43 PNe within kpc for NGC 1316 (Fornax A), and Méndez et al. (2001), who measured velocities for 535 PNe within kpc for NGC 4697. More recently, Romanowsky et al. (2003) presented results from a PN spectrograph study in which PNe were observed in each of three galaxies out to radii of 4–6 .
The work most relevant to this paper is the study of Hui et al. (1995, hereafter H95), who first investigated the PN system of NGC 5128. At a distance of 3.5 Mpc (Hui et al. 1993a, hereafter H93a), NGC 5128 is the closest large elliptical galaxy to the Milky Way and is a prime candidate for PNe studies. At the distance of NGC 5128, . Hui et al. 1993b (H93b) identified 785 PNe in NGC 5128, and H95 measured velocities for 431 PNe. This previous study probed the halo potential out to projected distances of along the major axis and along the minor axis, and produced strong evidence for: 1) A dark matter halo, 2) A significant quantity of angular momentum in the halo, and 3) Intrinsic triaxiality in the true shape of the galaxy.
In this study, we present the results of an extended survey in which we have identified and measured velocities for PNe in NGC 5128 out to projected distances of 80 and 40 kpc along the major and minor axes, respectively. We identified 356 new PN candidates, many of which are beyond 20 kpc, bringing the total number of PNe in NGC 5128 to 1141. In total, we were able to measure 349 new PN radial velocities, which increases the kinematic sample to 780 PNe. Similar studies in other galaxies have typically used 2–10 times fewer test particles (whether PNe or globular clusters), and have mostly been conducted in regions where . The data set we present in this paper represents by far the largest kinematic survey of an elliptical galaxy to date, both in the number of velocity tracers, and the radial extent in the galaxy halo ().
2. The Survey
We can identify extragalactic PNe candidates by their bright [O III] emission lines. PNe, which have strong emission lines and very little continuum emission, are detected in images taken through an “on-band” [O III] filter, but are not detected in images taken through an “off-band” continuum filter. Optimally, the on-band filter is designed such that its central wavelength matches the wavelength of redshifted to the systemic velocity of the galaxy, and its width is large enough to encompass the velocity dispersion of the observed galaxy’s stars. For NGC 5128, its systemic velocity of 541 km s-1 (H95) translates into an on-band filter centered at 5016Å. A typical galactic velocity dispersion of 200 km s-1 requires a filter width of greater than 20Å in order to include all PNe with velocities of less than 3- from the mean. Ideally, the off-band filter is an intermediate-band filter that is not far from the [O III] line, but does not include it. In some cases, a Johnson V-band filter is used as the off-band. The V filter can be used as an off-band despite the fact that it contains the [O III] line because of its large bandpass (Å).
After identifying PNe candidates in the imaging, we obtain spectra of them with multi-fiber spectrographs. The detection of the [O III] emission line allows us to measure their radial velocities. In bright PNe, we can also see the [O III] emission line. For a small subset of our sample (22 PNe), we measured the velocity using the H emission line.
2.1. Imaging
2.1.1 Observations
| Field | RA(2000) | Dec(2000) | Field-of-View (′) |
|---|---|---|---|
| f10 | 13:23:21.26 | 43:15:20.09 | |
| f12 | 13:27:14.46 | 43:01:18.30 | |
| f14 | 13:24:36.65 | 43:01:01.59 | |
| f16 | 13:28:30.72 | 42:46:55.61 | |
| f17 | 13:26:46.06 | 42:47:00.56 | |
| f18 | 13:25:56.82 | 42:46:56.58 | |
| f21 | 13:28:03.09 | 42:33:08.67 | |
| f8 | 13:25:27.89 | 43:15:41.55 | |
| f22 | 13:26:44.92 | 42:32:47.81 | |
| f15 | 13:22:54.30 | 43:00:41.51 | |
| f19 | 13:24:07.66 | 42:46:45.31 | |
| f20 | 13:22:55.67 | 42:46:51.95 | |
| f21 | 13:27:58.66 | 42:32:49.00 | |
| f23 | 13:25:27.95 | 42:33:00.94 | |
| f24 | 13:24:11.27 | 42:33:00.52 | |
| f30 | 13:24:09.04 | 43:42:59.67 | |
| f31 | 13:22:48.88 | 43:42:44.84 | |
| f40 | 13:24:12.59 | 42:18:58.32 | |
| f41 | 13:25:28.32 | 42:18:53.75 | |
| f42 | 13:26:43.04 | 42:18:48.18 | |
| f43 | 13:27:59.18 | 42:18:56.95 | |
| f5 | 13:22:54.56 | 43:28:48.03 | |
| f7 | 13:26:44.96 | 43:14:48.87 | |
| f4 | 13:24:08.97 | 43:28:55.40 | |
| mosNE | 13:28:13.59 | 42:04:24.82 | |
| mosSW | 13:21:54.56 | 44:06:50.84 |
We imaged the halo of NGC 5128 over the course of three observing runs using the Blanco 4-meter telescope at Cerro Tololo Inter-American Observatory (CTIO). These imaging runs are listed in Table 1. All imaged fields are listed in Table 2, and shown on a image of NGC 5128 from the Digitized Sky Survey in Figure 1.
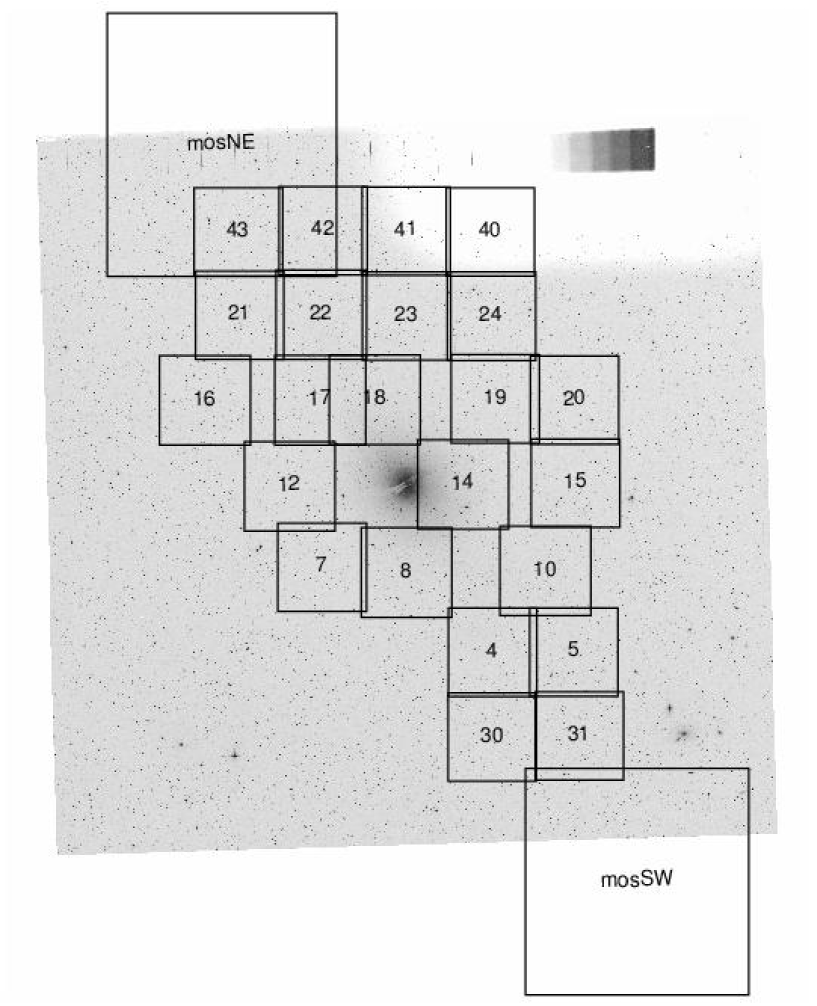
During the first run, on 1993 Jun 17–19, we used the Prime Focus CCD Imager (PFCCD) to image twelve halo fields. In 1993, the PFCCD pixel detector covered a field on the sky at a pixel scale of . Typical seeing was in the range –. There was thin cirrus on the first night, but conditions were photometric for the other two. The centering of the CCD frame was off by several arc minutes east for five of the observed fields (10,12,14,16,18). While this introduced a few gaps in our survey region, it did not have any impact on the presented science.
During our second run, 1995 Mar 24–28, we used the PFCCD to observe fifteen more halo fields. Three of the 1993 fields (4,5,21) were re-observed because the seeing and weather were better. In 1995, the PFCCD covered a field on the sky at a pixel scale of . Seeing was in the range –, and weather conditions were non-photometric on the first night (thin cirrus), but photometric for the remainder of the run.
For both PFCCD imaging runs, we used a narrowband filter with a central wavelength of 5016Å and a transmission FWHM of 35Å in an f/2.7 beam. The off-band filter for these runs was a 200Å wide filter centered at 5280Å. For each field, the total exposure times were typically 2400–3600 s through the on-band filter, and 500s through the off-band filter. The off-band images are deeper in the continuum to help avoid spurious PN detections.
On a third observing run, we used the CTIO Mosaic II CCD camera to image two major axis fields on opposite sides of the galaxy centered at projected radii of 75 (NE) and 85 (SW) kpc. This imaging was done on 2000 June 4 under photometric, moonless conditions with a seeing of . For our Mosaic imaging, we used an on-band filter with a central wavelength of 5016Å and a FWHM of 45Å in an f/2.87 beam. In place of a true off-band filter, we substituted a Johnson V filter. Total exposure times were 3600s in [O III] and 300s in V.
2.1.2 PNe Detection and Astrometry
We used standard CCD reduction software in IRAF111IRAF is distributed by the National Optical Astronomy Observatories, which are operated by the Association of Universities for Research in Astronomy, Inc., under cooperative agreement with the National Science Foundation. to bias subtract, flat field, and remove cosmic rays from our imaging data. PN identification can be done in a few different ways. The traditional method of “blinking” on- and off-band images was used for some of our survey. We also divided the on-band by the off-band to look for bright, stellar residuals. Another technique, used on f14, f15, and our Mosaic fields, is to employ an object detection algorithm such as SExtractor (Bertin 1996), and select objects that have large color. This is similar to the method described in Arnaboldi et al. (2002). Even when automated detection was employed, all PN candidates were visually inspected.
Deriving accurate positions for PNe candidates is important for fiber spectroscopy, where fibers are only 2–3 in diameter. The fact that our data were taken over a period of many years during which astrometric reference catalogs continually improved compels us to be very careful when creating an internally consistent astrometric catalog. All positions published in this paper are on the astrometric reference frame of the USNO-A2.0 catalog (Monet et al. 1998). The reference catalogs used for spectroscopic follow-up, however, also included the Guide Star Catalog v1.0 (GSC; Lasker et al. 1990), GSC v1.2, and USNO-A1.0.
Compared to the GSC v1.0 and v1.2, the USNO-A2.0 catalog has both a higher stellar density and astrometry that is less plate-dependent. With NGC 5128’s relatively low galactic latitude (), and the depth of the USNO-A2.0 catalog, there was no shortage of astrometric reference stars with which to obtain a solution—hundreds of stars with magnitudes between 13.5 and 17.0 were used for each field. Typically, fourth-order polynomials were necessary to fit the data, obtaining positional accuracy with residuals. We used overlap between neighboring PFCCD fields to confirm that our astrometry was consistent between fields.
Astrometry for the H93b sample of PNe was based on the GSC v1.0, which possesses a small, but non-negligible zeropoint shift when compared to the USNO-A2.0 system. Although the internal relative astrometry for the previously published and the current work has RMS errors of only –, the zeropoint shifts between systems could be as large as . Our goal was to create a consistent set of positions that future observers could observe in the same fiber configuration, and also to match duplicate observations of the same object. Since the relative astrometry used for each observing run was shown to be satisfactory by proof of successful spectroscopic observations, when making the merged, final catalog, we decided that simple zeropoint shifts would suffice to make the PN positions consistent.
To calculate the appropriate shifts in the vicinity of NGC 5128, we found the USNO-A2.0 positions for the bright GSC reference stars listed in H93b (their Table 2). From these, we calculated shifts of in right ascension and in declination (to be applied to the H93b positions). In all cases, we checked our new astrometry against the PN positions in the actual images and found that they agreed. We include in Table 3 a list of bright, isolated, astrometric fiducial stars from the USNO-A2.0 catalog. These stars were used for guide fibers when taking spectra of PNe. Not only can they be used in future observations, but they can also be used to translate the coordinates published in this paper to future astrometric reference frames.
| Name | RA(J2000) | Dec(J2000) | R mag |
|---|---|---|---|
| F01 | 13:24:49.38 | 43:05:07.7 | 14.0 |
| F02 | 13:25:56.18 | 43:09:60.0 | 14.0 |
| F03 | 13:26:17.59 | 42:55:36.9 | 14.0 |
| F04 | 13:26:05.46 | 42:51:37.9 | 14.0 |
| F05 | 13:24:37.28 | 42:47:05.0 | 14.0 |
| F06 | 13:23:55.81 | 42:55:42.0 | 14.0 |
| F07 | 13:23:51.18 | 43:03:53.8 | 14.0 |
| F08 | 13:25:07.04 | 42:41:57.3 | 14.0 |
| F09 | 13:24:31.48 | 43:18:29.7 | 14.0 |
| F10 | 13:26:24.10 | 43:19:03.2 | 14.0 |
| F11 | 13:24:46.97 | 43:20:29.8 | 14.0 |
| F12 | 13:24:05.15 | 42:46:52.8 | 14.0 |
| F13 | 13:27:21.77 | 42:51:50.5 | 14.0 |
| F14 | 13:24:08.86 | 42:42:49.9 | 14.0 |
| F15 | 13:26:52.11 | 43:19:40.9 | 14.0 |
| F16 | 13:27:39.21 | 42:59:41.7 | 14.0 |
| F17 | 13:23:25.38 | 42:51:50.0 | 14.0 |
| F18 | 13:23:38.87 | 43:18:50.3 | 14.0 |
| F19 | 13:24:34.99 | 43:27:46.6 | 14.0 |
| F20 | 13:24:03.98 | 43:26:10.1 | 14.0 |
| F21 | 13:24:21.90 | 43:28:31.7 | 14.0 |
| F22 | 13:27:59.96 | 42:49:59.5 | 14.0 |
| F23 | 13:25:13.90 | 43:34:22.8 | 14.0 |
| F24 | 13:23:56.25 | 43:33:28.9 | 14.0 |
| F25 | 13:28:33.83 | 43:20:29.8 | 14.0 |
| F26 | 13:28:19.55 | 42:36:01.6 | 14.0 |
| F27 | 13:25:53.61 | 43:42:28.6 | 14.0 |
| F28 | 13:28:42.28 | 43:23:57.6 | 14.0 |
| F29 | 13:22:08.23 | 43:22:50.7 | 14.0 |
| F30 | 13:29:11.28 | 43:12:44.8 | 14.0 |
| F31 | 13:28:16.53 | 43:30:24.1 | 14.0 |
| F32 | 13:22:52.84 | 43:34:01.3 | 14.0 |
| F33 | 13:30:09.13 | 42:47:32.2 | 14.0 |
| F34 | 13:30:13.34 | 42:50:33.4 | 14.0 |
| F35 | 13:24:16.08 | 43:53:26.6 | 14.0 |
| F36 | 13:29:15.79 | 43:35:50.9 | 14.0 |
| F37 | 13:26:05.39 | 42:04:21.7 | 14.1 |
| F38 | 13:26:02.57 | 42:10:28.4 | 14.1 |
| F39 | 13:26:35.91 | 42:07:51.1 | 14.1 |
| F40 | 13:24:46.80 | 42:12:52.6 | 14.1 |
| F41 | 13:25:01.77 | 42:15:39.7 | 14.1 |
Note. — Positions and magnitudes are from the USNO-A2.0 catalog. All stars are within 1° of NGC 5128.
| Target(s) | Instrument | FOVaaField-of-View | FibersbbNumber of fibers available for each configuration | Grating | ResccSpectral Resolution | Date |
|---|---|---|---|---|---|---|
| (′) | (Å) | |||||
| PN | AAO/2dF | 120 | 200 | 1200V | 2.2 | 1997 Mar 14,16 / Apr 3–5 |
| PN | CTIO/ARGUS | 50 | 24 | KPGL3 | 3.4 | 1997 May 13–14 |
| PN/GC | AAO/2dF | 120 | 400 | 1200B | 2.2 | 2001 Jan 20 |
| PN/GC | CTIO/Hydra | 40 | 130 | KPGL3 | 4.9 | 2001 Feb 18–20 |
| PN/GC | AAO/2dF | 120 | 400 | 1200V | 2.2 | 2002 Apr 4–6, 9–10 |
| PN (H) | AAO/2dF | 120 | 400 | 1200V | 2.2 | 2002 Jul 7 |
Although these data were taken under conditions of variable transparency and seeing, and we did not apply photometric calibrations to them, the limiting magnitude of each image in this new survey is at least as faint or fainter than that of H93a, which was complete to , or 1.5 magnitudes down the PN luminosity function. In all cases where our fields overlapped area previously surveyed, we recovered all of the PNe listed in H93b. In addition, we were able to identify additional candidates in these regions that were not detected in the previous study. In total, we identified 356 new PN candidates which, in addition to the 785 PNe listed in H93b, brings the total number of [O III] imaging detections in NGC 5128 to 1141. Of these 1141, 431 PNe were previously confirmed spectroscopically by H95. In the following section, we describe our effort to obtain radial velocities for the remaining candidates.
2.2. Spectroscopy
2.2.1 Observations
Spectroscopy was done over the course of six separate observing runs: four with the Anglo-Australian Observatory (AAO) 2-degree Field (2dF) fiber spectrograph, one with the CTIO Argus spectrograph, and one with the CTIO Hydra spectrograph. The 2dF spectrograph in particular is an ideal instrument for NGC 5128 studies because its field-of-view encompasses a 60 kpc radius around the galaxy center. Central crowding of PNe is the primary limitation that prevents maximal fiber allocation. We targeted the 356 new candidates from the 1993–2000 imaging data as well as 353 candidates from the sample of H93b that had no previous velocity measurement. On three of these runs, fiber configurations also included globular cluster candidates in NGC 5128 (Peng, Ford, & Freeman 2004b). For the first five runs, the spectral range was centered on the [O III] line, and for the last run it was centered on H. The spectrograph setups, fields of view, and resolutions are presented in Table 4.
Our first AAO/2dF observing run occurred during parts of four nights in the spring of 1997. This period was designated as “shared-risk” for 2dF, and only one spectrograph (with 200 fibers) was available. The weather was clear and seeing was – for all three nights. Total exposure time for each configuration ranged from 1–2.5 hours.
In May 1997, we used the ARGUS multi-fiber spectrograph on the CTIO 4-meter telescope to observe PNe candidates from the 1995 imaging data, as well as some from the 1993 data set. At the time of the observations, ARGUS contained 24 fiber pairs, each in diameter. We observed seven fiber configurations over two nights, with each configuration receiving 2.25 hours of exposure time.
Our second AAO/2dF observing run was taken in service mode in January, 2001. We received one 2.5 hour exposure for a single fiber configuration. This is the first of three runs where we also placed fibers on globular cluster candidates.
In February, 2001, we observed with the Hydra multi-fiber spectrograph on the CTIO 4-meter. We obtained data for five fiber configurations over three nights of clear weather, and – seeing. The spectral resolution of this data is lower than for other runs, but this did not seem to affect the velocity accuracy.
Our third 2dF run was in April, 2002 during bright conditions. We used a total exposure time of 7.5 hours for one fiber configuration over the course of five nights.
Our fourth 2dF data set was taken in service mode during July, 2002. This one differed from previous runs in that the grating was centered on the H emission line. Previously unobserved PNe that were targeted in this fiber setup were from fields 14 and 15.
2.2.2 Data Reduction
With the development of a number of dedicated software packages, the reduction of fiber spectroscopy is relatively routine. For our reductions we used either the 2dF data reduction package (2dfdr), or the IRAF packages doargus and dofibers. At the time of our first 2dF observations, 2dfdr was still being developed, so we chose to reduce our data with dofibers in IRAF.
In a typical reduction, images were bias subtracted and the spectra were extracted using a fiber flat field exposure. The extracted spectra were then flat-fielded and wavelength calibrated. Arc lamp exposures, taken through the night, showed that the wavelength solution did not change appreciably over time. Nevertheless, we used the nearest arc exposure (in time) to dispersion correct each exposure before combining. RMS residuals in the wavelength solution were typically Å. The spectra were throughput corrected using either offset sky exposures (2dF), sky line fluxes (2dF/H), or projector flats (Hydra). A median sky was created using 20–40 sky fibers, and then was subtracted from each spectrum. Finally, the multiple exposures from each fiber configuration were regridded to a common dispersion solution and averaged with a 3- rejection threshold for cosmic rays.
There were some exceptions to this description of the reduction process. For the Argus data and first 2dF data, flat fielding, throughput corrections, and sky subtraction were not applied—these calibrations do not affect the measurement of emission line radial velocities. Also, the fiber flats taken during our first 2dF run were not appropriate for aperture extraction, so the arc exposures were used instead.
2.2.3 Velocity Measurement
We visually inspected each combined spectrum for the presence of the [O III] emission line. For those spectra where there was discernible [O III] emission, we fit the line centers using the IRAF package rv, and applied heliocentric corrections to the measured doppler velocities. We noted the detection of [O III] in bright PNe, but did not include this line in the velocity measurement.
We also verified that the lines were symmetric and unresolved. Previous surveys for intracluster PNe in Virgo have accidentally detected Lyman emitting galaxies at high redshift (Kudritzki et al. 2000). In these galaxies, the line is redshifted into the on-band filter. For the filters we used to survey NGC 5128, a Lyman galaxy would need to be near to be detected. The detection of both lines confirms that the observed lines are from [O III]. For those spectra where only one line is detected, we can check for an overly broad or asymmetric line profile, a signature of Lyman . All one-line PN spectra were checked manually, and none were obvious Lyman galaxies. This is not surprising because NGC 5128 is over three times closer than the Virgo cluster. Our images can be shallower than those for surveys in Virgo and still detect PNe that are 2.5 magnitudes down the PN luminosity function (similar to H93a). By re-observing PNe with published photometry (H93b), we find that the faintest objects for which we measure velocities have , which is approximately two magnitudes down the PN luminosity function. By comparison, in a narrowband blank-field survey to measure the surface density of background galaxy contaminants, Ciardullo et al. (2002) found zero galaxies that had line fluxes this bright, albeit in a significantly smaller area of sky. This is consistent with early surveys for emission line galaxies (summarized by Prichett 1994) which were unsuccessful and had depths similar to or deeper than our PN survey. As a result, high redshift Lyman galaxy interlopers are not of a problem for this PN survey of NGC 5128.
3. The Planetary Nebula Catalogs
Ultimately, we wished to create a table of all the unique PNe in NGC 5128 with their positions and best radial velocities. This task was complicated by imaging overlap regions, two astrometric systems and multiple observing runs. Below, we outline the steps we took to produce the final catalogs.
3.1. Duplication and Velocity Accuracy
Once our entire catalog was on a common astrometric system, we matched each PN against the entire catalog to check duplication. Mainly, duplication occurred in overlap regions where PNe were identified in separate images and given different names. In cases where a “new” PN was actually previously observed in H95, we assigned a new composite name. When two PNe were both previously unpublished, one name was chosen. In the process of checking for duplicates, we discovered that one PN in the H95 catalog, 5504, was observed twice and listed twice. Another pair of PNe, 5420 and 5423, were found to be the same object. In both cases, we averaged the two velocity measurements and removed one listing from our catalog. The correct number of unique PNe in H95 should be 431.
Besides the unintentional duplication, we also purposely repeated spectroscopic observations of certain PNe over multiple observing runs. Together, these PNe allowed us to quantify systematic velocity offsets and random errors. For consistency, the “zeropoint” velocity reference frame is considered to be the one defined by the PNe published in H95. All data from subsequent observing runs were tied back to the H95 sample by using a sample of re-measured PNe.
Systematic velocity shifts and empirical velocity errors derived from these duplicate and multiply observed PNe are presented in Table 5. The largest systematic shift between any two of the newly presented spectroscopic runs is 11 km s-1, while the largest shift between one of the new spectroscopic runs and H95 is 21 km s-1. All of the velocity offsets between our newer data and H95 have the same sign, and may point to some systematic effect. However, given the small size of the offsets, we chose to bring our velocities onto the system established by H95 for the sake of consistency in the literature. Multiple velocity measurements of the same PN were averaged after applying this offset. Because some PNe from H95 were re-observed, we list them in our catalog with a composite name and their new velocity.
| ObsRunaaRefers to observing runs listed in Table 4 | bbAdd to match H95 velocity frame | PNccNumber of PNe in common with H95 | |
|---|---|---|---|
| (km s-1) | (km s-1) | ||
| 2dF97 | 15.9 | 51 | |
| Argus97ddThe Argus97 sample had no PNe in common with H95. These values are based on 17 PNe in common with the 2dF97. | 15.6 | 17 | |
| 2dF01 | 14.0 | 16 | |
| Hydra01 | 28.3 | 11 | |
| 2dF02 | 11.2 | 15 | |
| 2dF02(H) | 19.2 | 152 |
These repeat observations also allow us to determine the internal velocity measurement errors. We estimate the RMS error as the standard deviation about the mean velocity difference, divided by (making the approximation that the errors are roughly equal for each observing run). RMS velocity errors were typically km s-1, which is comparable to the best errors obtained by H95. This is consistent with the velocity error we derived from our first 2dF run, where 11 PNe were observed in multiple fiber configurations. This internal comparison yielded a velocity RMS error of km s-1. One caveat to this method is that the PNe with duplicate observations tend to be ones with stronger , so these errors, while not atypical, should be considered lower limits.
3.2. The Catalogs
| ID | V | RA(J2000) | Dec(J2000) | X | Y | R |
|---|---|---|---|---|---|---|
| (km s-1) | (hh:mm:ss.ss) | (dd:mm:ss.s) | (′) | (′) | (′) | |
| (1) | (2) | (3) | (4) | (5) | (6) | (7) |
| Ctr003 | 366 | 13:25:48.88 | 42:56:54.5 | 5.650 | 0.771 | 5.684 |
| ctr007 | 483 | 13:25:43.77 | 42:55:03.8 | 6.626 | 1.052 | 6.676 |
| ctr010 | 370 | 13:25:42.29 | 42:55:44.1 | 5.920 | 0.890 | 5.946 |
| ctr013 | 233 | 13:25:40.89 | 42:55:16.7 | 6.148 | 1.361 | 6.248 |
| ctr026 | 521 | 13:25:44.86 | 42:57:44.8 | 4.541 | 0.649 | 4.617 |
| ctr107 | 443 | 13:25:34.50 | 42:58:27.1 | 2.877 | 0.500 | 2.872 |
| ctr109 | 542 | 13:25:24.86 | 43:02:37.6 | 1.554 | 0.450 | 1.555 |
| ctr115 | 270 | 13:26:19.48 | 42:56:53.9 | 8.861 | 5.358 | 10.370 |
| ctr118a | 251 | 13:25:36.61 | 42:58:20.8 | 3.184 | 0.244 | 3.209 |
| ctr118b | 573 | 13:25:27.21 | 43:09:39.4 | 7.066 | 4.834 | 8.530 |
Note. — There are 780 confirmed PNe. The complete version of this table is in the electronic edition of the Journal. The printed edition contains only a sample.
After removing duplicate measurements and incorporating systematic velocity shifts, we merged the samples to yield a catalog of 780 spectroscopically confirmed PNe. Of these, 431 are from H95, and 349 are new. Also, 148 PNe are at projected radii greater than 20 kpc. The names, positions, and velocities of all PNe are presented in Table 6. The columns are: (1) PN identification (field and PN number, H93b designation, or composite name), (2) radial velocity in km s-1, (3) RA (J2000), (4) Dec (J2000), (5) distance along photometric major axis () in arc minutes, positive to the northeast as in H95, (6) distance along photometric minor axis () in arc minutes, positive to the northwest, and (7) projected radius from the galaxy center in arc minutes.
The positional quantities and follow the convention of H95. The position angle of the major axis is , as measured in Dufour et al. (1979). Because our survey area is over across, the small angle approximation for distances on a sphere can be incorrect by as much as . Instead, we transformed the equatorial coordinates to a spherical system with the origin at the center of NGC 5128 and the axes defined by the photometric axes. We adopt the center of NGC 5128 to be the value given by Kunkel & Bradt (1971), which is (, , J2000). This is the same value used in H95. The pole of this system is at (, , J2000), and the longitude of the north celestial pole in this system is . The transformed values are given with enough precision to recover the original equatorial coordinates.
We also present a catalog of PN candidates detected in our imaging for which we do not have a velocity because they have not been observed spectroscopically. There are 361 remaining PN candidates, and they are listed in Table 7.
| ID | RA(J2000) | Dec(J2000) |
|---|---|---|
| 212 | 13:25:36.95 | 43:00:59.6 |
| 215 | 13:25:39.09 | 43:01:01.9 |
| 227 | 13:25:35.18 | 43:00:31.0 |
| 228 | 13:25:36.67 | 43:00:11.5 |
| 229 | 13:25:41.42 | 43:01:25.2 |
| 231 | 13:25:33.86 | 43:00:57.4 |
| 232 | 13:25:35.00 | 43:00:13.0 |
| 235 | 13:25:52.98 | 43:00:55.8 |
| 238 | 13:25:49.47 | 43:01:43.7 |
| 239 | 13:25:35.68 | 43:00:41.2 |
Note. — There are 361 unconfirmed PNe. The complete version of this table is in the electronic edition of the Journal. The printed edition contains only a sample.
3.3. X-ray matches
We compared our PN catalog with the catalog of X-ray point sources in NGC 5128 presented by Kraft et al. (2001). Three X-ray sources are within 2″ of a known PN, although one of these matches (K-053) is more likely to be with with a neighboring continuum object. These PN have IDs 525, 4225, and 5203, and they match with X-ray sources K-053, K-080, and K-241.
4. Results
4.1. The PN Spatial Distribution
Our catalog of PN velocities is unique in its size and spatial coverage. We plot the positions of each confirmed PN on an image of NGC 5128 in Figure 2. The outline of our survey area is also drawn, and follows the outer boundaries of the fields shown in Figure 1. There are a few gaps in our coverage within this region, mainly due to the small CCDs used in the original H93 survey, but also due to a few errors in pointing. The gap between fields 8 and 10 is mostly covered by the H93 survey, but the 6′ gaps between fields 14/15, 16/17, and 18/19 are real. Besides these small regions, almost all of the area within this boundary has been observed to a uniform depth.
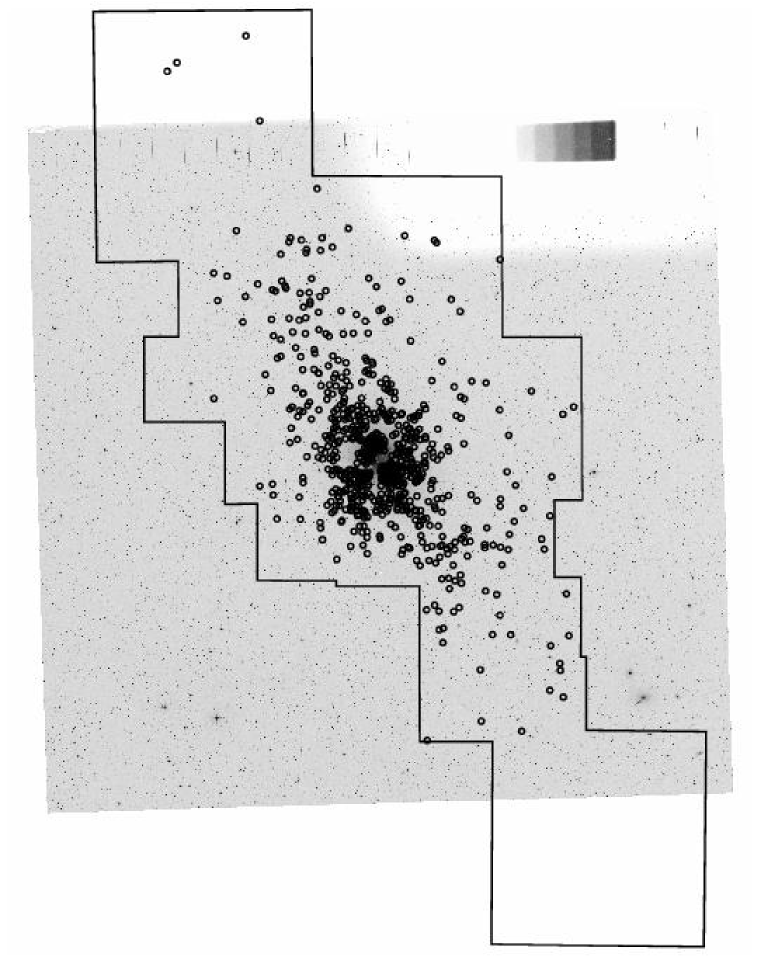
Most of the PNe lie near the photometric major axis of the galaxy, which is at a position angle of . This is especially so in the halo, where the PNe mirror the disky structure seen in deep photographic images (Malin 1978, also shown in Israel 1998). While there are three PNe at projected radii of 80 kpc in our NE Mosaic field, there is a notable absence of PNe in our southwest Mosaic field. This is not surprising, however, as the low surface brightness halo light is known to be somewhat asymmetric, extending more toward the northeast. Qualitatively, the PNe do appear to follow the low surface brightness halo light seen in Malin’s image and in our own observations, and are able to probe regions even fainter than those accessible to broadband photometry.
The detection along the NE major axis of three PNe at kpc with normal velocities (i.e. they are bound to the galaxy) supports the idea that the stellar halo extends to these distances and beyond. Even though these three PNe are spatially close in projection, possibly suggesting some form of halo substructure, we think it is unlikely that they are associated with either each other or the dwarf irregular galaxy ESO 324-G024, which is just under 20 kpc away. ESO 324-G024 has an optical radius of under 2 kpc, the individual PNe are over 15 kpc apart, and they collectively have a velocity dispersion of 172 km s-1. The large differences in their radial velocities can be more easily explained by an extension of the velocity field seen in the inner halo.
4.2. The PN Velocity Field
Both the density of PN velocities in the inner regions and the number of PNe velocities in the outer halo make our sample a valuable resource for dynamical studies. Unlike traditional major and minor axis long-slit spectroscopy of ellipticals (e.g. Franx, Illingworth, & Heckman 1989), discrete velocity tracers such as PNe and globular clusters are more conducive to producing full, two-dimensional velocity fields at large radii. Ongoing kinematic surveys with the planetary nebula spectrograph (Douglas et al. 2002), and integral field spectrographs like SAURON (Bacon et al. 2001), promise that two-dimensional velocity fields will be much more common in the coming years.
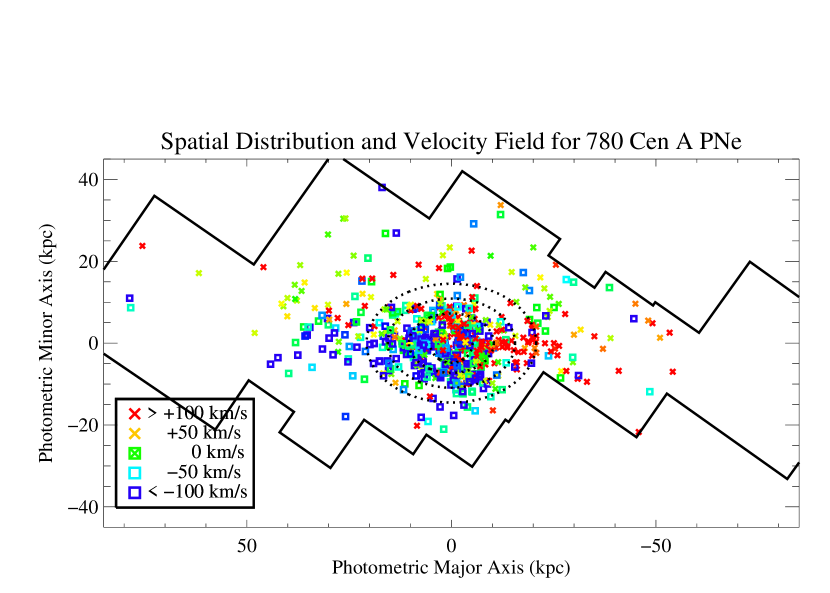
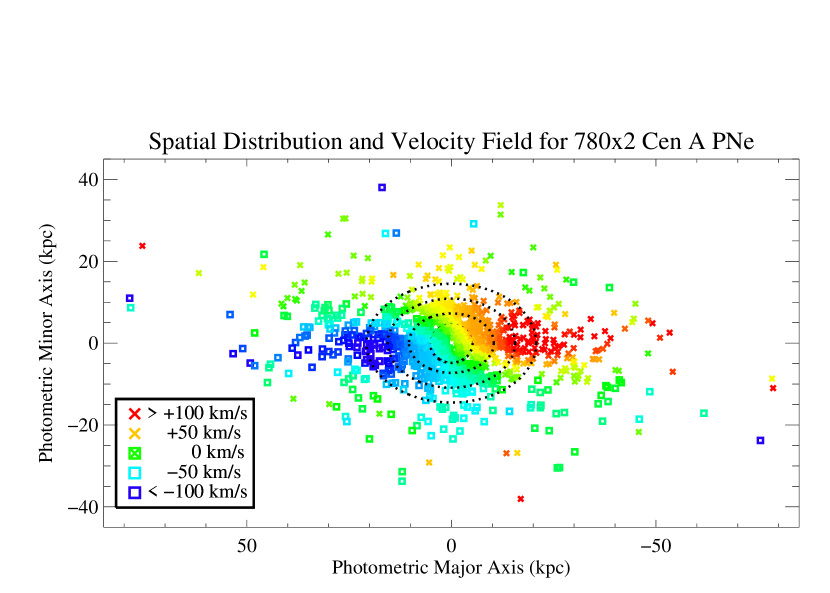
In Figure 3, we show our raw PN velocity field. We plot in coordinates centered on NGC 5128, where the X-axis is the photometric major axis (positive is northeast), and the Y-axis is the photometric minor axis (positive is northwest). Dotted ellipses trace the rough isophotes for NGC 5128 from 1–4 . These conventions are the same as those used in H95. As in Figure 2, the solid line traces the outer boundary of our survey area. Each point represents the location and radial velocity of a single PN. PNe with velocities larger than systemic (receding) are represented by crosses, and those with velocities smaller than systemic (approaching) are represented by open boxes. The color of each point shows the magnitude of the velocity with respect to systemic. Despite the large velocity dispersion, the bulk rotation along the major axis described by H95 clearly extends farther into the halo.
Previous work with discrete velocity tracers, such as PNe or globular clusters, use a variety of techniques to extract bulk kinematics. The size of the sample usually dictate the methods used. For small samples, it is often beneficial to assume a reasonable parametric model, such as solid-body rotation or a flat rotation curve. In cases where there are sufficient numbers of test particles, some have used non-parametric methods to avoid a priori assumptions of the form of the mean velocity field. For example, Merritt, Meylan & Mayor (1997) used the method of thin plate smoothing splines in conjunction with generalized cross-validation and penalized likelihood techniques to recover the velocity distribution of stars in the Galactic globular cluster Centauri. In NGC 1316, Arnaboldi et al. (1998) used a similar technique and compared their results from those derived from parametric estimates. As data sets continue to grow in size, non-parametric techniques are likely to become more common.
We chose to represent NGC 5128’s kinematics by estimating line-of-sight velocity moments as a function of position with a non-parametric smoothing algorithm. At the position of each PN, we applied a local linear smoother using a bivariate Gaussian kernel function, , with bandwidth (which is for a Gaussian kernel). This estimator has the advantage of being relatively simple and computationally fast. Like all smoothers, it requires that we make decisions regarding both the order of the approximation and the smoothing scale. In the general case of local polynomial smoothers, we need to choose the order of the polynomial. We used a linear smoother, as there was little reason to use higher order polynomial smoothers given the high intrinsic stellar velocity dispersion. Next, it is important that a smoothing scale is chosen that best matches the data. Small bandwidths for sparsely sampled data do not smooth over the dispersion in the velocity field, while large bandwidths in rapidly varying regions may wash out real features. Bandwidths can also be allowed to vary as a function of local density. Keeping these trade-offs in mind, we settled on a fixed bandwidth of kpc for our kernel. This smoothing scale was the smallest one that did not preserve noisy features in densely sampled regions. We also found that fixing the bandwidth did not result in a loss of information in the outer halo, and has the benefit of making the velocity field easier for readers to interpret. The final results are not strongly sensitive to the bandwidth size. However, for kpc, we lose resolution within 1 , a region where the velocity field shows interesting structure.
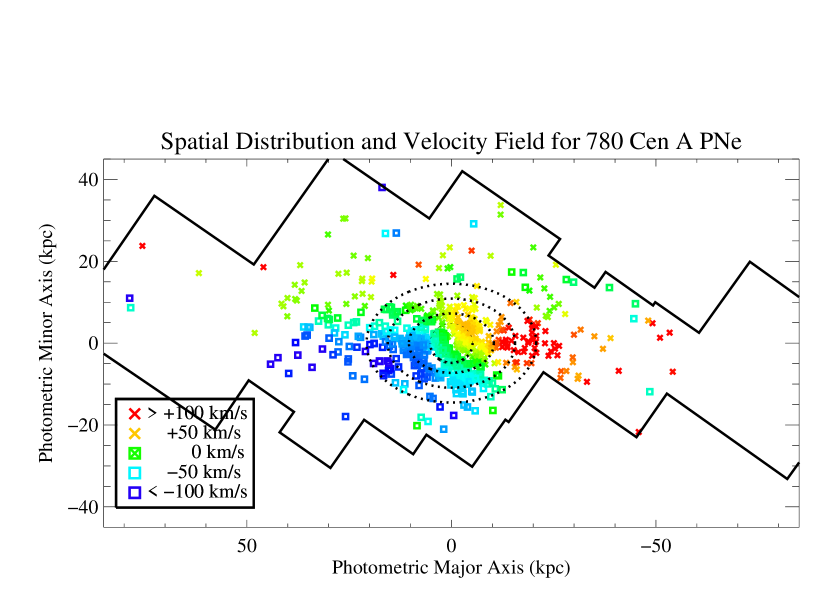
The resulting velocity field is shown in Figure 4, where each PN’s velocity has been replaced with , the estimate of the mean velocity field at that position. This smoothed velocity field shows much more clearly the bulk motion of the stars in NGC 5128. One can see the fast, disk-like rotation of stars along the major axis, as well as significant minor axis rotation.
Figure 4 also shows point symmetry in the velocity field — i.e. stars on opposite sides of the origin have opposite velocities with respect to the galaxy, . This symmetry is expected for triaxial potentials, and can be exploited to double the number of data points. We tested the validity of assuming point symmetry by calculating the correlation between the original and antisymmetric (reflected through the origin) velocity fields. We computed the Spearman rank-order correlation coefficient, which has a range of for perfectly anti-correlated samples to for perfectly correlated samples. Restricting ourselves to a region of NGC 5128 that is well-sampled, a kpc box with 724 PNe, we compute a correlation coefficient of 0.84. This rejects by the null hypothesis—that the reflected field is uncorrelated with the original.
Because of this symmetry, we can create a velocity field with 1560 velocities. This field contains both the original PNe as well as their reflected counterparts. The smoothed, antisymmetrized velocity field is shown in Figure 5. Two things are immediately apparent in this velocity field. First, the strong major axis rotation is reinforced, extending to at least 50 kpc, and maybe as far out as 80 kpc. There is also weaker but still significant rotation along the minor axis that extends as far as the data goes. Second, the line of zero-velocity is both misaligned and twisted with respect to the photometric axes. Both of these effects are expected when observing a triaxial system from certain viewing angles (Statler 1991).
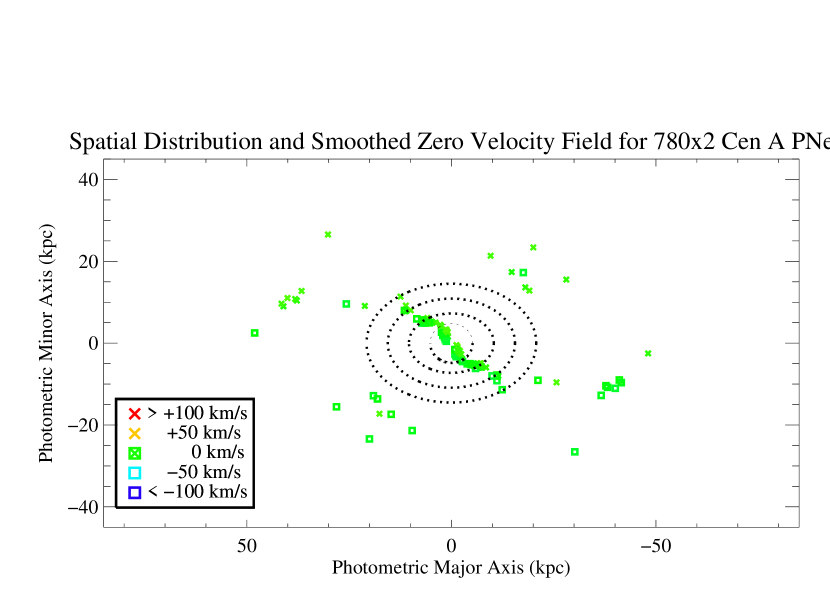
The twisting of the zero velocity contour (ZVC) is more evident in Figure 6, where we display only those positions that have velocities within km s-1 of zero. At the center of the galaxy, the ZVC is almost parallel to the minor axis. At a distance of 1 , however, it turns and follows a straight line at an angle of from the major axis. We parametrize the ZVC as
where and are in kpc. We then plot this curve on the full antisymmetrized velocity field in Figure 7. Notice how the velocity gradient is very sharp on the ZVC side of the major axis. The rapid major axis rotation only exists in a narrow region, within of the photometric major axis. The rest of the galaxy halo appears to be undergoing a slower minor axis rotation. This division even appears to be true in the outer halo at 80 kpc, where PNe are in close proximity to each other but straddle the ZVC and thus have markedly different velocities.

4.3. The PN Velocity Dispersion Field
We can also calculate the two-dimensional spatial dependence of the velocity dispersion, the second moment of the velocity distribution. We use the same local linear smoother described above except that the quantity in which we are interested is now . Calculating variance is always dependent on either model assumptions or smoothing scales and both parametric and non-parametric methods are prone to bias. Napolitano et al. (2001) point out that bilinear fits to a discrete sample of radial velocities can introduce bias in estimates of the velocity dispersion. This can be a problem in the sparsely sampled outer regions where a small smoothing scale can underestimate the dispersion, and over-smoothing can overestimate it.
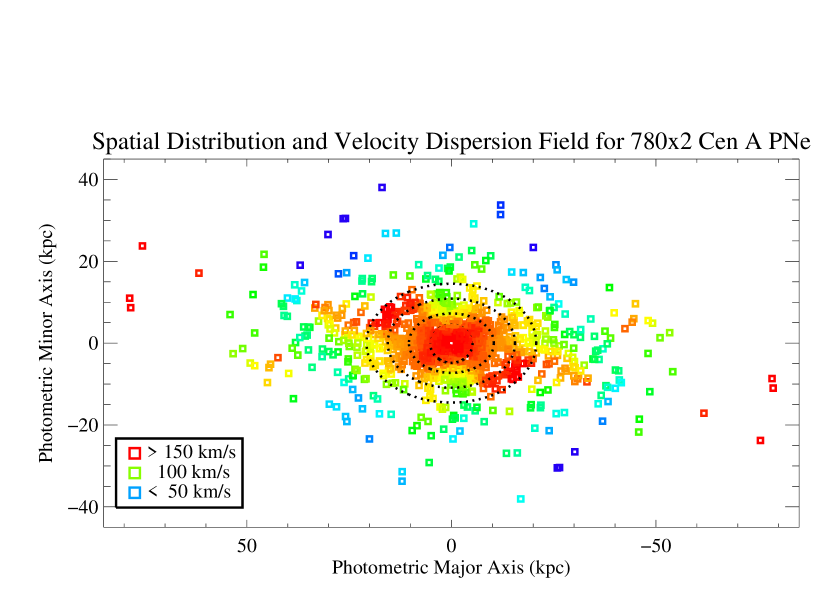
In Figure 8, we present our attempt at producing a velocity dispersion field for NGC 5128. This figure differs from previous ones in that we used a varying bandwidth kernel to partially compensate for the sparse sampling in the halo. We set the bandwidth to the larger of 3 kpc or the distance to the tenth nearest neighbor. While the estimated dispersions beyond are likely to be biased, we can still see real and interesting structure in the inner halo. The colors in Figure 8 correspond to the degree of pressure support, with red points being “hotter”. As one would expect for an elliptical galaxy, the center has a high velocity dispersion. The velocity dispersion stays high ( km s-1) then falls gradually along the major axis. Along the minor axis, the dispersion drops more rapidly. This agrees with the measurements of H95, who found that the velocity dispersion changed as a function of position angle with the highest dispersion being where the rotation was also highest.
4.4. Intrinsic Shape and Triaxiality
Observationally, two-dimensional velocity data in the halos of early-type galaxies are still rare. When such data sets exist, they are useful for comparing with models and simulations. In particular, we focus on the predicted velocity fields for triaxial galaxies and merger remnants.
Elliptical galaxies have long been suspected to be triaxial in shape (Binney 1978; Illingworth 1977). However, recovering their true axial ratios is difficult from imaging alone because we can only see their shapes projected onto the sky. Many have shown that mapping the two-dimensional velocity field gives additional leverage on this problem (e.g. Binney 1985; Wilkinson et al. 1986; Statler 1987). In an attempt to constrain the intrinsic shapes of elliptical galaxies, Statler (1991, S91) studied the morphology of projected velocity fields as a function of axial ratios and viewing angles. In a triaxial potential, stars can follow “tube” orbits about the long and short axes, or “box” orbits that have no net angular momentum (there are others, but we limit this discussion to these families). Intermediate ( ) axis tube orbits, however, are not stable. As a result, the distribution of -tube and -tube orbits, in conjunction with the viewing angle, determine the shape of the velocity field.
For certain viewing angles, both kinematic misalignment and kinks in the zero-velocity contour will result. Examples of this are shown in S91’s Figure 3. Some of these velocity fields are qualitatively similar to the NGC 5128 field in Figure 7. While this particular model is not necessarily the best for comparing with NGC 5128—S91 used more extreme axial ratios to emphasize the effect—it is a nice illustration of how the ZVC can change with viewing angle in a triaxial galaxy.
H95 combined PNe kinematics with the orientation of the dust lane to constrain the orientation and axial ratios of NGC 5128. By assuming that the inner portion of the central gas disk has settled and lies in the plane perpendicular to the long axis, they were able to determine that we are viewing NGC 5128 nearly along the intermediate axis. Conveniently, this means that the photometric major axis corresponds to the intrinsic long axis, and the photometric minor axis corresponds to the intrinsic short axis. The viewing angle that they derived was and .
Like in S91, is defined as the angle of the line of sight from the -axis. Since we are supposedly looking down a line-of-sight (LOS) that is in the plane, this value is . A possible point of confusion is that Hui and Statler define differently. Hui defines it as the angle in the plane of the LOS from the long -axis, while Statler defines it as the angle from the -axis. The result is that is equivalent to . This same LOS can equivalently be described as and .
With fewer PNe, H95 measured a single kinematic axis in NGC 5128 that was misaligned by from the photometric minor axis. As a result, Mathieu, Dejonghe, & Hui (1996) classified the morphology of the velocity field as “Nn” — a normal, single maximum/minimum velocity field with a normal core whose outer ZVC deviates from the core ZVC by less than . With our larger catalog and denser sampling, we see that the ZVC does in fact deviate significantly in the core. Hence, we reclassify NGC 5128’s velocity field as “Dd”, i.e. one with two peaks in velocity (seen in this case along the major and minor axes) and a kinematically distinct core. This is consistent with S91’s statement that D-type fields and d-type cores are most favored when the view is down the -axis.
The non-linearity of the ZVC also affects H95’s determination of NGC 5128’s axial ratios. If , , and correspond to the long, intermediate, and short axes, and the axial ratios are defined as and , then the triaxiality of a galaxy can be parameterized as
| (1) |
(S91). is equal to 0 for an oblate spheroid and 1 for a prolate spheroid. The axial ratios can then be expressed as
| (2) |
| (3) |
where is the observed (projected) axial ratio, and which we take to be 0.8 (H95).
The asymptotic position angle of the ZVC with respect to the intrinsic short axis, which in the case of NGC 5128 is the photometric minor axis, depends on the degree of triaxiality as (S91). Because H95 had a smaller sample of PNe in a smaller area, they determined that this angle was . However, as we have seen from Section 4.2, this angle is actually closer to . Using this new value, we obtain , a value that is significantly more prolate than the derived by H95. Given the previous values for the viewing angles, we obtain axial ratios . While the value of is almost identical to H95’s, our value for is smaller than H95’s value of 0.92.
Whereas H95 found NGC 5128 to be slightly oblate and significantly triaxial, we find that the shape of NGC 5128 is very nearly prolate. Statler’s velocity field classifications (his Figure 6), however, show that a galaxy this prolate is unlikely to show a “Dd” velocity field from this viewing angle. This discrepancy could arise because of uncertainty in the angle of the ZVC. Nevertheless, this clearly shows the importance of measuring the velocity field well into the halo. Only the dense sampling and large spatial extent of our survey showed the more precise asymptotic angle of the ZVC. Of course, this treatment assumes a certain degree of symmetry and dynamical relaxation. While we find that the velocity field is quite symmetric, the outer isophotes of NGC 5128 still show the effects of non-equilibrium motions that must have been caused by recent interactions. Merger simulations might help shed more light on the intrinsic shape of the potential, and whether figure rotation might be necessary to reproduce the observed kinematics.
4.5. Mass Estimates
One of the major advantages of using discrete velocity tracers such as PNe is that they are detectable at very large radii. Because we can only constrain the mass within our most distant test particle, getting kinematic information in the halos of galaxies is essential for determining their total mass. Total masses of elliptical galaxies have been estimated dynamically using spectral absorption-line profiles (e.g. Gerhard et al. 2001, Graham et al. 1999), PNe (e.g. H95, Ciardullo et al. 1993), globular clusters (e.g. Côté et al. 2001, Romanowsky & Kochanek 2001, Côté et al. 2003), hot X-ray gas (Forman, Jones, & Tucker 1985), weak gravitational lensing (McKay et al. 2002), as well as combinations of these techniques. For the most part, these observations support the existence of substantial dark matter halos around ellipticals, with the exact nature of the outer regions a function of environment. Since gravity dominates most formation processes, we expect that many properties of galaxies should scale with their total gravitational mass. Therefore, it is important to measure the total masses of nearby galaxies, where the data is obtainable. Using the smaller sample of PNe, H95 estimated the mass of NGC 5128 within 25 kpc to be with a mass-to- ratio of 10. We use the PNe in NGC 5128 to estimate its total dynamical mass within 80 kpc and compare this to previous work.
Dynamical mass estimation in pressure-supported systems such as elliptical galaxies is more complicated than for disk galaxies. With only two dimensions of spatial information, and one dimension of velocity data, assumptions about the symmetry of the galaxy and the isotropy of the velocity ellipsoid are necessary. One of the more convenient family of mass estimators uses the weighted mean of where is the line of sight velocity and is the projected radius. The exact weighting factor depends on the assumptions the various estimators make. Variants on this theme include the virial mass estimator, the projected mass estimator (Heisler, Tremaine, & Bahcall 1985), and the tracer mass estimator (TME) by Evans et al. (2003). The latter is designed for the use of a “tracer” population, such as PNe or globular clusters, whose spatial distribution does not match the overall mass distribution. Simulations show that this estimator does at least as well as the other estimators, and has significantly less bias. Given these well-suited properties, we chose to use the tracer mass estimator.
For this mass estimator, the mass enclosed within the outermost tracer particle is
where
the form of gravitational force field is , and the space density of tracer particles goes as . This mass estimate is only for pressure support, so the contribution from rotation must be added separately.
We estimate using the surface density of PNe in circular annular bins, shown in Figure 9. The inner 5 kpc shows the effects of incompleteness, and the drop off at large radii is likely due to the increased diskiness of the isophotes. However, the PNe between projected radii of 5 and 40 kpc nicely follow a power law with . In addition, we assume an isothermal potential () and an isotropic velocity distribution. These are both shown to be reasonable assumptions for halo velocity tracers in nearby galaxies, e.g. M 31 (Evans et al. 2003), M 87 (Côté et al. 2001), and M 49 (Côté et al. 2003).

The TME only calculates the contribution of random motions to the mass. As we have shown, the stars in NGC 5128 have a large rotational component that must be included. This contribution is separable in the Jeans equation and is simply , where is the mean rotation speed. We take to be 100 km s-1 since this is where the PN rotation curve flattens. The rotation of the PNe will be discussed more extensively in the following section.
The total dynamical mass of NGC 5128 within 80 kpc, as estimated by the tracer mass estimator, is . The error in this estimate is purely statistical and was derived using the bootstrap with 1000 resamplings. Assuming that the stellar component of NGC 5128 has a -band luminosity of (H95), we get .
For self-consistency, we compare masses from the TME with previously derived values. When we use only the PNe available to H95, we derive a mass within 25 kpc of , a value in close agreement with the mass of derived in H95 using the spherical Jeans equation, and that of estimated in Mathieu, Dejonghe, & Hui (1996) using the QP technique.
4.6. The Extended Stellar Disk
The presence of an extended stellar disk along the major axis allows us to make some useful simplifications. As did H95, we treat this major axis sample as a thick, rotating disk in a spherical potential. Although we have evidence that NGC 5128’s potential is likely triaxial in shape, the approximation of spherical symmetry in this case is not likely to introduce egregiously large biases because NGC 5128 is not very triaxial. In fact, when Mathieu et al. (1996) modeled NGC 5128 using triaxial Stäckel potentials, their mass estimate was statistically indistinguishable from the value obtained from the spherical Jeans equation.

In Figure 10, we show the rotation curve and line-of-sight velocity dispersion profile for PNe along the major axis. PNe were included in this sample if they had a perpendicular distance from the major axis of or were within a cone about the major axis with respect to the origin. The first criterion is the same as for H95, and the latter was added so that more PNe from the outer regions could be included. The PNe on one side were reflected through the origin to create a single radial profile for 302 PNe. The points with error bars in Figure 10 are the binned values as a function of radius. These values are listed in Table 8. We also kernel smoothed the entire data set with a variable-width gaussian, with the width inversely proportional to the local density of PNe. The errors in and are equal to and , respectively.
| (kpc) | km s-1 | km s-1 |
|---|---|---|
| 1.4 | ||
| 2.2 | ||
| 2.7 | ||
| 3.7 | ||
| 5.3 | ||
| 7.9 | ||
| 11.5 | ||
| 17.6 | ||
| 24.0 | ||
| 34.4 | ||
| 50.6 | ||
| 78.5 |
Figure 10a shows that the rotation velocity of major axis PNe rises until 10 kpc, at which point it stays flat at km s-1. This behavior was seen out to 25 kpc in H95, and appears to be constant out to the limits of our data. The velocity dispersion has a central value of km s-1, consistent with absorption line spectroscopy (Wilkinson et al. 1986), and slowly declines to km s-1 at 50 kpc. Outside of 20 kpc, the ratio between rotational and pressure support, is between 1 and 1.5.
4.7. Mass Estimation with the Jeans Equation
Following the methods of H95, we apply the spherical Jeans equation to the major axis rotation and line-of-sight velocity dispersion profile to derive the dynamical mass distribution in NGC 5128. Briefly, the Jeans equation for a spherical, isotropic stellar system is
| (4) |
which, when solved for the velocity dispersion is
| (5) |

Another assumption we must make is the form of the mass model. We adopt a two-component mass model for the luminous and dark matter in the galaxy. Like H95, we choose the Hernquist (1990) mass model for the luminous component, which has the form
| (6) |
where is the total luminous mass, and is the scale length and relates to the effective radius of the familiar de Vaucouleurs law as .
For the dark component, we assume three different mass models: the Hernquist mass profile, a pseudo-isothermal halo with a core, and the mass profile from Navarro, Frenk, & White (1996, 1997, NFW). The density profile of the isothermal halo has the form
| (7) |
where is the central density, and is the scale length. Correspondingly, the cumulative mass profile is
| (8) |
The NFW density and mass profiles take the forms
| (9) |
| (10) |
where , is the scale radius at which the slope of the profile transitions to the regime, and is the density at . Thus, the total mass model is
| (11) |
where is the luminous mass of the galaxy which is allowed to vary, is the scale length which is fixed from the galaxy surface photometry, and is one of the three mass models described above.
We also parametrize the intrinsic (three-dimensional) rotation curve as
| (12) |
which asymptotically approaches the value of as . We numerically integrate these functions over the line-of-sight to obtain the projected rotation, surface mass profile, and line-of-sight velocity dispersion profile.
In the fitting procedure, we first fit for and from the rotation curve data. Then, we solve for the best fit luminous and dark mass parameters given the projected velocity dispersion profile data. For the luminous component, we assume and fix kpc (Dufour et al. 1979). The three free parameters in the mass model are then , a dark matter scale length (, , ), and a mass or density scale (, , ).
| Model | Scale Mass/Density | Scale Radius | ||||
|---|---|---|---|---|---|---|
| (1) | (2) | (3) | (4) | (5) | (6) | (7) |
| Isothermal | 0.0243 | 4.5 | 3.8 | 15 | ||
| NFW | 0.010 | 14.4 | 3.4 | 13 | ||
| Hernquist | 31.7 | 3.5 | 12 | |||
| 11footnotetext: Dark Matter halo model 22footnotetext: Total luminous mass () 33footnotetext: for isothermal (), for NFW (), for Hernquist () 44footnotetext: , , and , in kpc 55footnotetext: Total mass within 80 kpc 66footnotetext: Mass-to-light of luminous matter 77footnotetext: Total mass-to-light within 80 kpc |
Figure 11 shows the best-fit rotation curve and dispersion profiles. The best-fit parameters for the rotation curve are km s-1and kpc. In these plots and fits, we also include binned long-slit spectroscopic kinematic data from Wilkinson et al. (1986) at distances within . These data fill a region in which there are few PNe due to the high background and large extinction toward the center of the galaxy.
We show the results from our model fits in Table 9 and in the velocity dispersion plot of Figure 11. All three mass models give equally acceptable fits to the data. At small radii, the isothermal halo has a core while the other models have cusps. At large radii, the isothermal halo falls off as , the NFW as , and the Hernquist profile as . This behavior is reflected in the fitted parameters, where the isothermal halo requires a larger luminous mass, smaller scale length, and gives the largest total mass. The NFW and Hernquist profiles are similar, except that the Hernquist model requires a larger scale length because of its steeper falloff at large radii. For the NFW halo, we also calculate the concentration parameter, , where is the “virial radius”, defined to be the radius inside of which the average density is 200 times the critical density. The halo concentration for our best-fit NFW halo model is , which is consistent with values obtained from simulations (NFW 1997).
While comparisons between these three density profiles is an interesting exercise, we are not able to use our data to differentiate between them. It may in principle be possible to rule out one or more with much higher quality data at large radii, but the lack of kinematic tracers, and various degeneracies with orbital anisotropy and the assumed light distribution make the task difficult.
All three models give total masses within 80 kpc of 5–6, with 12–15. The parameters determined for the Hernquist dark halo are not significantly different from those determined in H95 using only PNe within 25 kpc. Moreover, these values are in good agreement with those obtained with the tracer mass estimator.
An interesting check on these mass estimates is to see how many PNe, if any, would be unbound from the galaxy given the estimated mass profile. In Figure 12, we plot the radial velocity of each PN versus its projected radius. The overplotted solid lines mark the escape velocity at that true radius given the best-fit two-component Hernquist mass model. The escape velocity takes the form
| (13) |
The dotted lines mark the escape velocity if there is no dark matter. Many PNe are not bound to the galaxy if there is no dark matter (however, this is only obvious if the PN sample extends beyond 10 kpc). This shows once again that a dark component is necessary to explain the stellar velocity distribution.
All the PNe, even the outermost ones, are bound by our best-fit mass model. Although it is true that since we make the assumption of equilibrium, most of the PNe should appear bound, this does not preclude any one PN from having . It is of interest that the most distant stars in NGC 5128 have velocities that are still consistent with being bound to the galaxy. This would not necessarily be the case for galaxies in a cluster environment. Intracluster PNe have been identified in the Virgo and Fornax clusters, and have velocities that trace the cluster potential (Arnaboldi et al. 2002). An increase in could also be caused by a recent tidal interaction with a neighbor. The fact that NGC 5128 is in a loose group of galaxies with a lack of any nearby neighbors may help explain why these most distant PNe have very regular velocities.

5. Discussion
5.1. Comparison to Merger Simulations
N-body simulations of disk-disk mergers suggest that spheroidal stellar populations may be the result of one or more mergers. Moreover, Barnes (1992) showed that many simulated merger remnants have misaligned kinematic axes. Recent simulations are producing two-dimensional velocity fields that are useful comparisons for our data. In particular, we refer to the work of Bendo & Barnes (2000) and Naab & Burkert (2001).
Both of these groups simulated the mergers of two stellar disk/bulge systems with different mass ratios and angular momentum vectors at varying angles. It is important to note that these studies did not include gas dynamics or star formation, so cannot reproduce a remnant such as NGC 5128 in detail. However, the general trends in stellar kinematics are useful baselines for comparison. They tested two families of mergers—“equal-mass” (1:1) and “unequal-mass” (3:1). All merger remnants have masses of 3–5, values which are comparable to the total mass of NGC 5128. Equal-mass mergers tend to produce a wide variety of kinematic properties, often disrupting many of the initial characteristics of the progenitor galaxies. Unequal-mass mergers tend to preserve the disk of the larger galaxy, and hence will more consistently have rotational support.
All kinds of mergers can produce the types of velocity field morphology we see in NGC 5128. These simulations show that the projected velocity contours can kink, much like those in Statler’s triaxial galaxies, and in our observed velocity field. The remnant’s final kinematics will be the result of the initial angular momentum (both rotational and orbital) of the progenitor galaxies, and the shape of the final potential.
The properties of NGC 5128 are similar to some aspects of both types of mergers. It is important to keep in mind that even if we were certain that NGC 5128 was the product of a disk-disk merger, it would be extremely difficult to uniquely constrain the exact parameters of the merger that occurred. Given the diskiness of the outer isophotes in NGC 5128, and the rapid rotation along the major axis, it is possible that NGC 5128 is the result of an unequal-mass disk-disk merger. On the other hand, the severe misalignment of the kinematic axis in the halo is more typical of 1:1 mergers. Naab & Burkert (2001) use simulations to show that even these 1:1 remnants may contain a disk component, although these simulated disks are much smaller in size than the one observed in NGC 5128. An interesting note is that the 3:1 simulated merger remnants in Bendo & Barnes (2000) with kinematic properties most like the 1:1 merger remnants were also the most prolate. These prolate remnants also showed a relatively large population of X-tube orbits, and these may be responsible for the twist in the ZVC. Thus, in the simplest comparison that we can make with these simulations, the morphology and kinematics of NGC 5128 are broadly consistent with the remnant of an unequal-mass merger.
Two-dimensional velocity fields have the potential to tell us much more about the structure and formation of ellipticals if the corresponding models and simulations are available. Simulations that also include gas dissipation and star formation would be especially useful. Ongoing surveys such as SAURON and the PN spectrograph promise to accumulate a wealth of data in the coming years.
5.2. Mass-to-Light
By assuming isotropy, we derive a mass within 80 kpc of , which gives a mass-to-light ratio of . We can also compare this mass to the total K-band luminosity, which should be a better measure of the old stellar population of the galaxy. Recently, the Two Micron All Sky Survey (2MASS) imaged and measured photometry for NGC 5128 in their Large Galaxy Atlas (Jarrett et al. 2003). They measured an apparent total magnitude of , which translates to , a value slightly brighter than for the –band galaxy luminosity function (Kochanek et al. 2001). This gives a -band luminosity of and a mass-to-light ratio of .
The reader must be warned that mass estimates are fraught with systematic uncertainties due to the many assumptions made. For instance, we have assumed that the surface radial distribution of stars continues as either a power law, de Vaucouleurs law, or Hernquist profile even at very large radii. Given the extremely low surface brightness of the integrated stellar light, and the small number of PNe at these distances (we detect 4 PNe beyond 60 kpc), it is currently extremely difficult to accurately constrain the density profile at these radii. However, the amount of light in these regions is negligible for the purposes of determining the total luminosity of the galaxy. Likewise, the abundance of two-dimensional velocity data behooves us to eventually model the mass distribution with non-spherical geometries. In this case, we are fortunate that the unique, nearly edge-on disk-like component in NGC 5128 works in our favor by simplifying the geometry of the tracer PNe in the halo. What we can see is that the stars in NGC 5128 do exist in detectable numbers at distances as great as 80 kpc (at least in one direction), and that their velocities are fairly well-behaved, extending the flat rotation profile seen in the inner halo.
Although dark matter is required to explain the observed stellar kinematics in NGC 5128, our value for is noticeably low when compared to those determined for ellipticals using X-ray halos and satellite kinematics. This is interesting, especially in light of recent results from the PN spectrograph group that report low mass-to-light ratios for ellipticals within 5 (Romanowsky et al. 2003). Bahcall, Lubin, & Dorman (1995) compiled the values of for galaxies in the literature and found that they are closer to for ellipticals and for spirals. If we assume and calculate for kpc, then these are lowered somewhat to values of and , but both are still larger than what we are measuring by over . H95 also remarked that the dynamical mass they measured within 25 kpc was systematically lower than that measure by Forman, Jones, & Tucker (1985) from ROSAT data. van Gorkom et al. (1990) reached a similar conclusion when comparing H I dynamical mass estimates with the X-ray estimates. However, Kraft et al. (2003) recently used Chandra and XMM data to measure the total gravitating mass with 15 kpc and determined a value of , which is statistically indistinguishable from the values we obtain from our mass models within the same radius. This independent mass determination implies that our assumptions of orbital isotropy and a high inclination for the stellar disk are not likely to be grossly wrong, at least within 15 kpc.
Could it be possible that NGC 5128 appears brighter than expected, either because of an error in measurement or because it is young? Using our value of the gravitating mass, NGC 5128 would have to be over two magnitudes fainter than what Dufour et al. (1979) measured in order for to be at the level of 80–100. One potential culprit is that the obscuring dust lane makes extrapolation toward the central regions essential for obtaining a magnitude that one can compare with other galaxies. Hence, there will always be a larger than normal uncertainty in the galaxy’s measured luminosity, although this is less true for infrared wavelengths. However, we think it is unlikely that such a large error was made. Could NGC 5128 be intrinsically brighter than most ellipticals because it is young? Using the 2001 release of the Bruzual & Charlot (1993) evolutionary synthesis models, we find that for solar metallicity, the mean age of the “old” component of NGC 5128 (excluding the dust lane region) would need to have an age of 2 Gyr in order to be two magnitudes brighter than a similarly enriched 12 Gyr old population. While there is growing evidence that some fraction of the stars in NGC 5128 formed in a secondary event (e.g. Rejkuba 2003), it is unlikely the entire galaxy could be this young, especially since some globular clusters in the galaxy that are at least 10 Gyr old (discussed in Peng, Ford, & Freeman 2004c). Additionally, color-magnitude diagram studies of the red giant population in the halo show no evidence for a dominant young component (Harris & Harris 2002).
5.3. Comparison with Other Ellipticals
While some of the most massive ellipticals can have central velocity dispersions of km s-1, NGC 5128 has a more intermediate value for its central velocity dispersion with km s-1. Likewise, with absolute magnitudes of and , NGC 5128 has an typical luminosity for early-type galaxies. The measured amount of total luminous mass is , and its stellar mass-to-light ratio is . These properties of NGC 5128’s stellar component all are what one would expect for a typical elliptical galaxy, so there is little reason to suspect that its dark halo should be less massive than in other galaxies. While it is possible that our assumption of isotropy for the stellar orbits is incorrect, fully radial orbits (which maximizes the discrepancy) might increase the total by a factor of two, but not a factor of ten.
Could the low value for be explained by the luminous component rather than the total mass (i.e. by the stellar population rather than the dark matter)? If so, then this should be evident in the colors of the galaxy. How do the mean integrated optical colors of NGC 5128 compare to those of other, perhaps less morphologically disturbed ellipticals? We compare the – color of NGC 5128 to those of Virgo and Coma elliptical galaxies using photometry from Bower, Lucey, & Ellis (1992). The colors of ellipticals are known to correlate with galaxy properties such as velocity dispersion, surface brightness, and luminosity so it is important to compare physically similar galaxies. We plot the color-velocity dispersion relation for these galaxies and for NGC 5128, because the velocity dispersion for NGC 5128 is well-measured with a value of 150 km s-1 (Wilkinson et al. 1986, H95). We have obtained our own measure of the colors of NGC 5128 using CCD photometry of the galaxy introduced in Peng et al. (2002), and further described in Peng, Ford, & Freeman (2004b). We deredden our measured colors assuming (Schlegel, Finkbeiner, & Davis 1998) to obtain . These results are plotted in Figure 13. We also plot the significantly bluer measurement for NGC 5128 of van den Bergh (1976, vdB76).

The difference between our measurement and the value from vdB76 underline the importance of aperture effects. vdB76 measured the color of the galaxy out to a radius of , a region that is still affected by the young stars in the dust lane. vdB76 notes that the color of the galaxy becomes bluer as one measures regions closer to the nucleus. We chose to generously mask the dust lane to avoid any light from obviously recent star formation. Our measurement is for a region 2–10 arc minutes along the major axis, and 5–10 arc minutes along the minor axis. It is not surprising that our measured color is redder than that measured by vdB76.
In Figure 13, we also see that NGC 5128 is fairly blue for its velocity dispersion compared to Virgo and Coma ellipticals. Even our redder measurement falls below the color-velocity dispersion relation. One could argue that this may also be an aperture effect. Elliptical galaxies are known to have metallicity (and hence, color) gradients. The aperture through which Bower et al. measured their photometry has a radius of kpc, which is 1.75 kpc for . Measurements through an aperture of this size for NGC 5128 would be dominated by the dust lane and its associated star formation. If we assume, however, that NGC 5128 does have an obscured, redder stellar population comparable to those in the cluster ellipticals, we can make some assumptions on the nature of the color gradient and estimate what its color would be. Franx & Illingworth (1990) measured the mean – color gradient in ellipticals to be mag per decade of radius. Since most of this is due to the change in (U B), we assume this value as an upper limit on the gradient in (–). The mean radius at which we measure our color is kpc. If we assume that the mean radius of the Bower et al. measurements are kpc, then the maximum expected color difference between our values would be 0.18 mag. Adding this value to our (–)0 color, for a value of 1.46, does in fact bring NGC 5128 to the mean of the color-velocity dispersion relation. The major problem with this extrapolation is that we do not see color gradients in NGC 5128 of this magnitude, although our measurements are still preliminary. So, while we measure the color of the “old” stellar light in NGC 5128 to be significantly bluer than the central regions of local ellipticals at the same velocity dispersion, we will need to do further work on color gradients to determine whether this is because these galaxies are intrinsically different, or because the apertures of the measurements are different.
If the colors are intrinsically different, this could be another clue that there exists an intermediate-age component in the galaxy. A recent star-formation event of only 10% by mass can significantly change the optical colors of otherwise old stellar populations. However, a difference of only 0.12 mag between NGC 5128 and the mean Virgo-Coma relation cannot account for the difference in age of 10 Gyr needed to make up the “deficit”.
We can compare this mass-to-light value with the work of Romanowsky et al. (2003), who recently reported that the three ellipticals in their study are not dominated by dark matter within 5 . For NGC 3379, they find that the ratio of dark matter to total mass within 5 (9 kpc) is less than 0.32. The situation in NGC 5128 is not very different. For NGC 5128, this ratio within 9 kpc is 0.26, within 5 is 0.55, and within 80 kpc is 0.73. So, we find that the transition from luminous- to dark matter-dominated enclosed mass occurs at approximately 5 .
It is possible that much of the dark matter is beyond 80 kpc, and thus not detected by our kinematic tracers. NGC 5128 looks to be the product of an unusual merger — systems with such extended disks are somewhat unique. It may be that the merger parameters which led to such an extended disk also led to the dark halo being even more extended. If that is true, the mass measured by the PNe and GC, and also by the X-ray data, would not include much of the dark matter. However, what is perhaps a bit puzzling is that the dark matter models that we fit to the current data do not require a low concentration, which might be expected if the dark halo was very diffuse.
6. Summary
We extended the original PN survey of H95 by surveying three times farther into the halo. There are now 1141 known PNe in NGC 5128, of which 780 are confirmed with radial velocities. Many of these new PNe are at projected distances beyond 20 kpc.
Despite the disturbed appearance of NGC 5128 in optical images, the velocity field of the PNe is very regular. The point symmetry of the potential is evidenced in the velocity field. There is a high degree of rotation along the major axis that coincides with a faint stellar disk. Beyond 20 kpc, this disk has a flat rotation curve at a velocity of 100 km s-1. There also exists significant minor axis rotation, resulting in a well-defined twist in the line of zero velocity. This “S”-shaped zero velocity contour is characteristic of triaxial potentials and merger remnants.
Using this larger sample of PNe, we re-derive the intrinsic axial ratios of NGC 5128 and find that the galaxy may be nearly prolate, with axial ratios . This is in contrast to the more oblate shape derived by H95. However, this estimate is at odds with other model predictions which require a more triaxial shape, and merits further study. We also find that the kinematics are consistent with simulated disk-disk merger remnants, and could perhaps be the result of one with a 3:1 mass ratio.
The entire PN sample is used to estimate the dynamical mass of the galaxy using the tracer mass estimator. We also use the kinematics of the major axis stellar disk to derive a mass from the spherical Jeans equation. The rotation curve is flat out to the limit of our data while the velocity dispersion profile falls gradually. Taken together, the TME and our best-fit Hernquist, isothermal halo, and NFW models give an average mass within 80 kpc of , and . These models produce masses that agree with determinations from the latest X-ray data. As H95 showed, dark matter is necessary to fit the velocity distribution of PNe beyond kpc.
The mass-to-light ratio of NGC 5128 is found to be abnormally low when compared to those determined for other ellipticals. It is unlikely that this difference is either due to an incorrect measurement of the galaxy light, or because the galaxy is extremely young. It may be that the dark matter halo is very extended, and that a large fraction is beyond 80 kpc. We defer further discussion of the formation of NGC 5128 to a future paper (Peng, Ford, & Freeman 2004c), in which we will compare these field star kinematics with those of the globular clusters.
References
- Arnaboldi et al. (1998) Arnaboldi, M., Freeman, K. C., Gerhard, O., Matthias, M., Kudritzki, R. P., Méndez, R. H., Capaccioli, M., & Ford, H. 1998, ApJ, 507, 759
- Arnaboldi et al. (2002) Arnaboldi, M. et al. 2002, AJ, 123, 760
- Bacon et al. (2001) Bacon, R. et al. 2001, MNRAS, 326, 23
- Bahcall, Lubin, & Dorman (1995) Bahcall, N. A., Lubin, L. M., & Dorman, V. 1995, ApJ, 447, L81
- Barnes (1992) Barnes, J. E. 1992, ApJ, 393, 484
- Bender, Saglia, & Gerhard (1994) Bender, R., Saglia, R. P., & Gerhard, O. E. 1994, MNRAS, 269, 785
- Bendo & Barnes (2000) Bendo, G. J. & Barnes, J. E. 2000, MNRAS, 316, 315
- Bertin & Arnouts (1996) Bertin, E. & Arnouts, S. 1996, A&AS, 117, 393
- Binney (1978) Binney, J. 1978, Comments on Modern Physics, Part C - Comments on Astrophysics, vol. 8, no. 2, 1978, p. 27-36., 8, 27
- Binney (1985) Binney, J. 1985, MNRAS, 212, 767
- Bower, Lucey, & Ellis (1992) Bower, R. G., Lucey, J. R., & Ellis, R. S. 1992, MNRAS, 254, 601
- Bruzual A. & Charlot (1993) Bruzual A., G. & Charlot, S. 1993, ApJ, 405, 538
- Ciardullo, Jacoby, & Dejonghe (1993) Ciardullo, R., Jacoby, G. H., & Dejonghe, H. B. 1993, ApJ, 414, 454
- Ciardullo et al. (2002) Ciardullo, R., Feldmeier, J. J., Krelove, K., Jacoby, G. H., & Gronwall, C. 2002, ApJ, 566, 784
- Côté et al. (2001) Côté, P. et al. 2001, ApJ, 559, 828
- Côté, McLaughlin, Cohen, & Blakeslee (2003) Côté, P., McLaughlin, D. E., Cohen, J. G., & Blakeslee, J. P. 2003, ApJ, 591, 850
- Douglas et al. (2002) Douglas, N. G. et al. 2002, PASP, 114, 1234
- Dufour et al. (1979) Dufour, R. J., Harvel, C. A., Martins, D. M., Schiffer, F. H., Talent, D. L., Wells, D. C., van den Bergh, S., & Talbot, R. J. 1979, AJ, 84, 284
- Evans, Wilkinson, Perrett, & Bridges (2003) Evans, N. W., Wilkinson, M. I., Perrett, K. M., & Bridges, T. J. 2003, ApJ, 583, 752
- Forman, Jones, & Tucker (1985) Forman, W., Jones, C., & Tucker, W. 1985, ApJ, 293, 102
- Franx, Illingworth, & Heckman (1989) Franx, M., Illingworth, G., & Heckman, T. 1989, ApJ, 344, 613
- Gerhard, Kronawitter, Saglia, & Bender (2001) Gerhard, O., Kronawitter, A., Saglia, R. P., & Bender, R. 2001, AJ, 121, 1936
- Graham et al. (1998) Graham, A. W., Colless, M. M., Busarello, G., Zaggia, S., & Longo, G. 1998, A&AS, 133, 325
- Harris & Harris (2002) Harris, W. E. & Harris, G. L. H. 2002, AJ, 123, 3108
- Heisler, Tremaine, & Bahcall (1985) Heisler, J., Tremaine, S., & Bahcall, J. N. 1985, ApJ, 298, 8
- Hernquist (1990) Hernquist, L. 1990, ApJ, 356, 359
- Hui, Ford, Ciardullo, & Jacoby (1993) Hui, X., Ford, H. C., Ciardullo, R., & Jacoby, G. H. 1993, ApJ, 414, 463 [H93a]
- Hui, Ford, Ciardullo, & Jacoby (1993) Hui, X., Ford, H. C., Ciardullo, R., & Jacoby, G. H. 1993, ApJS, 88, 423 [H93b]
- Hui, Ford, Freeman, & Dopita (1995) Hui, X., Ford, H. C., Freeman, K. C., & Dopita, M. A. 1995, ApJ, 449, 592 [H95]
- Illingworth (1977) Illingworth, G. 1977, ApJ, 218, L43
- Israel (1998) Israel, F. P. 1998, A&A Rev., 8, 237
- Jarrett et al. (2003) Jarrett, T. H., Chester, T., Cutri, R., Schneider, S. E., & Huchra, J. P. 2003, AJ, 125, 525
- Kochanek et al. (2001) Kochanek, C. S. et al. 2001, ApJ, 560, 566
- Kraft et al. (2003) Kraft, R. P., Vázquez, S. E., Forman, W. R., Jones, C., Murray, S. S., Hardcastle, M. J., Worrall, D. M., & Churazov, E. 2003, ApJ, 592, 129
- Kronawitter, Saglia, Gerhard, & Bender (2000) Kronawitter, A., Saglia, R. P., Gerhard, O., & Bender, R. 2000, A&AS, 144, 53
- Kudritzki et al. (2000) Kudritzki, R.-P. et al. 2000, ApJ, 536, 19
- Kunkel & Bradt (1971) Kunkel, W. E. & Bradt, H. V. 1971, ApJ, 170, L7
- Lasker et al. (1990) Lasker, B. M., Sturch, C. R., McLean, B. J., Russell, J. L., Jenkner, H., & Shara, M. M. 1990, AJ, 99, 2019
- Malin (1978) Malin, D. F. 1978, Nature, 276, 591
- Mathieu, Dejonghe, & Hui (1996) Mathieu, A., Dejonghe, H., & Hui, X. 1996, A&A, 309, 30
- McKay et al. (2002) McKay, T. A. et al. 2002, ApJ, 571, L85
- Méndez et al. (2001) Méndez, R. H., Riffeser, A., Kudritzki, R.-P., Matthias, M., Freeman, K. C., Arnaboldi, M., Capaccioli, M., & Gerhard, O. E. 2001, ApJ, 563, 135
- Merritt, Meylan, & Mayor (1997) Merritt, D., Meylan, G., & Mayor, M. 1997, AJ, 114, 1074
- Monet et al. (1998) Monet, D. B. A. et al. 1998, VizieR Online Data Catalog, I/252
- Naab & Burkert (2001) Naab, T. & Burkert, A. 2001, ApJ, 555, L91
- Napolitano, Arnaboldi, Freeman, & Capaccioli (2001) Napolitano, N. R., Arnaboldi, M., Freeman, K. C., & Capaccioli, M. 2001, A&A, 377, 784
- Navarro, Frenk, & White (1996) Navarro, J. F., Frenk, C. S., & White, S. D. M. 1996, ApJ, 462, 563
- Navarro, Frenk, & White (1997) Navarro, J. F., Frenk, C. S., & White, S. D. M. 1997, ApJ, 490, 493
- Peng, Ford, Freeman, & White (2002) Peng, E. W., Ford, H. C., Freeman, K. C., & White, R. L. 2002, AJ, 124, 3144
- Peng, Ford, & Freeman (2004b) Peng, E. W., Ford, H. C., & Freeman, K. C. 2004b, ApJS, 150, in press
- Peng, Ford, & Freeman (2004c) Peng, E. W., Ford, H. C., & Freeman, K. C. 2004c, ApJ, 602, in press
- Rejkuba et al. (2003) Rejkuba, M., Minniti, D., Silva, D. R., Bedding, T. R. 2003, å, in press (astro-ph/0309358)
- Romanowsky & Kochanek (2001) Romanowsky, A. J. & Kochanek, C. S. 2001, ApJ, 553, 722
- Romanowsky et al. (2002) Romanowsky, A. J., Douglas, N. G., Kuijken, K., Merrifield, M. R., Gerssen, J., Arnaboldi, M., & Freeman, K. C. 2002, Galaxy evolution, theory and observations.
- Romanowsky et al. (2003) Romanowsky, A. J., Douglas, N. G., Arnaboldi, M., Kuijken, K., Merrifield, M. R., Napolitano, N. R., Capaccioli, M., Freeman, K. C. 2003, Science, in press (astro-ph/0308518)
- Schlegel, Finkbeiner, & Davis (1998) Schlegel, D. J., Finkbeiner, D. P., & Davis, M. 1998, ApJ, 500, 525
- Statler (1987) Statler, T. S. 1987, ApJ, 321, 113
- Statler (1991) Statler, T. S. 1991, AJ, 102, 882
- van den Bergh (1976) van den Bergh, S. 1976, ApJ, 208, 673
- van Gorkom, van der Hulst, Haschick, & Tubbs (1990) van Gorkom, J. H., van der Hulst, J. M., Haschick, A. D., & Tubbs, A. D. 1990, AJ, 99, 1781
- Wilkinson, Sharples, Fosbury, & Wallace (1986) Wilkinson, A., Sharples, R. M., Fosbury, R. A. E., & Wallace, P. T. 1986, MNRAS, 218, 297