The Molecular Gas Distribution and Schmidt Law in M33
Abstract
The relationship between the star formation rate and surface density of neutral gas within the disk of M33 is examined with new imaging observations of 12CO J=1-0 emission gathered with the 14m telescope and images of the 60µm and 100µm emission. The Schmidt law, , is constructed using radial profiles of the HI 21cm, CO, and far infrared emission. A strong correlation is identified between the star formation rate and molecular gas surface density. This suggests that the condensation of giant molecular clouds is the limiting step to star formation within the M33 disk. The corresponding molecular Schmidt index, , is 1.360.08. The star formation rate has a steep dependence on total mass gas surface density, (), owing to the shallow radial profile of the atomic gas which dominates the total gas surface density for most radii. The disk pressure of the gas is shown to play a prominent role in regulating the molecular gas fraction in M33.
1 Introduction
The understanding of galaxy structure and evolution is ultimately linked to the understanding of the star formation process. Star formation within galaxies is commonly described by two relationships which are oversimplifications of complex interstellar processes taking place over a large range of spatial scales (Elmegreen 2002). The first is an empirical relationship between the star formation rate per unit area, , and gas mass surface density, ,
often referred to as the Schmidt law (Schmidt 1959; Kennicutt 1989; Wong & Blitz 2002). The value of the Schmidt index, , and its variation with galaxy type and environment provide valuable clues to the physical processes that regulate star formation in galaxies. The second relationship simply states that there is a critical gas surface density, , below which star formation is suppressed (Kennicutt 1989; Martin & Kennicutt 2001). Since stars form within the cold, dense, molecular gas phase of the interstellar medium, the critical surface density may simply reflect the necessary local conditions at which molecules are sufficiently self-shielded from dissociating UV radiation. However, several studies have shown that the critical surface density is dependent upon the galaxy rotation curve (Kennicutt 1989; Martin & Kennicutt 2001) and relate to the surface density, , which parameterizes the gravitational instability associated with the Coriolis force (Toomre 1964),
where is the sound speed and is the epicyclic frequency. Martin & Kennicutt (2001) demonstrate that provides an accurate gauge of the gas column density at which star formation is inhibited for most of the 32 galaxies in their sample.
Two galaxies in the sample of Martin & Kennicutt (2001) do not conform to the Toomre condition. M33 and NGC 2403 are small, low luminosity, low mass galaxies. Both systems are actively forming stars throughout their disks yet are sub-critical () over all radii (Kennicutt 1989; Martin & Kennicutt 2001). For both galaxies, this assessment is based upon limited imaging of the molecular gas component within the central region (Wilson & Scoville 1989; Thornley & Wilson 1995) or the major axis (Young et al. 1995). Using wide field imagery of CO emission presented in this study, Corbelli (2003) has confirmed the sub-critical nature of the M33 disk. Several studies have proposed that star formation in galaxies like M33, NGC 2403, and irregular galaxies with slowly rising rotation curves, may be regulated by gas instabilities modulated by the local shear rate (Hunter, Elmegreen, & Baker 1998; Martin& Kennicutt 2001; Corbelli 2003). The critical surface density may also be modulated by the additional gravity from either the stellar disk or the dark matter halo (Wang & Silk 1994; Hunter, Elmegreen, & Baker 1998; Corbelli 2003).
M33 is a nearby galaxy which shows no signs of interaction with other galaxies. Therefore, it constitutes an excellent laboratory to evaluate the degree to which physical processes regulate star formation in disk galaxies. In this paper we present the first, unbiased, filled aperture census of the molecular gas component in M33 from an imaging survey of CO emission with the FCRAO 14m telescope. A recent high resolution interferometric CO image of M33 is presented by Engargiola et al. (2003). The FCRAO data have been previously used to derive the radial distributions of molecular hydrogen, the rotation curve, and the gravitationally unstable region in the disk of M33 (Corbelli 2003). Here, we examine the relationship between the star formation rate and gas surface density as parameterized by equation (1). It is important to assess whether the star formation properties (Schmidt Law, star formation efficiency) in sub-critical galaxies like M33 are modified due to different modes and processes which enable the condensation of cold, dense clouds from the diffuse ISM. Moreover, as a low luminosity, molecular poor galaxy, M33 provides an important complement to the sample of CO-bright spiral galaxies used by Wong & Blitz (2002) to investigate the relationship between gas content and star formation.
In 2, the CO data collection, calibration, and processing procedures are described. The spatial distribution of the molecular gas is presented in 3. In 4, we derive the Schmidt law from HI, CO, and IRAS HiRes images and evaluate the role of pressure in regulating the molecular gas fraction.
2 FCRAO Observations
Observations of 12CO J=1-0 emission from M33 were obtained with the 14 meter telescope of the Five College Radio Astronomy Observatory (, full width at half maximum = 45″) in March 2000 and between October 2000 and March 2001 using the 16 element focal plane array receiver SEQUOIA. Typical system temperatures were 400 to 700 K. The backend was comprised of a set of 16 autocorrelation spectrometers operating at 80 MHz bandwidth with 378 kHz resolution sampled every 313 kHz. At the observing frequency of the 12CO line (115.2712 GHz), these spectral parameters correspond to a bandwidth of 208 km s-1 with a resolution of 0.98 km s-1 sampled at 0.81 km s-1. Since this bandwidth does not cover the kinematic extent of the galaxy, the velocity at which the spectrometer was centered varied along the major axis according to the HI rotation curve (Corbelli & Salucci 2000). For all observed positions within the field, the velocity shift due to rotation of M33 within the 6′ field of view of the SEQUOIA array is sufficiently small such that all molecular line emission is fully covered within the 80 MHz bandwidth with sufficient baseline window.
To image M33, the focal plane array was aligned along the major axis with a position angle of 22∘ (measured East of North) about the central J2000 coordinate, =01h 33m 50.89s, 30∘ 39′ 36.7′′. The data were taken on a 22.1″ grid which corresponds to near Nyquist sampling. Observations were taken in a position switching mode in which 4 consecutive source positions were shared with a single off-source position taken at the same elevation to ensure the most stable baselines. The spectra were calibrated every 20 to 30 minutes with a chopper wheel to switch between the sky and an ambient temperature. All reported intensities refer to main beam brightness temperature assuming a main beam efficiency of 0.45. In order to obtain more uniform noise across the image and to account for infrequent, inoperative pixels within the array, the footprints were staggered by half the size of the array along the major axis so that any position on the sky was observed by 2 or more pixels. Due to this staggering, the edges of the final image contain less integration time and therefore, increased noise levels with respect to the median rms value of the entire field. The images shown in §3 have been rotated back to the equatorial coordinate system, resampled to a 25″ grid and smoothed with a 22″ Gaussian kernel to achieve a final angular resolution of 50″. At this resolution the median sensitivity, defined here as the standard deviation of values within 1 km s-1 wide spectroscopic channels with no emission, is 0.053 K.
3 Results
3.1 Molecular Gas Distribution
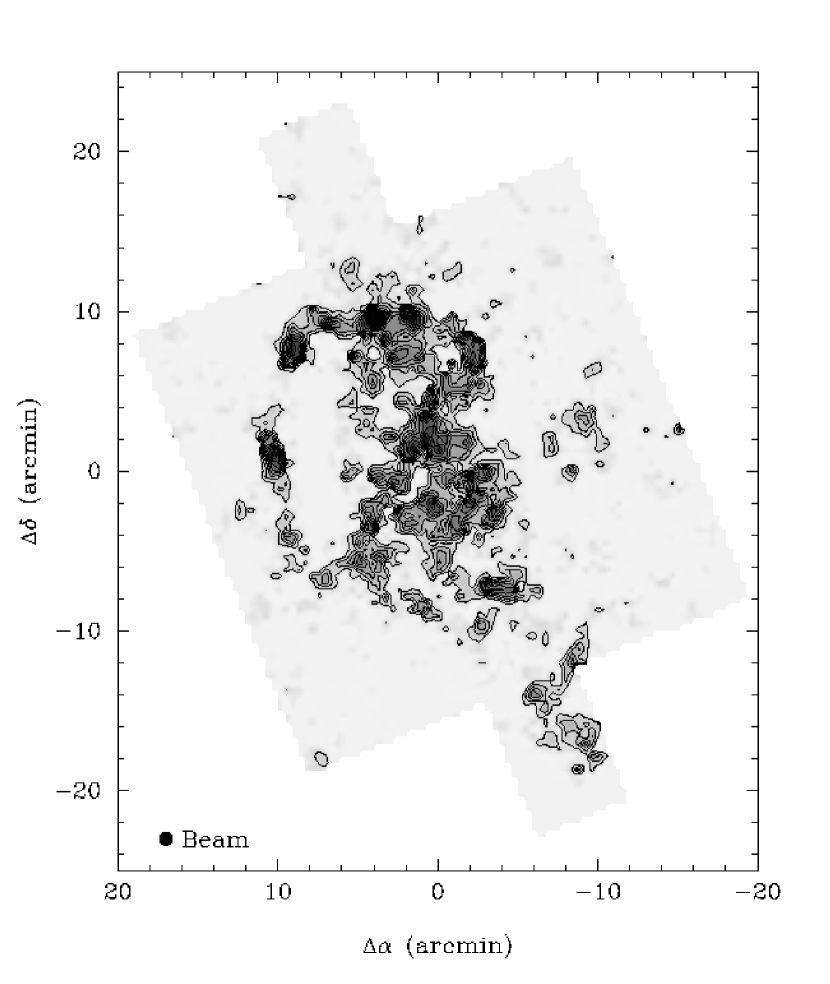
The projected, two dimensional distribution of CO emission from M33 as measured by these observations is displayed in Figure 1. The image is constructed from a masked moment calculation of the M33 data cube to minimize the noise contribution from emission free channels when integrating over the full kinematic extent of M33 (-285 VLSR -90 km s-1) (Adler et al. 1992). Summing all of the emission in our map and assuming a CO to conversion factor of 31020 cm-2-(K kms-1)-1 (see Wilson & Scoville 1990), we derive a global mass of 2.6108 . This value likely underestimates the molecular mass of M33 as it ignores the metallicity gradient within the disk (McCarthy et al. 1995; Monteverdi et al. 1997; Vichez et al. 1988) for which a larger CO to conversion factor may need to be applied in lower metallicity regions. Nor does it account for the regime in which is still abundant but CO is dissociated into CI or CII products. The bulk of CO emission is widely distributed over the field to a radius of 15′. For the 50″ resolution image, the 3 detection limit for a GMC with full width half maximum line width of 10 km s-1 corresponds to an mass of 8 M⊙. The spatial resolution of the observations (200 pc) is insufficient to detect individual GMCs if their typical size is pc (Wilson & Scoville 1990; Engargiola et al. 2003; Rosolowsky et al. 2003). Rather, the extended features are likely cloud structures distributed along spiral arms or are bound associations of GMCs. The molecular mass is not uniformly distributed between the northern and southern halves. The northern section of the disk contains 10% more molecular gas than the southern section. The sense of this asymmetry is opposite to that measured from the HI distribution over the same area in which the ratio of atomic gas mass in the north is 80% of the atomic mass in the south (Deul & van der Hulst 1987).
The degree to which giant molecular clouds reside within spiral arms provides important clues to their origin and lifetime. High resolution images of CO emission in more distant galaxies typically reveal a strong concentration of molecular gas in spiral arms (Regan et al. 2001). In the local group, M31 exhibits a large arm to inter-arm contrast for the molecular gas component (Loinard et al. 1999; Guelin et al. 2000). While spiral structure of molecular gas in the Milky Way is more difficult to determine, in the outer Galaxy where line of sight confusion is minimized, spiral arms are the near exclusive domain of CO emitting clouds (Heyer & Terebey 1998).
The spiral structure of M33 has been more difficult to define owing, in part, to the warp of the outer disk. Modeling of the distribution and kinematics of the HI 21cm line emission demonstrates large scale warping for radii greater than 20′ (Rogstad, Wright, & Lockhart 1976; Corbelli & Schneider 1997). Similarly, Sandage & Humphreys (1980) describe a system of spiral arms from the blue light distribution in which the inclination and position angles vary from the central region to the outer disk. Near infrared imagery shows the two bright inner spiral arms and identifies an enhancement of stellar density along the innermost spiral arms labeled by Sandage & Humphreys as IS and IN (Regan & Vogel 1994). The distribution of HI 21cm line emission from M33 is considerably more complex (Newton 1980; Deul & van der Hulst 1986). The optically identified arms are coincident with regions of enhanced atomic gas column density. However, there are many radial spurs which, in projection, connect inner to outer spiral features.
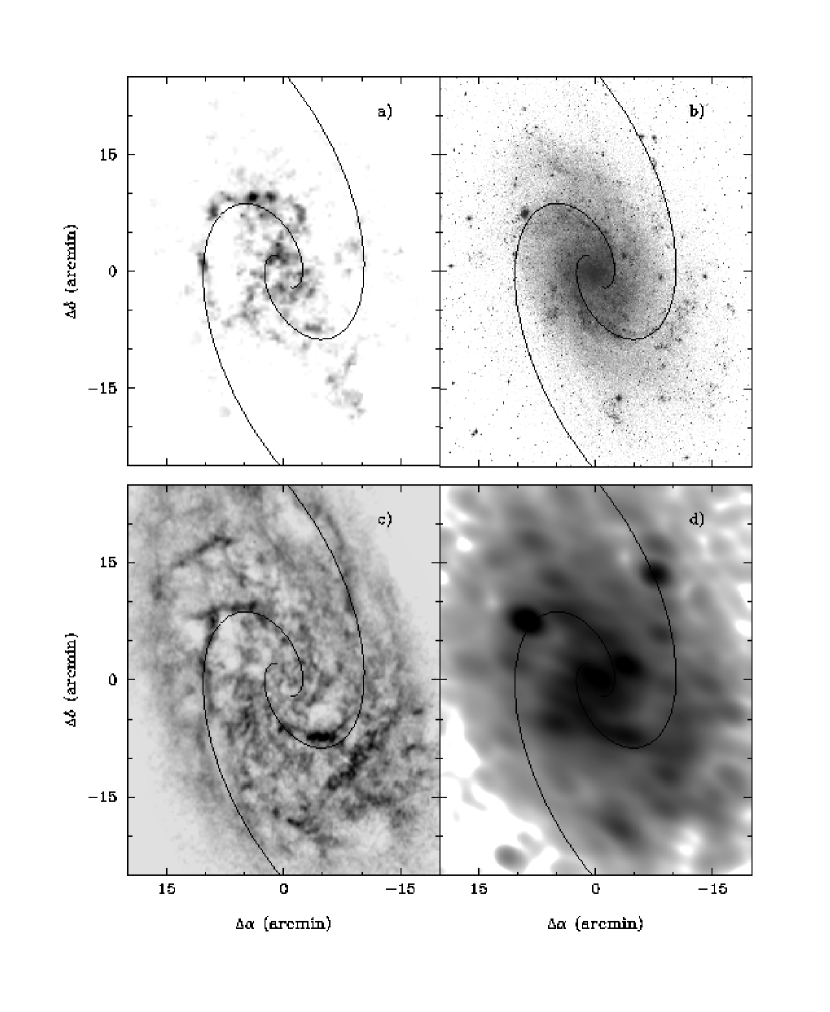
Figure 2 shows the the distribution of CO emission, the Digitized Sky Survey image, HI 21cm line emission from Westerbork Radio Synthesis Telescope (Deul & van der Hulst 1986), and 60m emission. The spiral pattern derived by Rogstad, Wright, & Lockhart (1976) is overlayed as a guide to associate the gas distribution with some plausible spiral structure in M33. While this two arm pattern with a wide opening angle provides a reasonable fit to the brightest HI and CO spiral arm segments, it is not a unique solution nor does it accurately describe all of the neutral gas emission. In particular, the HI and CO segments at offsets (-7′,-13′), (+4′,-7′), and the isolated, northern HI segment at (+10′,+16′) are well displaced from the model spiral arms. These are likely spiral features that do not conform to a global spiral pattern.
3.2 Molecular Gas Fraction
The gas component of disk galaxies is cycled between molecular, atomic, and ionized phases of the ISM. Molecular clouds condense from the reservoir of atomic gas in regions with sufficient column density to self-shield molecules from dissociating UV radiation. In regions of star formation where the UV radiation field is high, molecular material can be photo-dissociated or photo-ionized. The fraction of molecular gas relative to the atomic gas component and the radial profile of this ratio provides insight to the recycling process.
Corbelli (2003) has derived the radial profiles of the molecular and atomic gas surface densities in M33 from the CO data and the Arecibo 21-cm data (FWHM resolution 3.9′) using a tilted ring model which best fit the atomic hydrogen distribution (Corbelli & Schneider 1997). The same tilted ring model is applied to the 21-cm Westerbork image of M33 (Deul & van der Hulst 1987) smoothed to the same spatial resolution (50″) to derive the radial dependence of the ratio of the atomic to molecular gas mass surface density, . The Westerbork interferometer image recovers 64% of the HI flux within a radius of 20′ and 60% of the flux within a radius of 30′. Figure 3 shows the radial profiles of and using the Westerbork data with no correction for missing flux. Figure 4 shows the variation of with radius. Errors on and are computed according to the dispersion around the mean in each ring. The atomic gas component dominates the total gas surface density at all radii greater than 4′. The radial dependence for the HI/H2 ratio is reasonably described by the power law,
Annular averages derived using the Arecibo 21-cm data (Corbelli & Schneider 1997) provide a similar best fitting power law index and suggests that the fraction of flux recovered by the Westerbork interferometer does not vary with radius. The radial slope of is shallower in M33 than in gas rich galaxies for which the power law index is 1.5 (Wong & Blitz 2002).
A point to point comparison of the CO and HI images show varying degrees of correlation. In the central 4′ of M33, there is bright CO emission but only low to moderate HI surface brightness indicating an efficient conversion from atomic to molecular gas. Outside of this central region, most of the detected CO emission is coincident with high brightness HI features. From a sample of high resolution VLA images of 11 nearby spiral galaxies, Braun (1997) describes the HI distributions as a network of high brightness emission and associates this material with the cold, neutral component of the ISM based on the observed narrow HI line widths. The correspondence between CO emission and high brightness HI filaments in the disk of M33 demonstrates the condensation of giant molecular clouds from the cold, atomic gas but with lower efficiency than is observed in the central 4′.
4 Discussion
4.1 The Schmidt Law in M33
The survey of CO emission from M33 presented in §3 provides the first unbiased, filled aperture census of molecular gas in this Local Group galaxy. Such accounting of the molecular gas phase is essential to construct accurate descriptions of the star formation process within the disk. The Schmidt Law provides a concise, albeit, oversimplified recipe for star formation within the disk of a galaxy. It is typically derived from the radial profiles of the gas surface density (atomic + molecular) and some measure of the star formation rate, typically, H or far infrared flux densities (Kennicutt 1989). From a sample of 15 galaxies, Kennicutt (1989) determined the mean power law index, , to be 1.30.3. Recent high resolution observations of galaxies derive a Schmidt Law index between 1.1 and 1.7 depending on the extinction correction applied to the H (Wong & Blitz 2002). More importantly, Wong & Blitz (2002) note that the star formation rate surface density is more strongly correlated with the surface density than the total gas surface density as one would expect given that stars condense from giant molecular clouds. This confirms previous studies of the face-on spiral galaxies M51 and NGC 6946 where the H emission is strongly correlated with the distribution of molecular gas (Lord & Young 1990; Tacconi & Young 1990). However, at the highest resolution, the brightest HII regions are not coincident with CO emitting regions as the molecular gas is either photo-dissociated or ionized by the strong UV radiation from massive stars or evacuated by the attendant stellar winds.
Previous efforts to derive the Schmidt Law in M33 have considered the atomic gas exclusively or have been restricted to the central 3.5′ owing to the limited imaging of the molecular gas component. Madore et al. (1974) and Newton (1980) derived power law relationships between the surface density of HII regions and the atomic gas column density from interferometric HI 21cm line images. Newton (1980) found a nearly flat relationship between the two quantities in the inner regions of M33 (0.6) and a steep power law (2) in the outer regions (R 2.4 kpc).
To gauge the star formation rate in M33, we use the far infrared luminosity, , derived from 60µm and 100µm images of M33. The far infrared emission provides an excellent tracer to star formation activity in galaxies as a substantial amount of the far infrared flux emitted by a galaxy is contributed by interstellar dust heated by massive, newborn stars. Moreover, the far infrared emission is optically thin throughout the disk making corrections for extinction unnecessary. The old stellar component of a galaxy may also contribute to the measured far infrared flux. For M33, this contribution has been estimated to be less than 30% (Devereux, Duric, & Scowen 1997).
Owing to the deconvolution process, the resolution of the images may vary across the field. For the central 30′ of the M33 field, the resolutions of the 60µm and 100µm images are directly estimated from the ancillary beam maps and found to vary between 4 and 10%. To assure uniform, circular point spread functions of the 60µm and 100µm images with which to compare the CO and WRST HI images, the far infrared data were smoothed to a final resolution of 120″ using gaussian kernels with full width half maxima of 98″ and 48″ respectively. The CO and Westerbork HI images were similarly smoothed to this resolution.
The star formation rate, , within a given solid angle and averaged over a characteristic time is derived from the measured far infrared luminosity,
where
D is the distance to M33 (0.83 Mpc), and a Miller-Scalo IMF is assumed (Thronson & Telesco 1986). The star formation rate per unit area, , is
where and are the mean 60µm and 100µm intensities within a solid angle, , respectively. Many studies use the annular method in which is tabulated within the solid angle subtended by the annulus of a de-projected tilted ring and the gas surface density is the mean surface density within this ring (Kennicutt 1989; Martin & Kennicutt 2001; Wong & Blitz 2002). A Schmidt Law is constructed by evaluating and within successive rings at varying radii. The annular method provides a time averaged estimate of as it does not consider local variations of the gas distribution and phase caused by the star formation process itself. Following Wong & Blitz (2002), errors to and are assigned to the standard deviation of values within the subtended area. The radial profile of is shown in Figure 3.
The variation of star formation rate per unit area with both molecular and total gas surface densities in M33 is shown in Figure 5. Power laws are fit to each type of surface density and the amplitudes and power law indices are listed in Table 1. The fits are weighted by errors in both and . The steep relationship found for the total gas surface density is due to the near constant profile of the atomic gas component in the central 12′ which dominates the total gas surface density for all radii greater than 4 ′ (Corbelli 2003).
There is a strong correlation between the derived star formation rate per unit area and molecular gas surface density. This relationship even extends into the regime in which the neutral gas is mostly atomic. Such a correlation is not an artifact due to local heating of the molecular gas from an enhanced UV radiation field. An examination of the far infrared and CO emission from molecular clouds in the solar neighborhood show that most of the far infrared luminosity emerges from localized star forming cores that cover a small fraction of the cloud area. Beyond several pc, the UV radiation from young, massive stars provides little or no heating to the extended gas distribution from which most of the CO luminosity originates. Rather the measured correlation between and is a testament that stars exclusively condense from clouds of molecular gas. This relationship suggests that the formation of molecular clouds is the essential prerequisite to star formation (see Engargiola et al. 2003). The molecular Schmidt index, , is similar to values determined by Wong & Blitz (2002) when radially dependent extinction corrections are applied to their H data. The star formation rates at all radii are sufficiently high that if sustained, the current reservoir of molecular gas would be depleted within 1-3108 years. The depletion time for the total gas content increases from 0.4 in the central regions to greater than 10 Gyr in the outer disk where the star formation rate is reduced. Such variations are commonly observed in other galaxies (Wong & Blitz 2002). To sustain such star formation rates in the inner disk of M33 beyond several Gyr requires funneling gas from the outer disk reservoir or a shallow initial mass function in which a larger fraction of massive stars are formed to replenish the interstellar medium.
4.2 The Transition from Atomic to Molecular Gas
The major difference between M33 and more luminous gas rich galaxies is the relationship between atomic and molecular gas. Galaxies in the sample of Wong & Blitz (2002) are molecular-rich such that the atomic to molecular gas ratio, , ranges between 0.05 and 0.4 and varies with galactocentric radius roughly as . In M33, varies between 1 and 10 with a radial dependence, (see Figure 4).
In order to explain this radial dependence, we consider the model proposed by Elmegreen (1993). This model is based on the assumption that the fraction of molecular gas is determined by the balance between the gas pressure, which regulates the formation rate, and the dissociating radiation. In particular the molecular gas fraction, , should depend upon the the ambient pressure, , and radiation field, , as
To evaluate this interplay between the pressure and radiation field, the pressure of a disk in hydrostatic equilibrium is approximated as
is the star surface density of the disk which best fits the rotation curve (Corbelli 2003, Figure 5). The velocity dispersion of the gaseous and stellar disk are km s-1 and , consistent with an isothermal disk of scale height kpc. Using , we derive that best fits the relation,
where , and are the values of , and in the innermost ring. By minimizing the value we find, where the quoted uncertainty is the 1 error on the best fitting value of that takes into account uncertainties only. The Pearson linear correlation coefficient is 0.97. The data in M33 are in good agreement with Elmegreen’s predictions and parameterization for galaxies with low molecular gas fractions. These empirically support the idea that pressure is playing a significant role in regulating the fraction in low luminosity galaxies, such as M33.
While M33 is quite distinct from the sample of galaxies studied by Wong & Blitz (2002) in terms of gas surface density, Q parameters, and molecular gas fraction, it adheres to a similar star formation recipe. That is, star formation is primarily limited by the condensation of giant molecular clouds from the diffuse interstellar medium. Once a GMC develops, star formation is rapidly initiated (Engargiola et al. 2003). If regulates the star formation rate, the high Schmidt index, , relative to the total gas surface density, can be explained as a consequence of and of the molecular gas fraction, . Following Wong & Blitz (2002), the Schmidt index, , can be written as
From the annular averages we find . Since , the above equations predicts 0.2. Within the errors, this two step model of star formation is consistent with the observed value . The atomic gas layer of the disk may ultimately provide the reservoir of material from which giant molecular clouds condense and form stars in M33 but it plays no obvious role in regulating star formation.
4.3 Radial Progression of Star Formation in M33
Comparisons of the molecular scale length with the disk scale lengths derived from the stellar light, HII regions, and OB associations provides coarse insight to the star formation history of a galaxy. Corbelli (2003) derived a molecular gas scale length of 11′ (2.6 kpc). The disk scale lengths of OB associations and HII regions are comparable but just interior to this CO scale length and attest to the strong coupling of the molecular gas and recent (107 years) star formation activity. Star formation in the more distant past is reflected in the distribution of the stellar light within the disk of a galaxy. From J, H, K band imaging, Regan & Vogel (1994) derive a disk stellar scale length of order 6′. Thus, the disk stellar light, particularly, the older population of stars, is much more centrally condensed than the molecular gas. The broader distribution of CO in M33 with respect to old populations of stars is not typical of spiral galaxies. From the BIMA SONG, 4 of the 15 galaxies with measured profiles show CO scale lengths significantly (3) larger than the stellar scale length and one galaxy (NGC 628) with a difference as large as M33 (Regan et al. 2001). van den Bergh (2000) noted that the broader distribution of HII regions with respect to the starlight reflects an outward progression of star formation with time. As the molecular gas distribution provides a roadmap for both current and future star formation within a galaxy, the large molecular scale length with respect to the stellar light provides additional evidence for the outward progression of star formation activity in M33.
5 Conclusion
In this paper we have presented an image of 12CO J=1-0 emission from M33 and investigated the relationship between the star formation rate and the molecular and atomic neutral gas components. From our analyses, we derive the following conclusions.
-
1.
The mass surface density of molecular gas is strongly correlated with the star formation rate per unit area even in regions that are dominated by atomic gas. This proportionality suggests that the formation of molecular clouds is the limiting step to the formation of stars within the disk of M33.
-
2.
The Schmidt indices for the total and molecular gas surface densities are and respectively. The large value for is a consequence of the variation of the star formation rate within the molecular gas substrate, (), and the condensation of molecular clouds from the atomic gas component ().
-
3.
The pressure of the gaseous disk layer due to the weight of both gas and stars can account for the radial variations of the molecular gas fraction.
-
4.
The distributions of molecular gas and current star formation activity are extended with respect to the old, stellar population and suggests an outward progression of star formation within the M33 disk.
References
- Adler et al. (1992) Adler, D., Lo, K.Y., Wright, M.C.H., Rydbeck, G. Plante, R., and Allen, R.J., 1992, ApJ, 392, 497
- Braun (1997) Braun, R. 1997, ApJ, 484, 637
- Corbelli (2003) Corbelli, E. 2003, MNRAS, 342, 199
- Corbelli & Schneider (1997) Corbelli, E. & Schneider, S.E. 1997, ApJ, 479, 244
- Corbelli & Salucci (2000) Corbelli, E. & Salucci, P. 2000, MNRAS, 311, 441
- Deul & van der Hulst (1987) Deul, E.R. & van der Hulst, J.M. 1987, A&AS, 67, 509
- (7) Devereux, N, Duric, N., & Scowen, P. 1997, AJ, 113, 236
- Elmegreen (1993) Elmegreen, B.G., 1993, ApJ, 411, 170
- Elmegreen (2002) Elmegreen, B.G., 2002, ApJ, 577, 206
- Engargiola et al. (2003) Engargiola, G., Plambeck, R.L, Rosolowsky, E. & Blitz, L. 2003, ApJS, in press
- (11) Guelin, M., Nieten, C., Neininger, N., Muller, S., Lucas, R., Ungerechts, H., Wielebinski, R., 2000, in The Interstellar Medium in M31 and M33, eds. E.M. Berkhuijsen, R. Beck, & R.A.M. Walterbos, p. 15
- (12) Heyer, M. H. & Terebey, S. 1998, ApJ, 502, 265
- Hunter, Elmegreen, & Baker (1998) Hunter, D.A., Elmegreen, B.G., & Baker, A.L., 1998, ApJ, 493, 595
- Kennicutt (1989) Kennicutt, R.C., 1989, ApJ, 344, 685
- Loinard et al. (1999) Loinard, L., Dame, T.M., Heyer, M.H., & Thaddeus, P. 1999, AA, 351, 1087
- Lord & Young (1990) Lord, S. D. & Young, J.S. 1990, ApJ, 356, L135
- Madore et al. (1998) Madore, B.F., van den Bergh, S. & Rogstad, D.H. 1974, ApJ, 191, 317
- Martin & Kennicutt (2001) Martin, C.L. & Kennicutt, R.C., 2001, ApJ, 555, 301
- Newton (1980) Newton, K. 1980, MNRAS, 190, 689
- (20) Regan, M.W., & Vogel, S.N. 1994, ApJ, 434, 536
- Regan et al. (2001) Regan, M.W., Thornley,M.D., Helfer, T.T., Sheth, K., Wong, T., Vogel, S.N., Blitz, L., & Bock,D.C. 2001, ApJ, 561, 218
- (22) Rogstad, D.H., Wright, M.C.H., & Lockhart, I.A., 1976, ApJ, 204, 703
- Rosolowsky et al. (2003) Rosolowsky, E., Engargiola, G., Plambeck, R.L, & Blitz, L. 2003, ApJ, in press
- (24) Sandage, A. & Humphreys, R.M. 1980, ApJ, 236, L1
- Schmidt (1959) Schmidt,M. 1959, ApJ, 129, 243
- Tacconi & Young (1990) Tacconi, L.J. & Young, J.S. 1990, ApJ, 352, 595
- (27) Thronson, H.A. & Telesco, C.M. 1986, ApJ, 311, 98
- van den Bergh (2000) van den Bergh, S. 2000, in The Galaxies of the Local Group, Cambridge University Press
- Thornley & Wilson (1995) Thornley, M. & Wilson, C.D. 1995, ApJ, 447, 616
- Toomre (1964) Toomre, A. 1964, ApJ, 139, 1217
- Wilson & Scoville (1989) Wilson, C.D. & Scoville, N.Z. 1989, ApJ, 347, 743
- Wilson & Scoville (1990) Wilson, C.D. & Scoville, N.Z. 1990, ApJ, 363, 435
- Wong & Blitz (2002) Wong, T. & Blitz, L. 2002, ApJ, 569, 157
- Young & Scoville (1982) Young, J.S. & Scoville, N.Z. 1982, ApJ, 260, L11
- Young et al. (1995) Young, J.S. et al. 1995, ApJS, 98, 219


| Total Gas | Molecular Gas | |
|---|---|---|
| n | 3.30.07 | 1.360.08 |
| C | 0.0035 0.066 | 3.20.2 |
| Corr. Coeff. | 0.99 | 0.98 |