Spectroscopic Analyses of the Blue Hook Stars in NGC 2808: A More Stringent Test of the Late Hot Flasher Scenario††thanks: Based on observations collected at the European Southern Observatory, Chile (ESO proposal 68.D-0248)
Recent UV observations of the globular cluster NGC 2808 (Brown et al. brsw01 (2001)) show a significant population of hot stars fainter than the zero-age horizontal branch (“blue hook” stars), which cannot be explained by canonical stellar evolution. Their results suggest that stars which experience unusually large mass loss on the red giant branch and which subsequently undergo the helium core flash while descending the white dwarf cooling curve could populate this region. Theory predicts that these “late hot flashers” should show higher temperatures than the hottest canonical horizontal branch stars and should have helium- and carbon-rich atmospheres. As a test of this late hot flasher scenario, we have obtained and analysed medium resolution spectra of a sample of blue hook stars in NGC 2808 to derive their atmospheric parameters. Using the same procedures, we have also re-analyzed our earlier spectra of the blue hook stars in Cen (Moehler et al. mosw02 (2002)) for comparison with the present results for NGC 2808. The blue hook stars in these two clusters are both hotter (35,000 K) and more helium-rich than canonical extreme horizontal branch stars in agreement with the late hot flasher scenario. Moreover, we find indications for carbon enhancement in the three most helium-enriched stars in NGC 2808. However, the blue hook stars still show some hydrogen in their atmospheres, perhaps indicating that some residual hydrogen survives a late hot flash and then later diffuses to the surface during the horizontal branch phase. We note that the presence of blue hook stars apparently depends mostly on the total mass of the globular cluster and not so much on its horizontal branch morphology.
Key Words.:
Stars: horizontal branch – Stars: evolution – globular clusters: individual: NGC 2808 – globular clusters: individual: NGC 51391 Introduction
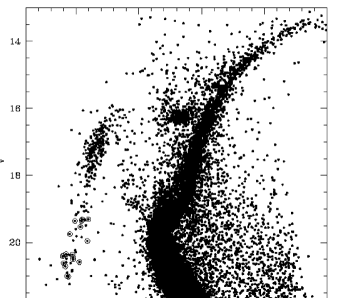
Low-mass stars burning helium in a core of about 0.5 and hydrogen in a shell populate a roughly horizontal region in the colour-magnitude diagrams of globular clusters, which has earned them the name “horizontal branch” (HB) stars. The Galactic globular clusters show a great variety in horizontal branch morphology, i.e., in the temperature distribution of their HB stars. The temperature of an HB star depends – at a given metallicity – on the mass of its hydrogen envelope, with the hottest or extreme HB (EHB) stars ( 20,000 K) having extremely thin 0.01 ) envelopes. The increase in the bolometric correction with increasing temperature turns the blue HB into a vertical blue tail in optical colour-magnitude diagrams with the faintest blue tail stars being the hottest and least massive (see Fig. 1 for a prominent example of a blue tail). It is still unclear how some stars manage to lose nearly all of their envelope mass and still undergo the helium core flash, as indicated by the long blue tails in a number of globular clusters (e.g., NGC 6752, Moehler et al. mosw00 (2000)). The globular cluster NGC 2808 represents a good template cluster, since it has an extremely long blue tail extending to very high temperatures and correspondingly low envelope masses.
NGC 2808 has been the subject of four recent deep ground-based and Hubble Space Telescope (HST) photometric studies (Sosin et al. sosi97 (1997), Walker walk99 (1999), Bedin et al. bepi00 (2000), Brown et al. brsw01 (2001)). The ground-based studies have shown that the blue tail of NGC 2808 extends to extremely faint magnitudes ( ), with gaps at and . These gaps can be seen at V and in Fig. 1. The brighter gap is thus at a similar position as the underpopulated region in the colour-magnitude diagram of NGC 6752, which separates the EHB stars from the classical blue HB stars (Moehler et al. 1997b , mosw00 (2000); Momany et al. mopi02 (2002)), while the fainter gap coincides with the hot end of the blue tail in NGC 6752. The blue tail in NGC 2808 thus extends to hotter temperatures than that of NGC 6752. That in itself would not be a problem, but the spectroscopic analyses of Moehler et al. (1997b , mosw00 (2000)) show that the blue tail stars in NGC 6752 already populate the EHB to the hot end predicted by canonical HB models.
Observations of NGC 2808 in the far- and near-UV (Brown et al. brsw01 (2001), their Fig. 3) show that the stars below the faint gap form a hook-like feature that extends up to below the hot end of the zero-age HB (ZAHB). Such “blue hook” stars are so far known in only three other globular clusters: Cen (D’Cruz et al. dcoc00 (2000), Moehler et al. mosw02 (2002)), NGC 6388 and possibly NGC 6441 (Busso et al. bupi03 (2003)), all of which are very massive. Within the framework of canonical HB theory there is no way to populate this region of the UV colour-magnitude diagram without requiring an implausibly large decrease in the helium-core mass. Thus canonical theory fails to explain both the faint UV luminosities and expected high temperatures of the blue hook stars.
Brown et al. (brsw01 (2001)) have proposed a scenario to explain the blue hook stars. According to this scenario the stars brighter than the gap at are canonical EHB stars which lost all but 0.01 of their envelope mass prior to undergoing the helium core flash. As discovered by Castellani & Castellani (caca93 (1993)), stars which lose more mass than this will leave the red giant branch and evolve to high effective temperatures before undergoing the helium core flash, producing the so-called “hot flashers”. Sweigart (swei97 (1997)) subsequently showed that hot helium flashes can occur either as a star evolves from the tip of the red giant branch to the top of the white dwarf cooling curve (“early” hot flasher), or later as a star descends the white dwarf cooling curve (“late” hot flasher). For even higher mass loss, a star will die as a helium white dwarf without ever igniting helium. These different evolutionary paths are illustrated in Moehler et al. (mosw02 (2002)) and Sweigart et al. (swbr02 (2002)).
D’Cruz et al. (dcdo96 (1996), dcoc00 (2000)) proposed that the blue hook stars could be the progeny of such hot flashers, but unfortunately the D’Cruz et al. models were, at most, only fainter than the canonical ZAHB, much less than required by the observations. More recently, Brown et al. (brsw01 (2001)) have explored the evolution of both the early and late hot flashers through the helium core flash to the EHB in more detail. Their models show that a late hot helium flash on the white dwarf cooling curve will induce substantial mixing between the hydrogen envelope and helium core, leading to helium-rich EHB stars that are much hotter than canonical ones, as found previously by Sweigart (swei97 (1997)). This result has been confirmed by the calculations of Cassisi et al. (casc03 (2003)), who were able to follow the evolution of a late hot flasher completely through the helium core flash. Brown et al. (brsw01 (2001)) suggest that such flash mixing may be the key for understanding the evolutionary status of the blue hook stars. Such mixing may also be responsible for producing the helium-rich, high gravity field sdO stars (Lemke et al. lehe97 (1997)), whose origin is otherwise obscure. The flash mixing scenario predicts a gap of about 6000 K between the canonical EHB stars (i.e., stars without flash-mixing, including early hot flashers) and the late hot flashers as well as a helium dominated atmospheric composition for the late hot flashers. The hydrogen deficiency results in a flux redistribution where more flux is emitted shortward of the Lyman edge at 912 Å and less flux is emitted at ultraviolet (1500 Å) and longer wavelengths, which makes flash-mixed stars fainter than canonical EHB stars at these wavelengths.
Spectroscopic observations of blue hook stars in Cen by Moehler et al. (mosw02 (2002)) showed that these stars reach effective temperatures of more than 35,000 K, i.e., well beyond the hot end of the canonical EHB. In addition, most of them show at least solar helium abundances with the helium abundance increasing with effective temperature, in contrast to canonical EHB stars such as those studied in NGC 6752 by Moehler et al. (mosw00 (2000)). Contrary to the predictions of Brown et al. (brsw01 (2001)), however, only one star showed a helium abundance of 0. These results may indicate that flash mixing is less efficient than assumed, or that some residual hydrogen survives flash mixing and then diffuses outward to the surface. It is unclear whether the lower than expected helium abundances can still reproduce the UV properties of the stars. UV data have been presented for the blue hook stars in the central region of Cen by D’Cruz et al. (dcoc00 (2000)), but due to crowding these stars are not accessible to ground-based spectroscopy. UV data are available for the blue hook stars in the outer region of Cen from the Ultraviolet Imaging Telescope (UIT, Stecher et al. stec97 (1997)), but unfortunately, these data are too noisy to permit a quantitative test.
Considering these somewhat ambiguous results and the fact that Cen is not a typical globular cluster, we decided to test the late hot flasher scenario by observing the more typical globular cluster NGC 2808. We discuss our observational data in Sect. 2 and then derive the parameters of the blue hook stars (temperatures, gravities and helium abundances) in Sect. 3. In Sect. 4 we compare our results with the predictions of the flash-mixing scenario.
2 Observations and Data Reduction
2.1 Target Selection
Our spectroscopic targets were selected from the catalog of Walker (walk99 (1999); Fig.1), and include seven stars brighter than the gap at V , and twelve stars fainter than the gap. The coordinates and photometry for our targets are given in Table 1, along with cross-identifications from the catalog of Bedin et al. (bepi00 (2000)).
| Walker (1999) | Bedin et al. (2000) | m1520 | ||||||
| setup a | ||||||||
| 09h12m0720 | 64∘54′411 | W6816 | + | B13283 | ||||
| 09h12m2068 | 64∘53′094 | W9301 | + | B12148 | + | |||
| 09h11m5706 | 64∘56′186 | W14040 | + | B12955 | + | |||
| 09h11m5881 | 64∘56′456 | W14711 | + | B12583 | ||||
| 09h12m0922 | 64∘54′083 | W18803 | B20678 | + | ||||
| 09h12m0947 | 64∘55′035 | W18899 | B34817 | |||||
| 09h12m2095 | 64∘53′572 | W23198 | B21073 | |||||
| 09h12m2851 | 64∘52′193 | W25794 | B21376 | + | ||||
| 09h12m3125 | 64∘52′069 | W26607 | + | B31854 | + | – | ||
| setup b | ||||||||
| 09h12m1342 | 64∘46′354 | W20334 | B38604 | |||||
| 09h12m1743 | 64∘48′035 | W21882 | B14334 | |||||
| 09h12m2981 | 64∘47′561 | W26182 | + | B11516 | + | |||
| 09h12m3411 | 64∘51′232 | W27412 | + | B15455 | ||||
| setup c | ||||||||
| 09h11m3372 | 64∘56′249 | W6022 | B11345 | |||||
| 09h11m3659 | 64∘58′010 | W6849 | B23335 | |||||
| 09h11m3753 | 64∘53′311 | W7084 | B26161 | |||||
| 09h11m4247 | 64∘56′571 | W8750 | B25082 | |||||
| 09h11m3634 | 64∘54′077 | W9855 | B24578 | |||||
| 09h11m4579 | 64∘56′271 | W9863 | B16326 | |||||
2.2 UIT observations
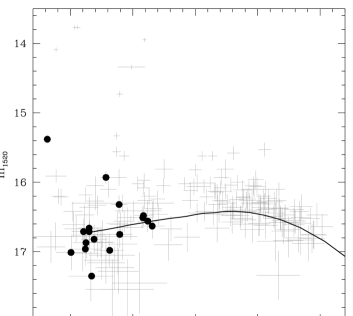
We would like to compare the results of our ground-based spectroscopy with the positions of our target stars in the UV colour-magnitude diagram. Unfortunately, we cannot use the UV colour-magnitude diagram of Brown et al. (brsw01 (2001)) because all of their stars lie within 35″ of the cluster center and are thus too crowded for ground-based spectroscopy. As an alternative, we have derived new 1520 Å photometry of stars in the outer region of NGC 2808 using archival UIT images. The UIT photometry of NGC 2808 has not been previously published, although optical spectroscopy of three UV-bright stars on the image was presented by Moehler et al. (mola98 (1998)). The UIT image of NGC 2808 was a 979 second exposure obtained on 19 May 1995 using the B1 filter, which has a central wavelength of 1520 Å and a width of 350 Å. The FWHM of the star images was about 5″ and the faintest hot HB stars were near the sensitivity limit. Therefore, to create an ultraviolet colour-magnitude diagram, we performed 3-pixel (34) radius circular aperture photometry only on isolated stars (all more than 2′ from the cluster center) which had a positional match with hot ( ) stars in the catalogs of Walker (walk99 (1999)) or Bedin et al. (bepi00 (2000)). A star was determined to be isolated if it had no neighbours within 5″ on either the UIT image, or on the lists of hot stars in the optical catalogs. We used the standard UIT absolute calibration and determined an aperture correction of using a few isolated UV-bright stars. The resulting UIT colour-magnitude diagram obtained from the 1520 Å photometry given in Table 1 is shown in Fig. 2, and includes all our spectroscopic targets except for W26607 which has a blurred PSF on the UIT image. The complete ultraviolet photometry and optical identifications used in Fig. 2 are available upon request to the authors.
Although the UIT colour-magnitude diagram is of poorer quality than that shown in Brown et al. (brsw01 (2001)), it is still possible to identify the candidate sub-ZAHB stars. Unfortunately, all but one of our blue hook targets are less than 0.3 mag fainter than the hottest canonical ZAHB model at m1520 = 16.72. Only W20334 at m1520 = 17.35 is near the faint end of the blue hook distribution found by Brown et al. (2001). Thus our choice of targets is biased toward the brighter blue hook stars.
2.3 Spectroscopy
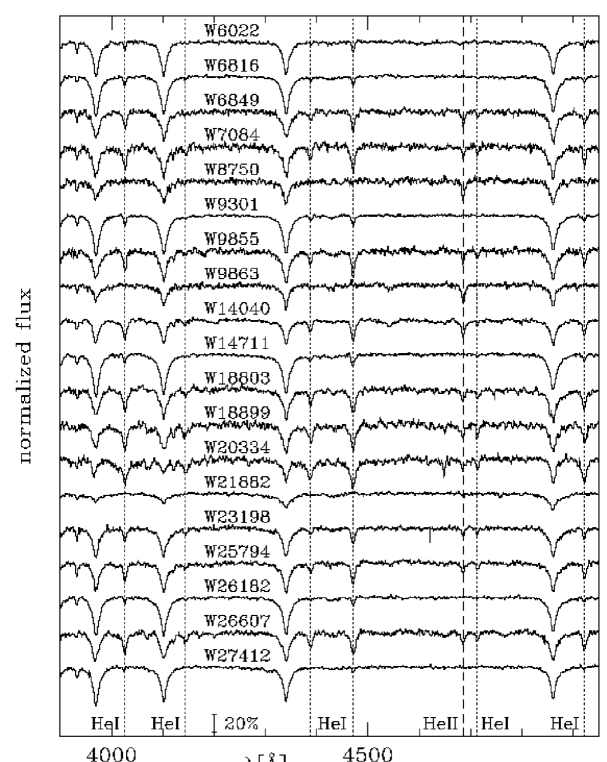
We obtained medium-resolution spectra (900) of 19 stars along the blue tail in NGC 2808 with at the VLT-UT1 (Antu) with FORS1 see Fig. 1). The data were obtained in service mode (see Table 2 for details). We used the multi-object spectroscopy (MOS) mode of FORS1 (slit length 19″) with the standard collimator (02/pixel), a slit width of 1″ and grism B600. As FORS1 is equipped with an atmospheric dispersion corrector, MOS observations at higher airmass are not a problem. The detector was a TK2048EB4-1 backside thinned CCD with 20482048 pixels of (24 m)2, which was read out with high gain (1.46 e-/count, 5.15 e- read-out noise) and normal read-out speed using one read-out port only. This configuration yields a dispersion of 1.2 Å/pixel. As can be seen from Table 2, the seeing was usually better than the slit width, resulting in a seeing-dependent resolution of the spectra.
| setup | start of observation | seeing | airmass | moon | |
|---|---|---|---|---|---|
| illumination | distance | ||||
| a | 11/01/2002 05:38:52.722 | 091 | 1.319 | 0.053 | |
| 11/01/2002 06:37:32.265 | 061 | 1.319 | 0.050 | ||
| 15/01/2002 05:13:58.529 | 073 | 1.322 | 0.027 | ||
| b | 20/01/2002 04:50:50.581 | 077 | 1.322 | 0.350 | |
| 08/02/2002 02:26:30.563 | 082 | 1.390 | 0.161 | ||
| 10/02/2002 02:46:38.787 | 068 | 1.354 | 0.046 | ||
| c | 09/02/2002 04:02:45.640 | 067 | 1.314 | 0.090 | |
| 09/02/2002 04:46:30.947 | 050 | 1.318 | 0.088 | ||
For each night dome flat fields with two different illumination patterns and CdHeHg wavelength calibration spectra were observed. As part of the standard calibration we were also provided with masterbias frames for our data. The masterbias showed no evidence for hot pixels and was smoothed with a 3030 box filter to keep any possible large scale variations, but erase noise. The flat fields were averaged for each night and bias-corrected by subtracting the smoothed masterbias of that night. From the flat fields we determined the limits of the slitlets in spatial direction. Each slitlet was extracted and from there on treated like a long-slit spectrum. The flat fields were normalized with 4th or 5th order polynomials. The dispersion relation was obtained from the wavelength calibration frames by fitting 3rd to 4th order polynomials to the line positions along the dispersion axis. We used 13 to 16 unblended lines between 3600 Å and 6200 Å and achieved an r.m.s. error of 0.05 Å to 0.08 Å per row.
Due to exposure times of 2700 sec the scientific observations contained a large number of cosmic ray hits. Those were corrected with the algorithm described in Gössl & Riffeser (gori02 (2002)), using a threshold of 15 and a FWHM of 1.5 pixels for the cosmic ray hits. As the routine is not originally intended for the use with spectra, we also reduced the uncorrected frames to allow a check for any possible artifacts of the cosmic ray cleaning procedure. The slitlets with the stellar spectra were extracted in the same way as the flat field and wavelength calibration slitlets. The smoothed masterbias was subtracted, and the spectra were divided by the corresponding normalized flat fields, before they were rebinned 2-dimensionally to constant wavelength steps. We then filtered the uncleaned frames along the spatial axis with a median filter of 7 pixels width to erase cosmic ray hits. We identified regions uncontaminated by any stellar source and approximated the spatial distribution of the sky background by a constant. For the uncleaned frames the sky background was fit on the median filtered frames and subtracted from the unfiltered ones, whereas for the cleaned frames both sky fit and subtraction were performed on the unfiltered rebinned data. The sky-subtracted spectra were extracted using Horne’s (horn86 (1986)) algorithm as implemented in MIDAS. Finally the spectra were corrected for atmospheric extinction using the extinction coefficients for La Silla (Tüg tueg77 (1977)) as implemented in MIDAS, because they provide the closest approximation to Paranal conditions, for which no spectroscopic extinction coefficients are available.
For a relative flux calibration we used response curves derived from spectra of LTT 3864, LTT 4364, and LTT 6248 with the data of Hamuy et al. (hawa92 (1992)). The response curves were fit by splines and averaged for all nights. The individual target spectra were corrected for any Doppler shifts determined from Balmer and/or helium absorption lines. These shifts varied more than expected from one observation to the next. This can be understood by the fact that the seeing disk was smaller than the slit width, so that small shifts in the position of the stars within the slit can introduce shifts in the wavelength. A shift of 01 corresponds to a shift of 0.6 Å. Any remaining cosmic ray hits in the stellar spectra were corrected by comparing the individual spectra of the stars. Due to the seeing being smaller than the slit width spectra of the same star from different nights can have different resolution. In order to get a well defined resolution of the co-added spectra, we convolved spectra obtained with better seeing to the resolution determined by the worst resolution of each setup. This resulted in resolutions of 5.4 Å (09) for setup a, 4.8 Å (08) for setup b and 4.0 Å (07) for setup c.
3 Analysis
The spectra, given in Fig. 3, show a large variety of helium line strengths. Part of this variation is due to variations in effective temperature, but – as we will see in the analysis – part is also due to variations in the atmospheric helium abundance along the blue tail in NGC 2808.
3.1 Atmospheric parameters
| Star | ||||
|---|---|---|---|---|
| [K] | ||||
| W6022 | 2.23 | 30300 480 | 5.570.05 | 1.990.07 |
| W6816 | 2.39 | 21300 540 | 4.880.07 | 2.170.05 |
| W6849 | 1.88 | 37500 330 | 5.770.09 | 0.820.05 |
| W7084 | 1.63 | 35300 580 | 5.910.10 | 0.570.05 |
| W8750 | 2.52 | 480001300 | 6.210.14 | 1.780.15 |
| W9301 | 2.14 | 21100 560 | 4.920.07 | 2.050.05 |
| W9855 | 2.45 | 35700 580 | 5.600.12 | 0.740.05 |
| W9863 | 2.04 | 530002100 | 5.810.10 | 1.560.14 |
| W14040 | 2.16 | 40400 220 | 5.630.05 | 0.310.03 |
| W14711 | 2.92 | 20100 520 | 4.870.07 | 1.930.05 |
| W18803 | 1.70 | 35700 510 | 5.960.09 | 0.380.03 |
| W18899 | 1.91 | 35500 790 | 5.700.12 | 0.210.05 |
| W20334 | 2.15 | 36300 900 | 5.790.15 | 1.020.02 |
| W21882 | 4.09 | 670001500 | 6.990.09 | 2.910.12 |
| W23198 | 2.38 | 34600 400 | 5.810.07 | 1.220.05 |
| W25794 | 1.44 | 36600 460 | 5.670.09 | 0.650.03 |
| W26182 | 1.79 | 24200 640 | 5.220.07 | 2.370.05 |
| W26607 | 2.91 | 36300 520 | 5.630.09 | 0.360.03 |
| W27412 | 2.64 | 28700 640 | 5.370.07 | 2.770.12 |
| Star | ||||
|---|---|---|---|---|
| [K] | ||||
| WF3-1 | 1.34 | 360002100 | 5.970.40 | 2.070.50 |
| BC6022 | 1.96 | 460001100 | 6.140.15 | 1.760.14 |
| BC8117 | 1.65 | 300001600 | 5.430.21 | 2.330.26 |
| BC21840 | 2.94 | 360001000 | 5.440.19 | 0.780.12 |
| C521 | 2.20 | 35000 620 | 5.860.12 | 0.880.07 |
| D4985 | 2.50 | 38000 700 | 5.790.17 | 0.800.14 |
| D10123 | 2.40 | 35200 690 | 5.730.14 | 0.840.09 |
| D10763 | 2.85 | 360001700 | 4.820.15 | 0.500.03 |
| D12564 | 1.75 | 36800 960 | 5.730.17 | 0.500.05 |
| D14695 | 2.16 | 38800 230 | 5.310.12 | 0.160.05 |
| D15116 | 1.50 | 400001700 | 6.080.38 | 0.510.17 |
| D16003 | 1.45 | 36600 550 | 5.890.12 | 1.000.09 |
We fitted the hot stars (33,000 K) with H-He non-LTE model atmospheres to derive effective temperatures, surface gravities, and helium abundances. The helium-rich non-LTE model atmospheres were calculated with a modified version of the accelerated lambda iteration code of Werner & Dreizler (wedr99 (1999)). The model atoms for hydrogen and helium as well as the handling of the line broadening for the spectrum synthesis are similar to those of Werner (wern96 (1996)). The calculation of the helium-poor non-LTE model atmospheres is described in Napiwotzki (napi97 (1997)). For the cooler stars we used ATLAS9 model atmospheres for solar metallicity (Kurucz kuru93 (1993)) to account for effects of radiative levitation (see Moehler et al. mosw00 (2000) for details), from which we calculated spectra with Lemke’s version111For a description see http://a400.sternwarte.uni-erlangen.de/ai26/linfit/linfor.html of the LINFOR program (developed originally by Holweger, Steffen, and Steenbock at Kiel University). To establish the best fit, we used the routines developed by Bergeron et al. (besa92 (1992)) and Saffer et al. (sabe94 (1994)), as modified by Napiwotzki et al. (nagr99 (1999)), which employ a test. The necessary for the calculation of is estimated from the noise in the continuum regions of the spectra. The fit program normalizes model spectra and observed spectra using the same points for the continuum definition. During the analysis of the data presented here we realized that helium-poor and helium-rich spectra required different sets of continuum points. Especially the use of the continuum points derived from helium-poor spectra for the analysis of helium-rich spectra can introduce large systematic errors, esp. overestimates of the helium abundance due to continuum points in the wings of strong helium lines and/or too narrow fitting windows for helium lines. We therefore refined the definition of the continuum points to correct for such errors. Using this new definition of the continuum points, we re-analysed the data for the blue hook stars in Centauri presented in Moehler et al. (mosw02 (2002)). The new results differ from the old ones usually within the mutual error bars, except for the two most helium-rich stars, as expected.
We used the Balmer lines Hβ to H8 (excluding Hϵ to avoid the Ca ii H line), the He i lines 4026 Å, 4388 Å, 4471 Å, 4921 Å and the He ii lines 4542 Å, 4686 Å for the helium-poor stars. For the helium-rich stars we also included the He i lines 4713 Å, 5015 Å and 5044 Å in the fit. The results are given in Table 3 for NGC 2808 and Table 4 for Cen.
As can be seen from Table 3 W21882 shows both a much higher effective temperature (67,000 K) and surface gravity ( = 6.99) than all other stars. These stellar parameters indicate that W21882 may be a low-mass white dwarf, just in the mass range between the most massive He white dwarfs and the least massive C/O white dwarfs (cf. Fig 4). This suggests an absolute magnitude of , which would place W21882 at a distance of at most 4 kpc (zero reddening assumed), compared to 9.6 kpc for NGC 2808. Unfortunately, the radial velocity estimates derived from our spectra are too crude to determine cluster membership. However, as can be seen from Table 3, the model fit to W21882 has by far the largest value of all our targets. We examined the three individual spectra to search for variability that might indicate binarity or problems with the spectra, but did not find any such evidence. Additional observations of this very hot star are needed to better determine its cluster membership and evolutionary status and we therefore omit it from all further discussion. Figs. 5 and 6 show the results for all other stars.


In order to verify if the atmospheric parameters can reproduce the UIT observations, we calculated UIT fluxes from the observed magnitudes, using the model spectra from the best fits. The model spectra were first reddened by = . Then mean fluxes through both the UIT 1520 Å and the filters were calculated to obtain the colour, which was added to the observed magnitude from Walker (walk99 (1999)) to obtain the expected magnitude. The results are compared to the UIT observations in Fig. 7. The agreement is good for the majority of the stars considering the low quality of the UIT data. The largest discrepancies are for the two helium-rich stars (W6849 and W14040), which have much fainter observed UIT magnitudes than predicted. A possible cause for these discrepancies might be the omission of carbon or other metal opacity in our model atmospheres, which Lanz et al. (labr03 (2003)) have shown can affect both the derived atmospheric parameters from optical spectra, and the ultraviolet flux distribution.

3.2 Carbon abundances
Along with a large helium enhancement, the flash-mixing scenario also predicts a strong surface carbon enhancement. The flash-mixed model computed by Cassisi et al. (casc03 (2003)) is strongly enhanced in both carbon (mass fraction 0.029) and nitrogen (mass fraction 0.007). The corresponding solar mass fractions are 0.0028 and 0.00081 for C and N, respectively. We see lines of C iii 4070, 4170, 4650 Å in several of our spectra, but our low resolution and S/N prevents a detailed abundance analysis.
To obtain a rough estimate of the carbon abundance, we began with the H-He NLTE models used to derive Teff, log g and the helium abundance. Keeping these parameters fixed we then computed five additional models with CNO222Although oxygen should not be enhanced in flash-mixed stars, we do not expect the enhanced oxygen in our models to alter our estimate of the carbon abundance. logarithmic mass fractions relative to solar of , , , , and . As noted by Lanz et al. (labr03 (2003)), this approach is inconsistent for large carbon abundances, in that the additional C opacity can alter the atmospheric structure significantly, and therefore the derived stellar parameters. The impact of this additional C opacity has so far been explored only in the case of the field He-sdB star PG1544488. For this star Lanz et al. (labr03 (2003)) found that the value of given by NLTE models with a C abundance of 0.02 by mass, as obtained by fitting the UV C III lines, was about 0.5 dex larger than the value given by models without C. Additional calculations are needed to determine the carbon abundance at which it is possible to neglect carbon in the model atmosphere and still derive accurate stellar parameters. We note, however, that we find a supersolar carbon abundance in only one star (W20334), and so our crude approach is likely adequate for the remaining stars.
The comparison between model spectra and observations resulted in a carbon abundance compatible with the cluster abundance ([Fe/H] , Harris harr96 (1996)) except for the three most helium-rich stars W14040, W18899, and W20334. For W14040 (= ) and W18899 (= ) we estimate logarithmic carbon mass fraction relative to the Sun of 0.5 and 0.0, respectively. The most helium-rich star, W20334 (= +1.02), shows C iii lines at 4070 Å and 4650 Å, which are even stronger than predicted by a model atmosphere with a CNO abundance of ten times solar. In this case, the limitations of our two-step approach (see above) become evident. As noted above, a more accurate abundance determination for this star requires an analysis with a model grid taking carbon opacity into account for the determination of and (Lanz et al. labr03 (2003)).
A similar estimate of the carbon abundances for the Cen stars was not possible due to the poor S/N and resolution of these data. Nevertheless, the strong C iii features found in some of the Cen spectra suggest an enhanced carbon abundance in some of the blue hook stars.
4 Discussion
Our analysis of blue tail and blue hook stars in NGC 2808 shows that these stars form two different groups according to their helium abundance (cf. Fig. 8): All stars brighter than the gap at V are helium-poor, although they cover a large temperature range (cf. Fig. 6). The stars fainter than the gap at V, on the other hand, show mostly super-solar abundances, with three exceptions: W8750, W9863, and W23198. Fig. 6 shows that the helium-rich stars cluster between 35,000 K and 40,000 K, well beyond the hot end of the canonical EHB. We will now discuss the evolutionary status of the helium-poor and helium-rich stars in more detail.

4.1 Helium-Poor Stars
As can be seen from Fig. 5, the six helium-poor stars cooler than 31,000 K occupy a range in effective temperature and surface gravity similar to the blue tail stars in NGC 6752. Their helium abundances are also similar to those observed in NGC 6752, indicating that the gravitational settling of helium has been equally efficient in both clusters. Thus, the helium-poor stars brighter than the gap at V agree with the predictions of canonical HB evolution.
The two helium-poor stars hotter than 40,000 K, W8750 and W9863, appear to be in a post-HB evolutionary state This can be seen in Fig. 9, where we compare the stellar parameters of these stars with HB and post-HB evolutionary tracks for canonical models, flash-mixed models with a thin hydrogen surface layer, and flash-mixed models with no envelope hydrogen. W9863 appears to lie along the hottest canonical post-HB track at a point where the evolution is relatively slow. However, things are less simple for W8750. While it lies close to the post-HB track of a late hot flasher with a 10-5 hydrogen surface layer, it also lies at a point where the evolution is rapid. Moreover, it is difficult to understand why W8750 has a helium-poor surface when the other stars with possible flash mixing are much more helium-rich. In order to place it on the least massive canonical track (where evolution is slow in this temperature range), its gravity would have to be overestimated by about 0.4 dex, which is about 3.
W23198 is a less clear case: In Figs. 5 and 6 it lies at the cool end of the population of helium-enriched stars, but well separated from the canonical EHB stars. Judging from its position in Fig. 9, W23198 may be a late hot flasher with very high hydrogen content and/or effective diffusion or an example for shallow mixing (see below).
4.2 Helium-Rich Stars
The parameters of the helium-rich stars provide support to the late hot flasher scenario: Figs. 5 and 6 show that a gap between 31,000 K to 35,000 K separates the helium-rich from the helium-poor stars, as predicted by the flash-mixing scenario. The HB track for the early hot flasher in Fig. 5 passes through the temperature gap, but the evolution is then very fast, making a contamination of the temperature gap by such stars unlikely (Moehler et al. mosw02 (2002)). In addition, Fig. 6 shows the expected clustering of the helium-rich stars between 35,000 K and 40,000 K.
Contrary to the predictions of Brown et al. (brsw01 (2001)) and Cassisi et al. (casc03 (2003)), but consistent with our previous results for Cen, the atmospheres of the blue hook stars still show some hydrogen. This result has been discussed by Cassisi et al. (casc03 (2003)), who find that to reproduce even the highest observed helium abundances, they have to reduce the efficiency of the flash mixing by a factor of about 20,000. However, this reduction only applies if the observed helium abundances reflect the actual helium abundances in the envelopes of the blue hook stars.
This apparent discrepancy could be explained if some residual hydrogen survived flash mixing and later diffused outward, thus producing a thin hydrogen-rich layer at the surfaces of the blue hook stars. Such diffusive processes are believed to be responsible for the low helium abundances of the sdB stars and are estimated to operate on a time scale much shorter than the HB lifetime. It is unclear, however, if diffusion will turn a helium-rich star into a helium-poor one. Groth et al. (grku85 (1985)) found that atmospheric convection (which would work against diffusion) can exist in hot subdwarfs if the helium abundance is sufficiently high. Also mass loss might affect the atmospheric abundances of the blue hook stars by reducing the efficiency of the hydrogen diffusion. The low helium abundances observed for canonical EHB stars, however, suggest that mass loss does not prevent the formation of a hydrogen surface layer. The range in the hydrogen abundances of the blue hook stars might indicate that varying amounts of hydrogen survive flash mixing or that the efficiency of diffusion differs from star to star. In any case the high helium abundances observed in some of the blue hook stars would be difficult to understand if their atmospheres were not enriched in helium during the helium core flash. The increase in the mean atmospheric helium abundance with increasing effective temperature is also consistent with flash mixing. As can be seen in Fig. 5, adding a hydrogen layer to the surface of a late hot flasher moves the track towards lower temperatures and gravities (see Moehler et al. mosw02 (2002) for more details). The addition of a hydrogen layer of 10-4 M⊙ would actually improve the agreement between the predicted and observed temperatures of the blue hook stars while at the same time preserving the temperature gap between these stars and the canonical EHB stars.
Another possibility for explaining the hydrogen abundances of the blue hook stars has been discussed by Lanz et al. (labr03 (2003)), who found that there are two types of flash mixing: “deep” and “shallow”, depending on how far the envelope hydrogen is mixed into the core during a late helium-core flash. During deep mixing the envelope hydrogen is mixed all the way into the high temperature regions near the site of the helium flash and therefore rapidly burned. This is the type of mixing discussed by Brown et al. (brsw01 (2001)) and Cassisi et al. (casc03 (2003)). A blue hook star following deep mixing will be helium- and carbon- rich with very little hydrogen left in its atmosphere. In contrast, during shallow mixing the envelope hydrogen is only mixed with the outer layers of the core. Since the temperatures within these layers are too low for proton-capture nucleosynthesis, all of the envelope hydrogen will survive the flash-mixing phase. The surface composition of a blue hook star following shallow mixing will therefore remain hydrogen-rich, although its surface composition will be diluted by helium- and carbon-rich material from the core. Unfortunately the calculations of Lanz et al. (labr03 (2003)) indicate that shallow mixing only occurs over a very narrow range of mass loss in metal-poor stars. Thus, while shallow mixing may be a viable explanation for the residual hydrogen found in some field He-rich sdB stars (Lanz et al. labr03 (2003)), it is probably of minor importance for the blue hook stars in NGC 2808. A detailed study of metal abundances might be able to distinguish the signatures of shallow mixing from those of diffusion.
5 Conclusions
The high temperatures and high helium abundances reported here for the blue hook stars in NGC 2808 and Cen provide general support for the flash-mixing scenario of Brown et al. (brsw01 (2001)). The three most helium-rich stars in NGC 2808 also show evidence for carbon enrichment. However, all of our targets show some hydrogen in their atmospheres, and only one target in each cluster has . This is partially a selection effect, as our targets are preferentially the brighter blue hook stars, and the most helium-rich star in each cluster is either the faintest (W20334 in NGC 2808) or second-faintest (D10763 in Cen). However, it is also likely that some hydrogen survives a late hot flash, and subsequently diffuses to the surface during the HB phase.
Moehler et al. (1997a ) reported an isolated helium-rich sdB star in M15 with the expected properties ( = 36,000 K, MV = , = +0.82) of a flash-mixed star. However, significant numbers of blue hook stars have been found only in the most massive Galactic globular clusters: Cen (MV = ), NGC 2808 (MV = ), NGC 6388 (MV = ), and possibly NGC 6441 (MV = ), all data for MV from Harris (harr96 (1996)). Other globular cluster in the same mass regime are 47 Tuc (MV = ), NGC 2419 (MV = ), and NGC 6715 (MV = ). The optical colour-magnitude diagrams of NGC 2419 (Harris et al. habe97 (1997)) and NGC 6715 (Momany, priv. comm., Rosenberg et al. rore03 (2003)) show stars faint enough to be blue hook stars. The situation for 47 Tuc is unclear due to contamination by the Small Magellanic Cloud.
Apparently the number of blue hook stars depends on the total mass of the globular cluster and not on the number of other hot HB stars (see Rosenberg et al. rore03 (2003) for an independent discussion of this effect). For instance, NGC 6752, which is a factor of 100 less luminous than NGC 2808 and has a very long and well populated blue tail, contains 59 EHB stars with (photometry of Buonanno et al. buca86 (1986)), compared to 34 such stars observed in NGC 2808 (photometry from Walker walk99 (1999)). Even more EHB stars can be seen in the data of Momany et al. (mopi02 (2002)) for NGC 6752. However, while NGC 2808 has 28 blue hook stars with , no such stars are found in NGC 6752. Likewise, the UV colour-magnitude diagram of Brown et al. (brsw01 (2001)) shows that the population of blue hook stars dominates over the population of EHB stars in NGC 2808 (46 vs. 29 stars, respectively). As the mass loss ranges populating the hot end of the canonical extreme HB and the blue hook region are not too different, it is hard to understand why globular clusters with large numbers of canonical EHB stars do not show at least some blue hook stars as well.
Acknowledgements.
We appreciate the efforts of the staff at Paranal in performing the observations. We are grateful to Uli Heber for his remarks about convection and to Ralf Napiwotzki for his model atmospheres, fit routines and help with W21882. We thank the referee S. Cassisi for valuable suggestions and a very timely referee report. SM thanks the DFG for a travel grant (444 USA 111/4/03).References
- (1) Bedin, L.R., Piotto, G., Zoccali, M., Stetson, P.B., Savianne, I., Cassisi, S., Bono, G. 2000, A&A, 363, 159
- (2) Bergeron, P., Saffer, R.A., Liebert, J. 1992, ApJ, 394, 228
- (3) Brown, T.M., Sweigart, A.V., Lanz, T., Landsman, W.B., Hubeny, I. 2001, ApJ, 562, 368
- (4) Buonanno, R., Caloi, V., Castellani, V., Corsi, C.E., Fusi Pecci, F., Gratton, R. 1986, A&AS, 66, 79
- (5) Busso, G., Piotto, G., Cassisi, S. 2003, HST multiband photometry of the globular cluster NGC 6388, to appear in MemSAI (astro-ph/0308341)
- (6) Cassisi, S., Schlattl, H., Salaris, M., Weiss, A. 2003, ApJ, 582, L43
- (7) Castellani, M., Castellani, V. 1993, ApJ, 407, 649
- (8) D’Cruz, N.L., Dorman, B., Rood, R.T. 1996, ApJ, 466, 359
- (9) D’Cruz, N.L., O’Connell, R.W., Rood, R.T., et al. 2000, ApJ, 530, 352
- (10) Gössl, C. & Riffeser, A. 2002, A&A, 381, 1095
- (11) Groth, H.G., Kudritzki, R.P., Heber, U. 1985, A&A, 152, 107
- (12) Hamuy, M., Walker, A.R., Suntzeff, N.B., et al. 1992, PASP, 104, 533
- (13) Harris, W.E., 1996 AJ, 112, 1487 (version February 2003)
- (14) Harris, W.E., Bell, R.A., VandenBerg, D.A., et al. 1997, AJ, 114, 1030
- (15) Heber, U., Reid, I.N., Werner, K. 2000, A&A, 363, 198
- (16) Horne, K. 1986, PASP, 98, 609
- (17) Kurucz, R.L. 1993, ATLAS9 Stellar Atmospheres Program and 2 km s-1 grid, CD-ROM No. 13, http://kurucz.harvard.edu/
- (18) Lanz, T., Brown, T.M., Sweigart, A.V., Hubeny, I., Landsman, W.B. 2003, ApJ, in press (astro-ph/0308440)
- (19) Lemke, M., Heber, U., Napiwotzki, R., Dreizler, S., Engels, D. 1997, New Results from the Stellar Component of the Hamburg Schmidt Survey: A Sample of sdO Stars, in The Third Conference on Faint Blue Stars, ed. A.G.D. Philip, J. Liebert & R.A. Saffer (Schenectady: L. Davis Press), 375
- (20) Moehler, S., Heber, U., Durrell, P. 1997a, A&A, 317, L83
- (21) Moehler, S., Heber, U., Rupprecht, G. 1997b, A&A, 319, 109
- (22) Moehler, S., Landsman, W., Napiwotzki, R. 1998, A&A, 335, 510
- (23) Moehler, S., Sweigart, A.V., Landsman, W.B., Heber, U. 2000, A&A, 360, 120
- (24) Moehler, S., Sweigart, A.V., Landsman, W.B., Dreizler, S. 2002, A&A 395, 37
- (25) Momany, Y., Piotto, G., Recio-Blanco, A., Bedin, L.R., Cassisi, S., Bono, G. 2002, ApJ, 576, L65
- (26) Napiwotzki, R. 1997, A&A, 322, 256
- (27) Napiwotzki, R., Green, P.J., Saffer, R.A. 1999, ApJ, 517, 399
- (28) Rosenberg, A., Recio-Blanco, A., García-Marín, M., 2003, ApJ submitted
- (29) Saffer, R.A., Bergeron, P., Koester, D., Liebert, J. 1994, ApJ, 432, 351
- (30) Sosin, C., Dorman, B., Djorgovski, G., et al. 1997, ApJ, 480, L35
- (31) Stecher, T.P., Cornett, R.H., Greason, M.H., et al. 1997, PASP, 109, 584
- (32) Sweigart, A.V. 1997, Helium mixing in globular cluster stars, in The Third Conference on Faint Blue Stars, ed. A.G.D. Philip, J. Liebert & R.A. Saffer (Schenectady: L. Davis Press), 3
- (33) Sweigart, A.V., Brown, T.M., Lanz, T., Landsman, W.B., Hubeny, I. 2002, The Origin of Hot Subluminous Horizontal-Branch Stars in Centauri and NGC 2808, in Centauri: a Unique Window into Astrophysics, ed. F. van Leeuwen, G. Piotto & J. Hughes (San Francisco: ASP), p. 261
- (34) Tüg, H. 1977, ESOMe, 11, 7
- (35) Walker, A.R. 1999, AJ, 118, 432
- (36) Werner, K. 1996, ApJ, 457, L39
- (37) Werner, K., Dreizler, S. 1999, The Classical Stellar Atmosphere Problem, in The Journal of Computational and Applied Mathematics, Volume 109, eds. H. Riffert & K. Werner, Elsevier Press, Amsterdam, p. 65