00 \Year0000 \Month00 \Pagespan000000 \lhead[0]K. Jahnke et al.: Integral field spectroscopy of QSO host galaxies \rhead[Astron. Nachr./AN XXX (200X) X]0 \headnoteAstron. Nachr./AN 32X (200X) X, XXX–XXX
http://www.aip.de/jahnke/
Integral field spectroscopy of QSO host galaxies
Abstract
We describe a project to study the state of the ISM in 20 low redshift () QSO host galaxies observed with the PMAS integral field spectrograph. We describe method developement to access the stellar and gas component of the spectrum without the strong nuclear emission to access the host galaxy properties also in the central region. It shows that integral field spectroscopy promises to be very efficient to study the gas distribution and its velocity field, and also spatially resolved stellar population in the host galaxies also of luminous AGN.
keywords:
techniques: spectroscopic — galaxies: active — quasars: emission lines — galaxies: ISM1 Introduction
The vast majority of QSO host galaxy studies uses imaging techniques to investigate photometry, the morphological composition, signs for tidal interaction and star formation, companions or clustering. With imaging it is possible to constrain the types of the host galaxies which turned out to be dependent on the luminosity of the nucleus (e.g. McLeod & Rieke, 1995), or vice versa. Using imaging photometry we recently found signs for bluer colours in elliptical host galaxies (Jahnke & Wisotzki, 2003) and obtained the first luminosity function of host galaxies (Kuhlbrodt et al., 2001; Kuhlbrodt, 2003). Imaging studies showed also e.g. that interaction seems to play a major role in a significant fraction of intermediately luminous host galaxies, but clearly not in some parts of the high luminosity regime (Dunlop et al., 2003).
Imaging was and is successful from the closest AGN up to high redshifts and by now some standard analysis methods have emerged, like two-dimensional modelling of the surface brightness distribution of nucleus and host galaxy. This allows to determine and remove the nuclear contribution to access the light of the host alone – being the fundamental problem of host galaxy studies.
Spectroscopy in comparison is used only in a few studies. The application of spectroscopy is even stronger constrained than imaging by the presence of the bright nucleus. Studies are in most cases restricted to the outer part of the host galaxy, away from the light emitted by the nucleus – so the inner parts of host galaxies were unaccessible. Placing a slit across the nucleus, the obvious choice for an investigation of the inner part of the host, would as a disadvantage have integrated most of the point like nuclear flux, but only very little of the host galaxies and thus leading to an unfavorable contrast. Only very recently, newly developed techniques involving deconvolution (Courbin et al., 2002) and again spatial modelling of the light distribution (Jahnke, 2002) made on-nuclear spectroscopy feasible, with some success.
We want to describe here an approach using integral field units for efficient spectroscopy of quasar host galaxies, combining imaging and spectroscopy in one observation. While the analysis is just fully beginning, we want to present our goals, the data obtained and, in Section 4, a technique and an example for the removal of the nuclear light, required for studying the inner parts of the host galaxies.
2 Main science drivers
The study we describe in the following was triggered by a number of independent questions, each connecting the active nucleus and the surrounding host galaxy:
-
•
It is still unclear how AGN are fueled. The widespread idea of an environmental triggering event e.g. by major or minor mergers is, however, still not proven. Tidal events should leave traces in the morphology of the host galaxies. Postulating this as the sole mechanism for activity is challenged by existence of seemingly completely symmetric and undisturbed host galaxies.
-
•
How does the the strong UV and optical nuclear radiation influence the conditions in the host galaxy? Feedback of high-luminosity radiation of the nucleus into the host will ionise existing ISM.
-
•
Besides ionisation by the nucleus, is there evidence for star-formation, maybe created by interaction?
-
•
If some of the UV radiation gets absorbed in the ISM of the host, does any of it escape? At earlier epochs QSOs contributed a large fraction of the metagalactic UV background. Low redshift AGN provide the ideal laboratory to study the escape mechanisms in detail.
-
•
While the unified model of AGN (Urry & Padovani, 1995) predicts an absorbing dust torus around the central engine to create a line-of-sight dependent family of type 1 and 2 AGN, there is no a priori requirement for an alignment of such a torus with any component of the host galaxy. Do low redshift disk-type QSO host galaxies show ionisation cones produced by the ‘shadow’ of such a torus, thus e.g. pointing to a non-alignment of torus and a stellar disk?
-
•
Are there dynamical traces for merger events in the host judging from dynamical information extracted from emission line shifts?
The processes behind these questions all leave traces in the ISM of the host galaxy in the shape of the two-dimensional distribution of ionisation states and gas velocity fields. For efficient observation of these properties IFS promises to be less time consuming than combinations of long slit spectroscopy or narrow band imaging.
3 Sample and observations
We selected a sample of approximately 40 low redshift () quasars from the Palomar-Green (PG, Schmidt & Green, 1983) and Hamburg/ESO (Wisotzki et al., 2000) surveys with band magnitudes in the range . The PG objects have previously been studied by others using broad band imaging (McLeod & Rieke, 1995).
PMAS, the Potsdam Multiaperture Photospectrometer, available as a common user instrument at the Calar Alto 3.5m telescope, showed to be well suited for this project. PMAS is a fibre fed integral field spectrograph with a 1616 lenslet array and covering a FOV of 88 with a spaxel size of 05 (described in detail in Roth et al., 2000). We observed about half of this sample in two campaigns in 09/02 and 05/03, using the V300 grisms giving a spectral resolution of Å. The grating was rotated to an angle to observe the H/[O III] and H/[N II] regions simultaneously, and we used integration times on target of typically 1–2 h, split into several individual integrations for cosmic ray removal. During the campaigns the seeing was strongly varying between 08 and 17.
The data extraction and reduction of the spectra was done with P3D_online, an IDL based software package created at the AIP for reduction of 3d data, from PMAS in particular (Becker, 2001). Analysis of the data is in the starting stage.

4 3d analysis methods
3d spectroscopy potentially allows the synergy of advantages of diagnostics from imaging and spectroscopy. It allows to switch between spectral and imaging representation depending on the application as well as creating completely new representations like 2d velocity fields from a single observation. However, for this to work new analysis techniques are required. As mentioned, the central challenge when investigating QSO host galaxies compared to inactive galaxies is the active nucleus. Being very luminous – up to several times the host galaxy luminosity – it appears as a bright point source in the centre of the host. With a finite PSF size it outshines some portion of the host galaxy, requiring to remove a large fraction of the nuclear contribution before the underlying stellar and nebular contributions become accessible to analysis. We want to sketch in the following two ideas for nucleus removal in the context of IFS.
4.1 Line emission vs. continuum
Today the fields of view of IFU instruments are relatively small, for imaging type applications . Effectively this prevents the simultaneous observation of a nearby star to determine from its spatial light distribution the PSF at the moment of observation. Taking PG 0052+251 in Fig. 1 as an example111Full reduction and results on PG 0052+251 as well as the other objects in the sample will be presented in an upcoming paper., the host already largely fills the FOV.
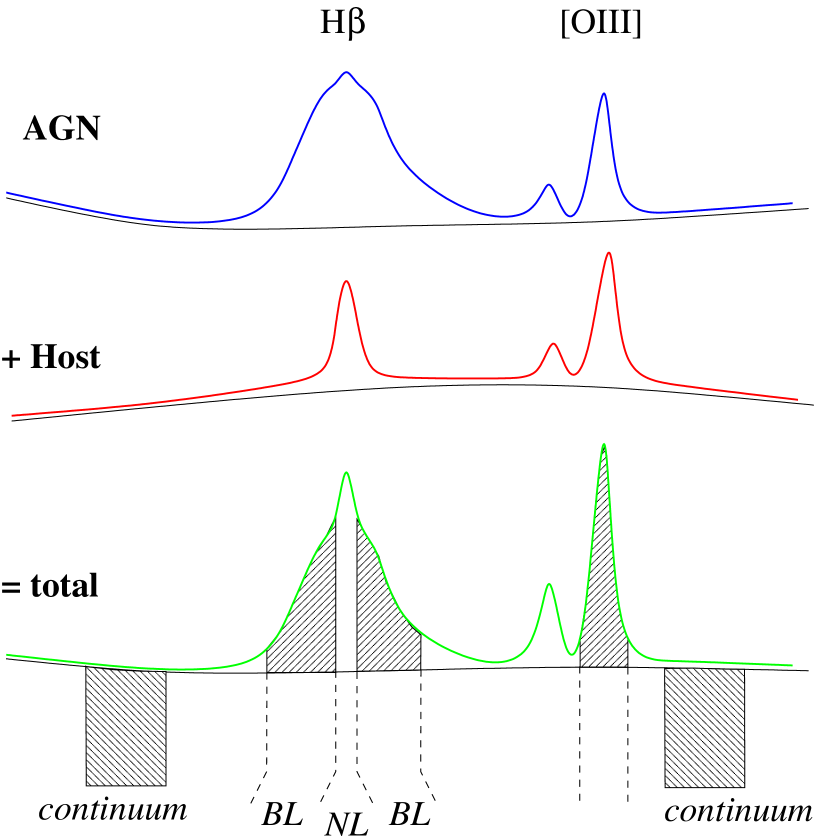


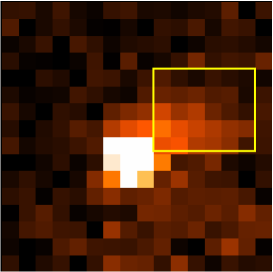
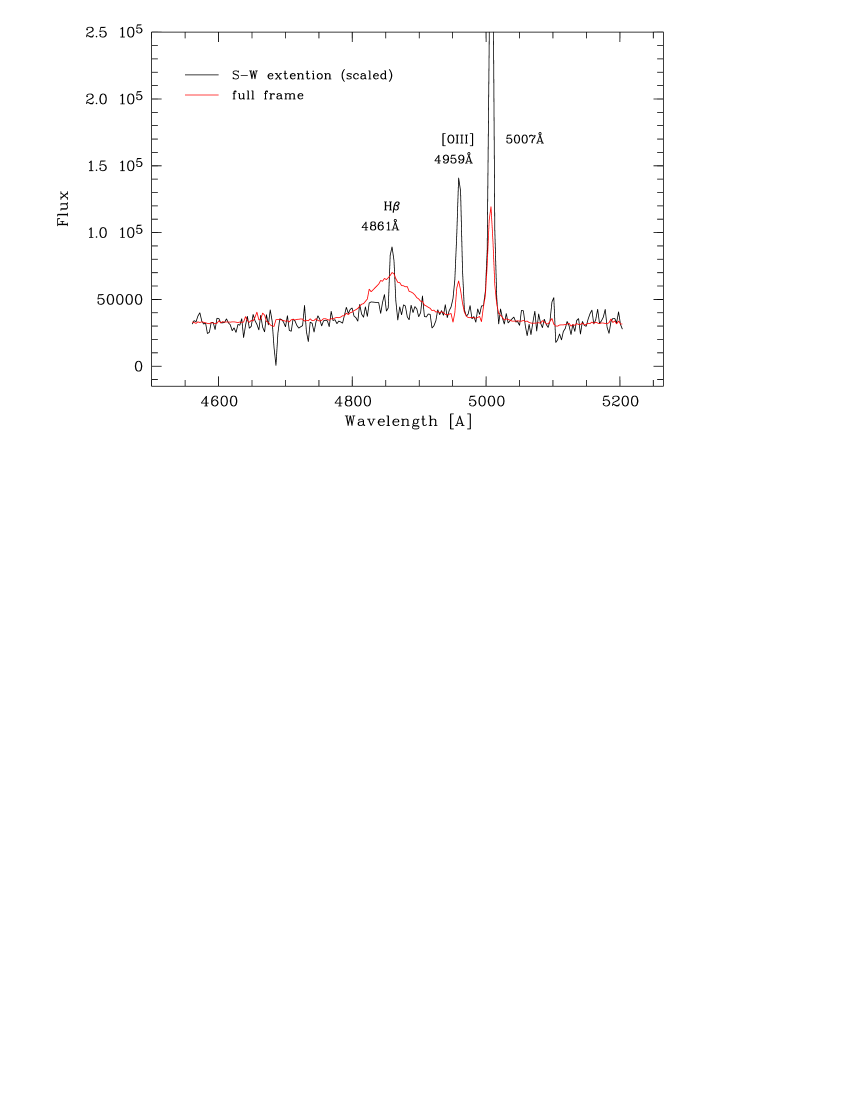
Without the PSF available, it is still possible to extract information on ionisation structure in the host by creating pure line emission image slices. The total spectrum of the QSO is a mix of almost pure nuclear continuum emission and lines from nucleus and the ISM of the host (red line in Fig. 4). Using PMAS as a tunable narrow band filter, we coadded the monochromatic slices of the [O III] region and a nearby line-free continuum region as illustrated in Fig. 2 to produce a pure [O III] line image (Fig. 3). Besides the nuclear component it shows an assymetric extention. Coadding the spectra in this region shows no more broad component in the H region, only a narrow component is left over (Fig. 4). Thus we have no contamination from the nuclear light. Measuring the emission line ratio we find a value of 1.0, typical for excitation of oxygen by an AGN type power-law spectrum and not by star formation.
4.2 PSF determination from QSO science frame
Even though in this way we can receive already some information about emission line structure, quantitative studies of the host galaxy or ISM are not possible by simple continuum removal. In case of PMAS there exist two possibilities to construct a PSF for removing the complete nuclear contribution. The first – to be investigated in the near future – is the mapping of the PMAS-internal autoguider camera PSF to the spectrograph. This will allow the determination of a high precision PSF if sufficient numbers of point sources have been observed to calibrate the system for different atmospheric and instrumental conditions.
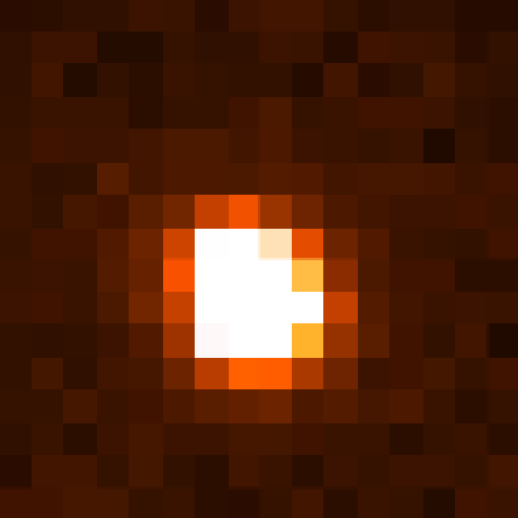

The second is only possible for QSOs but is independent of the AG camera: a single component in the spectrum of a QSO is solely due to the active nucleus: the broad line emission of e.g. the Balmer lines. In our case H and H have a core of a mix of narrow line and broad line emission, but the wings are purely nuclear emission as sketched in Fig. 2. Adding up the corresponding image slices and subtracting an appropriate background frame removes all of the contained host and nuclear continuum emission, resulting in a pure PSF (left panel of Fig. 5).
To recreate a 3d PSF from this 2d image can be done by creating an image cube from this single frame, scaling its flux with an approximated ‘purely nuclear’ 1d spectrum that can be obtained by extracting a spectrum from the centermost few pixels in each slice, where the nucleus strongly dominates (Fig. 5, right panel). Strictly speaking the 2d PSF is only valid for the spectral position from where it was taken, in our case the H region. When recreating the 3d PSF in this way both change in center from atmospheric differential diffracion as well as the wavelength dependent width of the PSF should be taken into account. This can be done e.g. by interpolating between the PSFs from different broad lines or a computational broadening according to a theoretical seeing model.
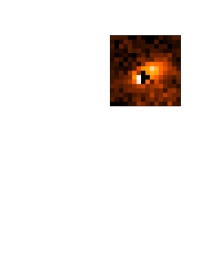
When subtracting this PSF from the [O III] frame in Fig. 3, we receive the image shown in Fig. 6. The frame shows adjacent positive and negative residuals of the order of %, due to a slight mismatch in centering. The very central parts of PSF subtracted frames will remain with residual contamination from the strong PSF from small PSF errors and show a much higher noise. Visible is extended [O III] emission apart from the structure seen before, to the right and bottom. This is the trace of extended ISM gas, ionised by the nucleus. This image can now be used to measure emission line ratios and shifts to create maps of the ionisation source and the velocity structure in the host galaxy.
5 Summary
It is clear that 3d spectroscopy requires new methods for analysis also for the application to the study of AGN host galaxies. As we described it is possible to remove the light of the active nucleus and to extract information on the host galaxy alone, allowing the use of techniques as for inactive galaxies. In this way 3d spectroscopy becomes extremely powerful for the study of QSO host galaxies. Spatially resolved spectral information can be the key in the search for traces in the dynamic and ionisation state of the ISM in host galaxies, to yield information on the role of merger and interaction in the fuelling process.
References
- Bahcall et al. (1996) Bahcall, J. N., Kirhakos, S., & Schneider, D. P.: 1996, ApJ, 457, 557
- Becker (2001) Becker, T. 2001, PhD thesis, Astrophysical Institute Potsdam
- Courbin et al. (2002) Courbin, F., et al.: 2002, A&A, 394, 863
- Dunlop et al. (2003) Dunlop, J. S., et al.: 2003, MNRAS, 340, 1095
- Jahnke (2002) Jahnke, K. 2002, PhD thesis, University of Hamburg, http://www.sub.uni-hamburg.de/disse/726/dissertation.pdf
- Jahnke & Wisotzki (2003) Jahnke, K. & Wisotzki, L.: 2003, MNRAS (accepted), astro-ph/0308177
- Kuhlbrodt (2003) Kuhlbrodt, B.: 2003, PhD thesis, University of Hamburg, http://www.sub.uni-hamburg.de/disse/1036/dissertation.pdf
- Kuhlbrodt et al. (2001) Kuhlbrodt, B., Wisotzki, L., & Jahnke, K.: 2001, in QSO Hosts and their Environments,, ed. I. Márquez et al. (Kluver Academic/Plenum Publishers), 347
- McLeod & Rieke (1995) McLeod, K. K. & Rieke, G. H.: 1995, ApJ, 454, L77
- Roth et al. (2000) Roth, M. M., et al.: 2000, in SPIE, Vol. 4008, 277
- Schmidt & Green (1983) Schmidt, M. & Green, R. F.: 1983, ApJ, 269, 352
- Urry & Padovani (1995) Urry, M. C. & Padovani, P.: 1995, PASP, 107, 803
- Wisotzki et al. (2000) Wisotzki, L., et al.: 2000, A&A, 358, 77