00 \Year0000 \Month00 \Pagespan000000 \lhead[0]R. McDermid et al.: OASIS High-Resolution Integral Field Spectroscopy of the SAURON Ellipticals and Lenticulars \rhead[Astron. Nachr./AN XXX (200X) X]0 \headnoteAstron. Nachr./AN 32X (200X) X, XXX–XXX
2CRAL, 9 Avenue Charles André, 69230 Saint-Genis-Laval, France
3Space Telescope European Coordinating Facility, ESO, Karl-Schwarzschild-Str. 2, 85748 Garching, Germany
4Columbia Astrophysics Laboratory, 550 West 120th Street, 1027 Pupin Hall, MC 5247, New York, NY 10027, USA
5Institut de Physique Nucléaire de Lyon, 69622 Villeurbanne, France
6Denys Wilkinson Building, University of Oxford, Keble Road, Oxford, United Kingdom
7Kapteyn Institute, Postbus 800, 9700 AV, Groningen, The Netherlands
OASIS High-Resolution Integral Field Spectroscopy of the SAURON Ellipticals and Lenticulars
Abstract
We present a summary of high-spatial resolution follow-up observations of the elliptical (E) and lenticular (S0) galaxies in the SAURON survey using the OASIS integral field spectrograph. The OASIS observations explore the central 8\arcsec10\arcsecregions of these galaxies using a spatial sampling four times higher than SAURON, often revealing previously undiscovered features. Around 75% (31/48) of the SAURON E/S0s with central velocity dispersion were observed with OASIS, covering well the original SAURON representative sample. We present here an overview of this follow-up survey, and some preliminary results on individual objects, including a previously unreported counter-rotating core in NGC 4382; the decoupled stellar and gas velocity fields of NGC 2768; and the strong age gradient towards the centre of NGC 3489.
keywords:
galaxies:NGC 2768, NGC 3489, NGC 4382, elliptical and lenticular, kinematics and dynamics, stellar contentmcdermid@strw.leidenuniv.nl
1 Introduction
The SAURON project (de Zeeuw et al. 2002) is a study of the structure of 72 representative nearby early-type galaxies and spiral bulges based on measurements of the two-dimensional stellar kinematics and distribution of absorption line-strengths, together with the kinematics and distribution of ionized-gas, measured with SAURON, a panoramic integral-field spectrograph (IFS) mounted at the William Herschel Telescope (WHT), La Palma (Bacon et al. 2001). The aims of this survey and the observed galaxy sample are described in de Zeeuw et al. (2002). The stellar kinematic maps for the sub-sample of 48 E/S0s is presented in Emsellem et al. (2003).
To provide a large field of view, the spatial sampling of SAURON was set to 094094 (per lenslet) for the survey, therefore often undersampling the typical seeing at La Palma (08 FWHM). This does not, in principle, affect the results for the main-body of early-type galaxies, as they generally exhibit smoothly-varying structure on scales larger than the seeing. Towards the galaxy nucleus, however, there are often sharp, localised features in the kinematics, such as decoupled cores or central disks, as well as distinct stellar populations and ionized-gas distributions. Such features may be only partially resolved in the SAURON data, and in some cases are not even visible.
In addition, at HST resolution, all elliptical galaxies exhibit power-law central luminosity profiles: , with clear trends between the nuclear luminosity profiles and certain global properties, such as the degree of rotational support, isophotal shape, and stellar populations. It is therefore crucial to fill the gap between the medium (few 100s of pc) to large-scale (few kpc) structures probed with SAURON and the inner ( pc) components probed by HST. We have thus conducted a complimentary study on a subset of the SAURON sample using the OASIS (Optically Adaptive System for Imaging Spectroscopy) spectrograph, mounted on the Canada-France-Hawaii Telescope (CFHT), Hawaii.
2 The OASIS Spectrograph
OASIS is an IFS based on the TIGER concept (Bacon et al. 1995) and is designed for high spatial resolution observations. It is a multi-mode instrument, with both imaging and IFS capabilities, and can be assisted by an adaptive optics (AO) system. OASIS operated at the Cassegrain focus of the CFHT since 1997 (with the PUEO AO system), but was recently transferred to the Nasmyth focus of the WHT behind the NAOMI AO system (March 2003). All observations presented here were obtained at the CFHT, hence in the following we solely refer to the OASIS CFHT configurations.
The imaging mode of OASIS is used primarily for accurate target acquisition. There is a selection of gratings and filters within OASIS, giving low and medium spectral resolution modes within the 0.43 m to 1 m wavelength range. Via the use of different enlargers, there is also a range of spatial sampling, from 0404 lenslets covering a 15\arcsec12\arcsec field, down to 004004 sampling across a 1512 field, for use with adaptive optics. Since most of the objects in the SAURON sample of E/S0s do not have a bright enough nearby guiding source (), we decided to use the (no AO) mode of OASIS. We still chose a rather small spatial scale of 027027 per lenslet for the observations to properly sample the generally excellent seeing at Mauna Kea, providing over 1000 individual spectra in a 10\arcsec8\arcsec field-of-view.
As a complimentary data-set to the SAURON survey, OASIS was configured to give similar spectral coverage and resolution as SAURON, resulting in a wavelength range of – Å, with a resolution of 4.2 Å FWHM sampled at Å pix-1. This configuration is suitable for measuring stellar kinematics in early-type galaxies, and also covers key absorption/emission features such as Mg , H, [OIII]4959,5007, and a number of Fe lines.
3 Observed Sample and Data Reduction
3.1 Observed Sample
From the representative sample of the SAURON survey, objects with central velocity dispersion less than the instrumental dispersion of OASIS () were excluded, removing almost all the early-type spiral bulges from the sample, and six of the 48 SAURON E/S0 galaxies. To ensure a homogeneous sample, observational efforts were thus concentrated on the E/S0s of the SAURON survey. Of the remaining 42 galaxies, a total of 31 galaxies were observed with OASIS during three observing runs between March 2001 and April 2002. Figure 1 presents the final observed OASIS sub-sample of the E/S0s of the SAURON survey, and shows that the plane of ellipticity versus absolute -magnitude is covered quite homogeneously by the OASIS sub-sample.

3.2 Data Reduction and Binning
The data were reduced using the publicly available XOASIS software (Rousset 1992) developed at CRAL (Lyon). The reduction steps include bias and dark subtraction, extraction of the spectra using an instrument model, wavelength calibration, low-frequency flat-fielding, removal of cosmic rays, sky subtraction, and flux-calibration. Galaxy observations were composed of two or more exposures, each offset by some small, non-integer number of lenslets to provide oversampling and avoid systematic effects due to bad CCD regions. Multiple exposures were combined by first truncating to a common wavelength region and centering the spatial coordinates on the galaxy nucleus via reconstructed images. Exposures were then re-normalised to account for transparency variations, and resampled onto a common spatial grid of 0202. Co-spatial spectra were then combined via an optimal summing routine, taking into account the error spectra which are propagated through the reduction.
In order to provide reliable, unbiased measurements of stellar kinematic parameters, as well as absorption line strengths, we bin all data to a minimum signal-to-noise ratio () of 60 pixel-1 using the Voronoi 2D-binning developed by Cappellari & Copin (2003).
4 Data Analysis
4.1 Stellar Kinematics
Similarly to Emsellem et al. (2003), stellar absorption-line kinematics were derived for the galaxies by directly fitting the spectra in pixel-space. This method was chosen over Fourier-based methods due to its robustness to contamination by nebular emission lines, which can often be strong in the central regions of early-type galaxies. Using this ‘pixel-fitting’ method (PXF; e.g., van der Marel 1994), emission lines are simply excluded from the fitting process, and only information from emission-free spectral regions is used.
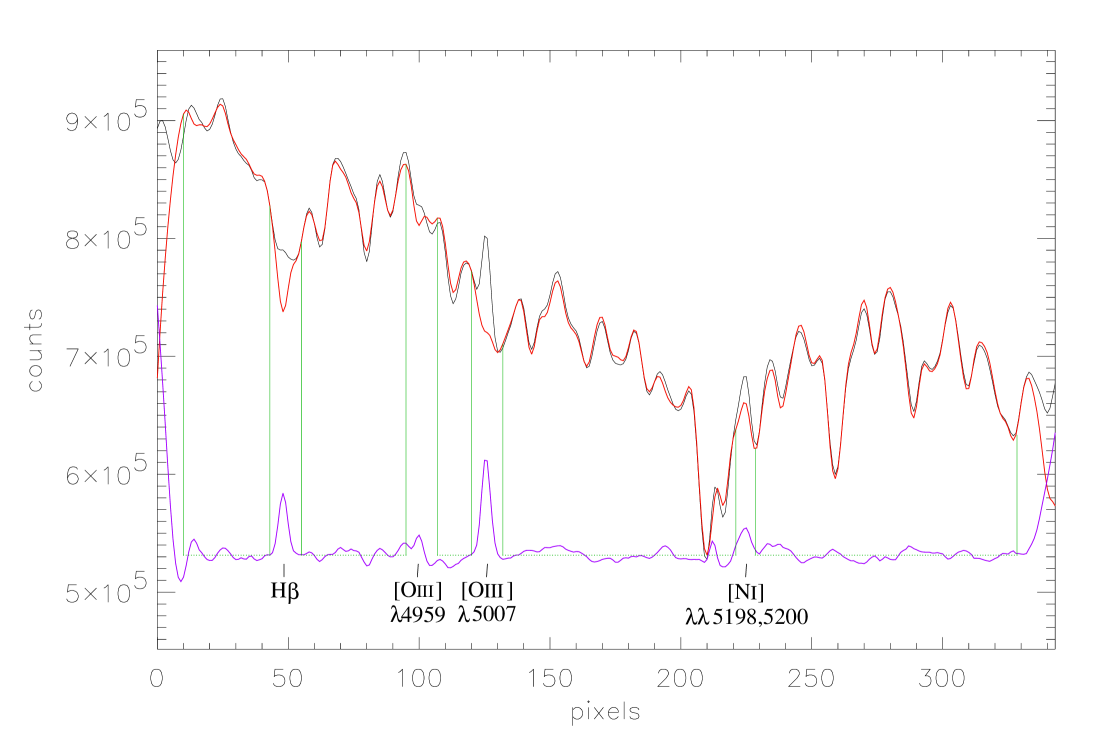
This method can, however, be sensitive to template mismatch effects, which can bias the result. This problem was minimized by selecting an ‘optimal template’ at each iteration of the fitting process. For each trial set of kinematic parameters, an optimal linear combination of appropriately convolved absorption spectra were fitted to the data (Figure 2). The library of absorption spectra used were taken from the single-burst stellar population (SSP) models of Vazdekis (1999), with the addition of several individual stellar spectra with strong Mg to compensate for the near-solar abundance ratio inherent in the SSP models.
4.2 Gas Properties
As a natural by-product of the PXF method employed for the stellar kinematics, the derived optimal template can be used to separate the absorption and emission line components of the data. By subtracting the optimal template, one obtains a residual spectrum in which the significant emission line feature are revealed. We then determine the distribution of the emission features, and measure the kinematics of the ionized-gas, by fitting the emission line profiles of these continuum-free spectra with a simple Gaussian.
4.3 Line Strengths
The OASIS spectral range contains a number of key absorption features which can be used as diagnostic tools to determine the distribution of stellar populations within a galaxy, based on measurements of their age and metallicity. Many of the absorption features in this range can also be significantly altered due to emission features. Therefore, the emission spectrum models (in this case, simple Gaussians) fitted to the residual of the optimal template are subtracted from the original data before measuring the absorption line strengths. Finally, the absorption line strengths are calibrated onto the well-established LICK/IDS system (e.g. Trager et al. 1998).
5 Preliminary Results
5.1 Decoupled Core in NGC 4382
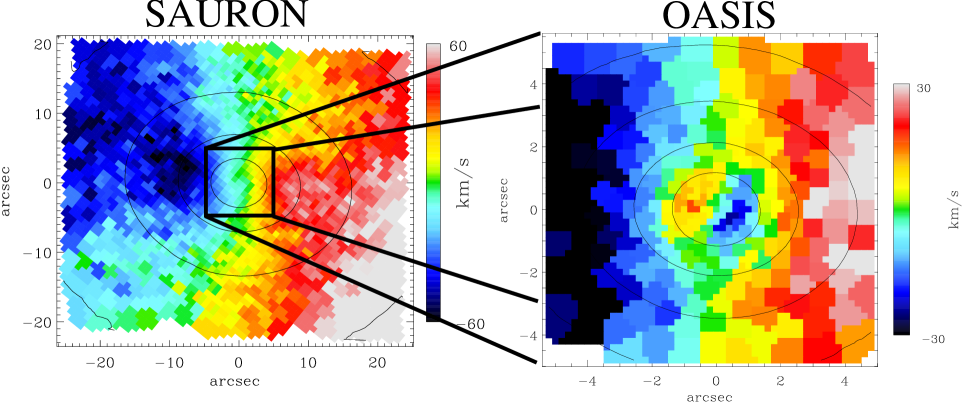
Figure 3 shows an example of how the OASIS data can be used to reveal central features of galaxies in the SAURON survey. The left panel of this figure presents the SAURON velocity field of NGC 4382. There is a low-level ‘kink’ in the zero-velocity contour as it passes through the galaxy centre. The OASIS data (right panel) clearly reveal this as a counter-rotating kinematically decoupled component (KDC), which appears almost aligned with the galaxy’s main body. This KDC was not previously reported in the literature.
5.2 Decoupled Gas and Stellar Kinematics in NGC 2768
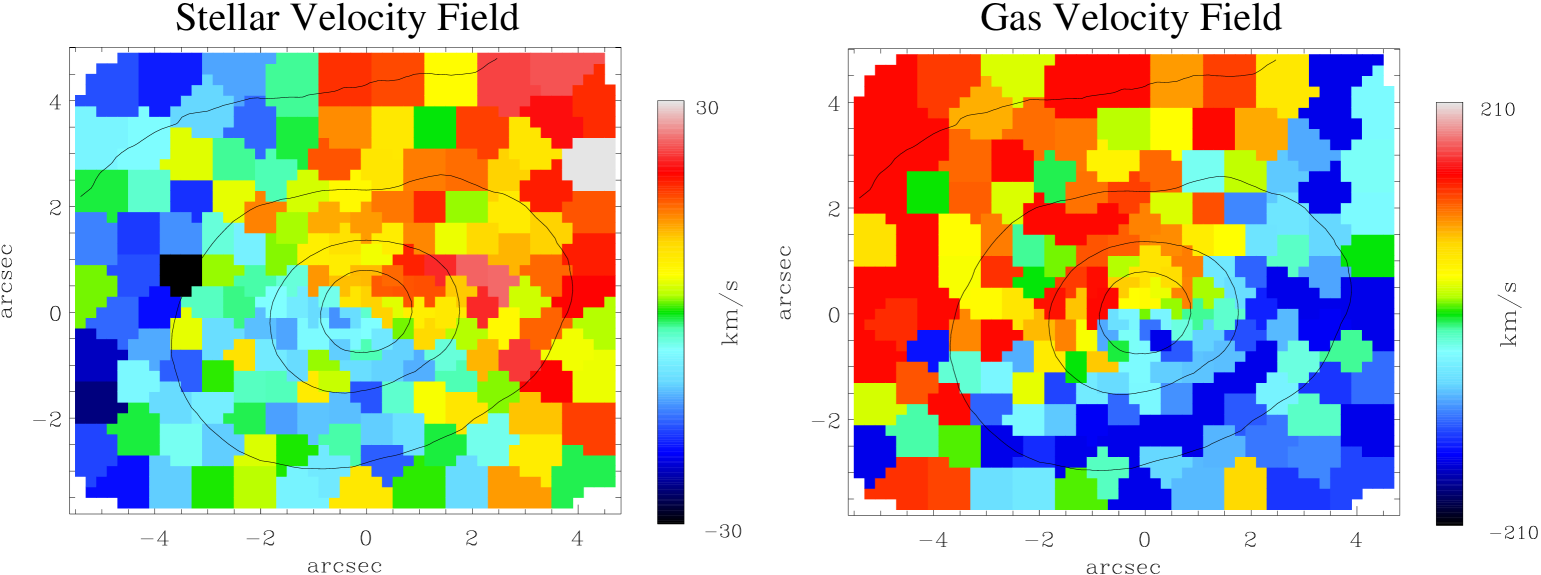
Figure 4 presents the stellar (left panel) and gas (right panel) velocity fields for the polar-ring galaxy NGC 2768. The stellar component rotates around the apparent short-axis of the galaxy. The gas, however, rotates around the apparent long-axis, perpendicular to the stars. This illustrates how we can separate the stellar and gas properties, using the optimal template fit. There is some additional structure in the upper regions of the stellar velocity field, likely due to dust extinction.
5.3 Post-Starburst Galaxy, NGC 3489
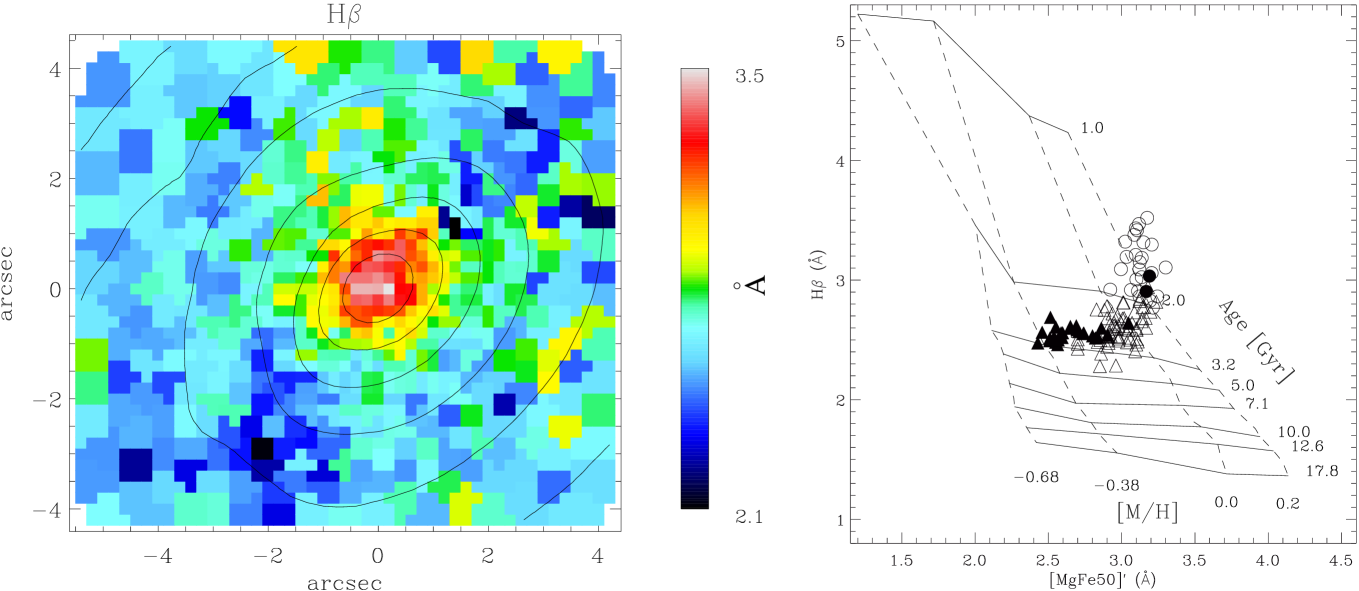
Figure 5 presents a map of H absorption strength for the galaxy NGC 3489 (left panel) which shows a pronounced peak in the central 1\arcsec, indicative of a young central stellar population. The right panel of Figure 5 quantifies this, plotting H absorption strength against the abundance-insensitive metallicity indicator [MgFe50]′111[MgFe50] (Kuntschner et al. in prep.) from the OASIS data. The young stellar population in the core of this galaxy indicates that it is in a post-starburst phase, with a luminosity-weighted age of around 1.5 Gyr. Equivalent SAURON data are also shown, illustrating that both data sets are consistent (see caption for details).
6 Summary and Future Plans
We have conducted extensive high-spatial resolution observations of the E/S0 sub-sample of the SAURON survey using the OASIS IFS. This provides a unique data set on the centres of these galaxies, complimenting the panoramic view delivered by SAURON. We have presented here some preliminary results to illustrate the quality of the data and the analysis techniques we use. The OASIS data set will be published as a complimentary project to SAURON, relating the inner properties of these galaxies with those of the outer regions, as well as providing a high-resolution catalogue of a substantial sample of early-type galaxies. The data will be made publicly available when the final reduction and analysis is complete.
Acknowledgements.
It is a pleasure to thank Pierre Martin for enthusiastic support throughout this observational campaign.References
- [1] Bacon R., Adam G., Baranne A., et al.: 1995, A&AS 113, 347
- [2] Bacon R., Copin Y., Monnet G., et al.: 2001, MNRAS 326, 23
- [3] Cappellari M., Copin Y.: 2003, MNRAS 342, 345
- [4] Emsellem E., Cappellari M., Peletier R.F., et al.: 2003, MNRAS, submitted
- [5] Rousset A.: 1992, PhD, Univ. J. Monnet de Saint-Etienne
- [6] Trager S. C., Worthey G., Faber S. M., Burstein D., Gonzalez J. J.: 1998, ApJS 116, 1
- [7] Vazdekis A.: 1999, ApJ 513, 224
- [8] van der Marel R. P.:1994, MNRAS 270, 271
- [9] de Zeeuw P. T., Bureau M., Emsellem E., et al.: 2002, MNRAS 329, 513