11email: mgomez@astro.puc.cl 22institutetext: Grupo de Astronomía, Departamento de Física, Universidad de Concepción, Casilla 160-C, Concepción, Chile
22email: tom@coma.cfm.udec.cl
The Globular Cluster System of NGC 4374
We study the globular cluster system (GCS) of the giant elliptical NGC 4374 (M84) in the Virgo cluster using B and R photometry. The colour distribution is bimodal with peaks at B-R=1.11 and B-R=1.36, fitting well to those found in other early-type galaxies. The radial profile of the cluster number density is flatter than the galaxy light. Using the luminosity function we derive a distance modulus of , which within the uncertainty agrees with the distance from surface brightness fluctuations. Blue and red clusters show similar radial concentrations and azimuthal distributions. The total number of clusters is , which together with our distance modulus leads to a specific frequency of . This value is surprisingly low for a giant elliptical, but resembles the case of merger remnants like NGC 1316, where the low specific frequency is probably caused by the luminosity contribution of an intermediate-age population. A further common property is the high rate of type Ia supernovae which also may indicate the existence of a younger population. However, unlike in the case of NGC 1316, one cannot find any further evidence that NGC 4374 indeed hosts younger populations. The low specific frequency would also fit to a S0 galaxy seen face-on.
Key Words.:
galaxies: distances and redshifts – galaxies: elliptical and lenticular, cD – galaxies: individual: NGC 4374 – galaxies: interactions – galaxies: star clusters1 Introduction
The study of globular clusters in early type galaxies has reached a state, where surprises have become rare when only individual galaxies are studied. Progress in understanding the relation between the morphology (i.e. the specific frequency of clusters, their spatial as well as their colour distribution) of a GCS and the host galaxy properties normally emerges from analyzing larger galaxy samples (e.g. Kundu & Whitmore kundu01 (2001); Larsen et al. soren01 (2001)) However, from time to time, one encounters galaxies which exhibit some peculiarity in their GCS, which one would like to understand in a more general framework.
For example, it is well known that “normal” elliptical galaxies have specific frequencies higher than about 3 (see Sect. 3.6 for the definition and Elmegreen elmegreen99 (1999) for a review of specific frequencies). NGC 1316, the brightest galaxy in the Fornax cluster, has nevertheless a low specific frequency of only (Grillmair et al. grillmair99 (1999); Gómez et al. gomez01 (2001)). Since it is known as a merger remnant, it is tempting to seek an explanation not in the low number of globular clusters, but in the high luminosity due to the presence of an intermediate-age stellar population which formed in the merger a few Gyrs ago. Indeed, Goudfrooij et al. (goud01a (2001)), by means of spectroscopy of the brightest clusters, identified several intermediate-age globular clusters among them. Also the apparently high SN Ia rate (NGC 1316 hosted SN 1980N and SN 1981D) could indicate a strong intermediate-age population, given that the progenitor population of SNe Ia is suspected to have an age of a few Gyrs (Yungelson et al. yungelson95 (1995); Yoshii et al. yoshii96 (1996); McMillan & Ciardullo mcmillan96 (1996).)
The question arises whether the combination of a low specific frequency and a high SN Ia rate is ubiquitous or whether more examples can be found pointing to the possibility to use the specific frequency as an indicator for the presence of a younger population.
Early-type galaxies, which hosted more than one SN Ia, are rare. Besides NGC 1316, NGC 4374 in Virgo is one of the few ellipticals with two or even three SNe events: 1957B, 1980I (also labeled “intergalactic” due to its location between NGC 4374 and NGC 4406) and 1991bg.
The GCS of NGC 4374 is not well investigated. Ajhar et al. (ajhar94 (1994)) presented VRI photometry of globular clusters for 10 galaxies in Virgo and Leo ellipticals, among them NGC 4374. Due to the small field, properties like the specific frequency or the spatial distribution could not be addressed.
In the light of a possible intermediate-age population, it is worthwhile to investigate in detail the GCS of NGC 4374 with a larger field.
2 Observations, reductions and photometry
2.1 Observations
The observations were carried out at the 3.5m telescope at Calar Alto, Spain, run by the Max-Planck Institute for Astronomy, Heidelberg. The observation period was 19 to 21 March, 1999. The instrument was the focal reducer MOSCA (www.caha.es/CAHA/Instruments/MOSCA/index.html) equipped with a Loral 2K x 2K CCD. The pixel scale was 0.513 ”/pix and the usable unvignetted field of view x (1.5K x 1.5K). The filters in use were Johnson B and R. In the first night several frames, centered on NGC 4374, were acquired, as well as the Landolt fields SA98, SA101 and SA107 at different airmasses. The observation log is given in Table 1.
| night | field | B | R |
|---|---|---|---|
| 19/3/99 | central | 30, 120, 5 x 600 s | 30, 120, 4 x 600 s |
| 20/3/99 | northern | 30, 120, 4 x 600 s | 30, 60, 4 x 600 s |
| 21/3/99 | southern | 120, 5 x 600 s | 60, 6 x 400 s |
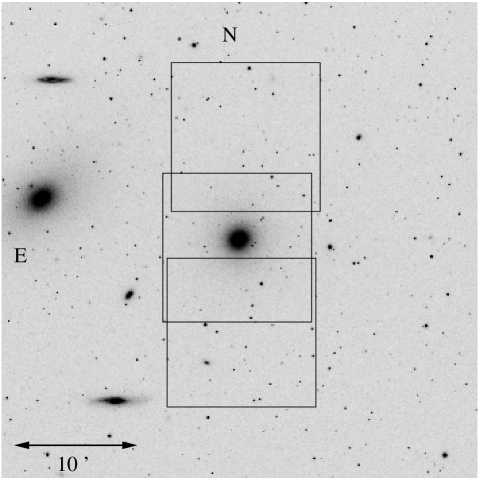
Two additional fields were also observed during the second and third night, with an offset of to the north and south, respectively, as shown in Fig. 1.
Bias subtraction and flat-fielding were performed using standard IRAF procedures, resulting in a flat-field accuracy of about . The images were aligned using the centers of many bright stars as reference points. Bad pixels were replaced by the average of 4 neighboring pixels. After this, we combined typically 5 frames with exposure times ranging from 400 to 600 seconds in both B and R. Cosmics were removed by a -clipping algorithm. The combined frames show a seeing of 1.7” in B and 1.5” in R.
A median filter was then applied to the combined frames to model and subtract the galaxy light.
For the photometry, we used DAOPHOT under IRAF. Daofind was run on each of these frames with a detection threshold of 3 times the of the sky level. We then performed PSF photometry with allstar. The output lists were matched to leave only objects detected in both filters.
For these objects we used the stellarity index of SExtractor (Bertin & Arnouts bertin96 (1996)) for distinguishing star-like objects from galaxies. The stellarity index ranges between 1.0 (star-like) and 0.0 (extended). This classification, however, becomes progressively more uncertain for fainter objects.
As we do not resolve globular clusters at the Virgo distance, no light loss due to a different shape of clusters and stars is observable. An aperture correction was applied in the usual way to calibrate our PSF-photometry with that of the standard stars, which were measured using a much larger aperture.
2.2 The calibration of the photometry
Only the first of 3 nights was photometric. About 40 Landolt (landolt92 (1992)) standard stars were observed at airmasses from 1.0 to 1.8, giving a total of datapoints. Their colour range exceeds that of the globular clusters. We then performed aperture photometry with radii from 4 to 30 pixels. A curve-of-growth was constructed for each standard, and only stars whose instrumental magnitudes converged with increasing aperture radius were selected for the calibration.
The resulting transformation equations are:
| (1) | |||
| (2) |
with the instrumental and standard magnitudes in the B and R filter. is the airmass. The of the fit was 0.029 and 0.027 for and , respectively.
The calibration has been compared with photoelectric aperture photometry of NGC 4374 published by Poulain (poulain88 (1988)), using five aperture sizes. The mean difference was 0.02 mag for each band, without any systematic trend. Local standard stars were then defined in the field to calibrate the non-photometric nights.
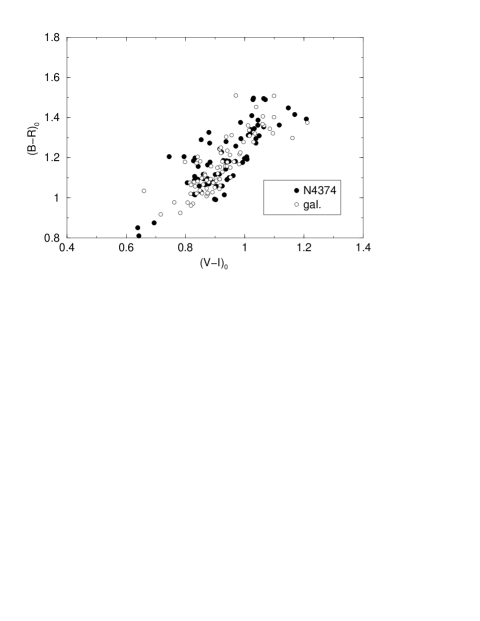
We also compared the R magnitudes of the cluster candidates with about 100 clusters in common with Ajhar et al. (ajhar94 (1994)). The mean difference is 0.006, with a of 0.085. No trend with magnitude is apparent (Fig. 2). Regarding colours, no straightforward comparison is possible. However, we can plot V-I colours of Ajhar et al. versus our B-R colours and ask whether this relation matches the (B-R)-(V-I) relation for galactic globular clusters. This is done in Fig. 3. The agreement is quite satisfactory. A few outliers may be caused by photometric errors.

2.3 Selection of cluster candidates
886 objects have simultaneously been detected in the B and R bands. However, a fraction of them might be foreground stars and background galaxies. To statistically select globular clusters among them, we have used the following set of criteria:
-
i)
-
ii)
-
iii)
uncertainty(B), uncertainty(B-R)
-
iv)
stellarity index
These criteria arise from the assumption that clusters around NGC 4374 should resemble the Galactic ones. Regarding the color range, we have used the McMaster data (Harris harris96 (1996)) and chosen galactic clusters with reddening smaller than , resulting in the above colour limits.
The colours were de-reddened and the magnitudes extinction-corrected using the maps of Schlegel et al. (schlegel98 (1998)). We adopt , and . In the following, only reddening corrected values appear.
2.4 Completeness correction
For the later determination of the globular cluster luminosity function (GCLF) we need to know what fraction of globular clusters is found in each magnitude interval. A common way to evaluate the completeness is to perform artificial star experiments. Many artificial “star-like” objects are added to the frames and the detection, photometry and selection procedures are performed in exactly the same way as with the real cluster candidates. The number of recovered and selected objects per magnitude bin, divided by the initial number of artifical clusters gives an estimation of the completeness correction.
To get sufficiently good statistics, one needs a large number of artificial objects, but care must be taken not to increase the crowding. Therefore, consecutive tests with a small number of artificial objects are preferred.
Using the known PSFs, we added 200 artificial clusters in steps of 0.1 mag, starting from B=20.0 down to B=26.0, and applied the same photometric treatment and selection criteria as we did for the cluster candidates.
We expect the completeness to vary with galactocentric distance because of the radially dependent galaxy light background. However, a decrease in the completeness was only noticed for clusters located between radii of 50 and 150 pixels (2565 and 7695). At larger radii, the completeness corrections stays constant with increasing distance. Fig. 4 (upper panel) gives the resulting completeness in dependence on B-magnitude for a colour of B-R = 1.2.
We estimated the dependence of the completeness on colour using clusters of colours B-R=0.9, B-R=1.2 and B-R=1.5. In all, 140000 clusters were added for each colour. Fig. 4 (lower panel) shows that the completeness for red clusters is about 0.3 mag fainter than for blue ones. This difference must be taken into account for the calculation of the radial profile of red and blue cluster candidates (Sect. 3.3).


2.5 Background correction
Despite the applied selection criteria, there remain point sources, which may be foreground stars or unresolved background galaxies. The surface density profile levels out at a radial distance of about 500″(see Fig. 11). We therefore have used the outermost parts of the two fields observed during the second and third nights (see Fig. 1). That is, two rectangular areas of 128 x 43 at the top of the upper field and at the bottom of the lower field are our background fields. The photometry for these fields was done in the same way as for the central field and it was calibrated using the local standards defined in the overlapping regions.
Completeness tests were also run on these two fields. The two background populations were averaged concerning colour distributions, luminosity function and surface density.
3 Results
We first present the colour-magnitude diagram and the colour distribution of those cluster candidates identified simultaneously in B and R. After that we study the morphological properties of blue and red candidates separately. In these subsections we consider only sources brighter than B=23.8, where the mean completeness is (see Fig. 4).
For deriving the GCLF (Sect. 3.5) and the specific frequency (), we used only the R frame. The reason for doing so is that we reach more than half a magnitude deeper using the R frames alone, which might be crucial for the detection of the turn-over magnitude (hereafter TOM). We keep the criteria regarding magnitude range, photometric error and stellarity index.
Completeness and background corrections for the R frames have been performed in the same way as for the combined sample.
3.1 The colour-magnitude diagram
The B-R colour-magnitude diagram is shown in Fig. 5. In the upper panel, cluster candidates brighter than B=23.8 and having a radial distance less than 500″are plotted. The lower panel shows the same diagram for the background population in an area which is smaller by a factor 1.3 than that for the upper panel. It is apparent that objects bluer than B-R=0.9 are mainly foreground/background objects. This is in good agreement with the fact that B-R=0.9 is also a limit for the galactic clusters, as can be seen from Fig. 3.

3.2 Colour distribution
The colour histogram is given in Fig. 6. The upper panel shows the colour distribution of all sources having a radial distance less than 500″(bold line). The dotted line is the background normalised to the same area. The lower panel shows the colour distribution for the background corrected sample (solid line). For comparison the B-R distribution of the galactic clusters is shown as well (dashed line), showing those clusters, for which B-R photometry is available and which have reddenings less than 1.0 (81 clusters from the compilation of Harris harris96 (1996)). The little peak at B-R=0.85 can be a residual from an inappropriate background subtraction. Without having further clues, we do not regard these objects to be globular clusters. The galactic distribution has the peak at B-R=1.1, qualitatively agreeing with the blue peak of the NGC 4374 clusters. Although the comparison in the red regime is made difficult by the fact that many metal-rich galactic clusters with higher reddenings are omitted, it seems that the distribution of NGC 4374 clusters is more extended to the red and hence presumably to more metal-rich clusters. The appearance of the histogram does not depend much on the bin center which is demonstrated by the dotted curve. This is the sum of the contributions from all clusters, where each one is represented by a Gaussian at the corresponding colour. The only parameter is the of the Gaussian which we choose to be 0.05 to match the bin size.
There are not many B-R photometries of GCSs available, so a comparison only with 3 galaxies, NGC 1380 (Kissler-Patig et al. kissler97 (1997)), NGC 1199 and NGC 6868 (da Rocha et al. darocha02 (2002)) is principally possible. Unfortunately, in all three cases the colour distribution was not background corrected, which may hamper the comparison. However, the blue peak in these colour distribution was found at B-R=1.1 in all cases, resembling the galactic system and, as we will see, that of NGC 4374.
Ajhar et al. (ajhar94 (1994)) and Gebhardt & Kissler-Patig (gebhardt99 (1999)) report V-I photometry for GCs in NGC 4374. Ajhar et al. pointed out a strikingly narrow V-I colour distribution in comparison with other Virgo and Leo ellipticals, but again a more detailed comparison is made difficult by their small number statistics (moreover, no background subtraction has been attempted). Gebhardt & Kissler-Patig analyse the first 4 moments in the V-I colour distribution of a sample of 50 GCSs. NGC 4374 shows one of the highest skewness parameters in their sample, i.e. its colour distribution is strongly weighted to the red.
The general appearance of the colour distribution looks bimodal. A bimodal colour distribution has been found for many GCSs (e.g. Ashman & Zepf ashmanzepf92 (1992); Larsen et al. soren01 (2001); Kundu & Whitmore kundu01 (2001)), often interpreted as a signature of two episodes of cluster formation, sometimes in the context of a merger scenario. However, see Dirsch et al. (dirsch03 (2003)) for the effects of a non-linear colour-metallicity relation.
Following a common statistical approach, we performed a KMM-test (Ashman, Bird & Zepf ashman94 (1994)) on the colour distribution. This test is applied to the distribution uncorrected for the background population, in both homoscedastic and heteroscedastic versions. It returns that the colour distribution is best represented by two Gaussians with positions at B-R=1.11 (the blue peak) and B-R=1.36 (the red peak), and with -values of 0.08 and 0.13, respectively (heteroscedastic mode). In the homoscedastic case, the peaks are at 1.14 and 1.42 with . The P-value, which gives the probability of having a unimodal distribution, is practically zero in both versions, i.e. a unimodal distribution is excluded. Fig. 7 shows the colour distribution together with the returned Gaussians in the heteroscedastic fit. In all GCSs investigated so far, the peaks exhibit approximately constant colours. Weak dependence on galaxy luminosity has been found for the blue and red peaks by Larsen et al. (soren01 (2001)), while Forbes & Forte (forbes01 (2001)) see only a dependence in case of the read peak.
As mentioned, also NGC 4374 fits to this notion compared with GCSs, for which B-R photometry is available. However, most work has been done in V-I (e.g. Larsen et al. soren01 (2001); Kundu & Whitmore kundu01 (2001)) where the peaks are located at V-I=0.95 and V-I=1.15. As can be seen from Fig. 3, these values fit well to the B-R peak colours quoted above.


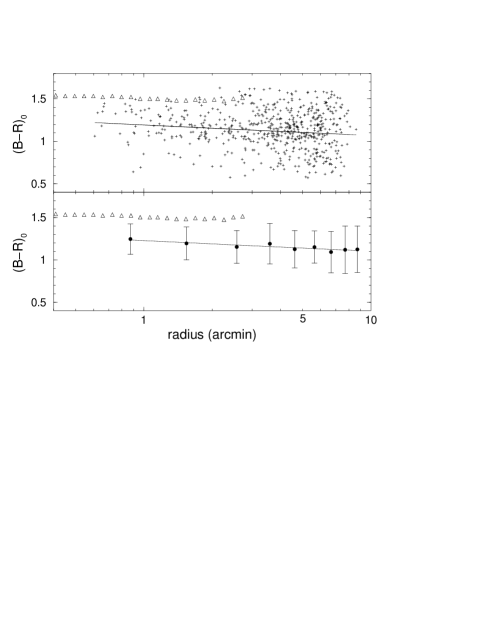
Is there a colour gradient? Fig. 8 plots the B-R colour versus the projected distance from the galaxy centre (in logarithmic scale). The scatter is large, but a slight trend that the clusters become bluer at larger radii, may be recognizable.
3.3 Blue and Red clusters
We divided the clusters in two subpopulations at B-R=1.25 in order to search for possible morphological differences between the blue and the red clusters.
| r [″] | area [] | ||
|---|---|---|---|
| 770 | 6890 | 35.9 5.8 | 25.0 5.1 |
| 1283 | 11483 | 44.2 6.3 | 16.3 4.7 |
| 1796 | 16076 | 32.0 5.4 | 20.4 4.9 |
| 2309 | 20669 | 42.4 6.3 | 19.7 4.9 |
| 2822 | 25262 | 46.4 6.5 | 15.4 4.6 |
| 3335 | 29856 | 32.1 5.4 | 17.1 4.8 |
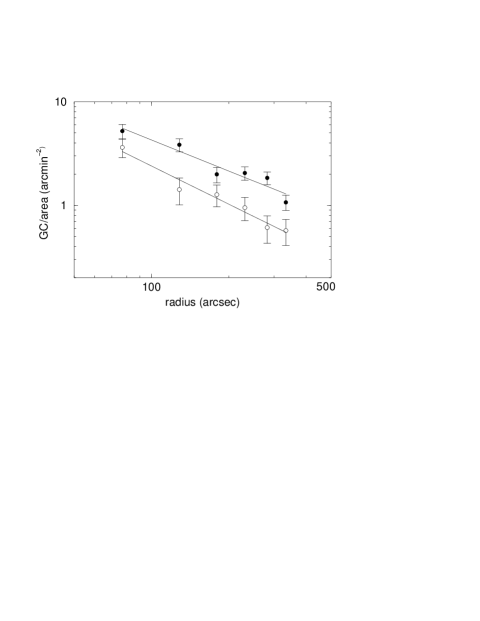
The resulting counts are given in Table 2, and the radial profiles of red and blue clusters are shown in Fig. 9 after the subtraction of the corresponding red and blue background levels. Red and blue clusters do not significantly differ in their radial distributions. They are well represented by: and .
To investigate possible differences regarding the azimuthal distribution, we counted the cluster candidates in 12 equally-sized sectors, each spanning an angle of 30 degrees. The region inside the radius r=513 (or, equivalently, kpc) was left out as the completeness is significantly lower. Clusters outside were not considered because the sectors become geometrically incomplete. The results (Fig. 10) show that, on average, red and blue clusters are spherically distributed around NGC 4374. The galaxy’s position angle of the major axis is indicated by the arrows at 135 and 315 degrees.
There are some cases where blue and red clusters show significant differences in their azimuthal distributions, for example NGC 1316 (Gómez & Richtler gomez01 (2001)), NGC 3115 (Kavelaars kavelaars98 (1998)), and NGC 1380 (Kissler-Patig et al. kissler97 (1997)). In these galaxies, the red clusters resemble the shape of their host galaxies, while the blue clusters are more spherical. The interpretation as differences between halo and bulge/disk populations is suggestive. The elongations of the above galaxies, if caused by inclined disks, are strong enough to make a disk population of clusters easily distinguishable from a spherical halo population. This is not the case for NGC 4374 with its low ellipticity. Clearly, we cannot draw conclusions about halo and bulge/disk cluster subpopulations from their azimuthal distribution.

3.4 Radial Profile
We calculated the cluster radial profile by counting the cluster candidates in several annuli centered on NGC 4374, each 2565 wide, starting from a radius of 898 up to 3464, and 1026 wide thereafter. The innermost ring (770) was given a width of 513 because of the low statistics. The results are listed in Table 3. The bin center and size are the first two columns. The area of the annuli is given in the third column. The fourth column shows the number of candidates up to the 60% detection limit, before correcting for the completeness. The corrected number of clusters and its density are given in columns five and six. The remaining columns are used in the derivation of the specific frequency (see Sect. 3.6).
| r [″] | size [″] | area [] | GCarea [] | |||||
|---|---|---|---|---|---|---|---|---|
| 770 | 513 | 7022 | 167 | 182 | 168 | 183 | ||
| 1026 | 257 | 4683 | 95 | 104 | 95 | 104 | ||
| 1283 | 257 | 5850 | 106 | 116 | 106 | 118 | ||
| 1539 | 257 | 7027 | 105 | 115 | 106 | 117 | ||
| 1796 | 257 | 8198 | 127 | 139 | 127 | 140 | ||
| 2052 | 257 | 9367 | 139 | 152 | 139 | 153 | ||
| 2309 | 257 | 10534 | 152 | 166 | 152 | 167 | ||
| 2565 | 257 | 11706 | 147 | 160 | 148 | 162 | ||
| 2822 | 257 | 12876 | 144 | 157 | 144 | 158 | ||
| 3078 | 257 | 14050 | 153 | 167 | 155 | 170 | ||
| 3335 | 257 | 15222 | 147 | 160 | 147 | 161 | ||
| 3976 | 1026 | 50378 | 458 | 480 | — | — | — | |
| 5002 | 1026 | 29210 | 241 | 257 | — | — | — | |
| 6028 | 1026 | 24332 | 201 | 211 | — | — | — | |
| 7054 | 1026 | 23701 | 199 | 209 | — | — | — |
The radial profile in R is shown in Fig. 11. The upper panel plots the GC number surface density and it is apparent that the cluster population extends at least out to ”. At larger radii the background dominates the profile.
The background level is well determined and its value of arcmin-2 has been subtracted from the tabulated densities, to derive the true radial profile, which is shown in the lower panel. The galaxy light in the R-band, arbitrarily shifted, is also plotted. The solid lines are: and , with being the cluster surface density (in units of arcmin-2) and the surface brightness of the galaxy light.

It is also apparent that the radial profile of the cluster density around NGC 4374 is flatter than the galaxy light.
3.5 The Luminosity Function
The GCLF has been widely used as a distance indicator (see Harris harris01 (2001) and Richtler richtler03 (2003) for recent reviews). GCLFs of a broad range of galaxy types are well characterised by log-normal or functions, the latter being of the form:
| (3) |
Ideally, the photometry should reach deeper than , the turnover magnitude (TOM). Unfortunately, our combined photometry in B and R turns out to be insufficient to reach the expected TOM for the Virgo cluster. The results of our artificial stars experiments show that we go half a magnitude fainter using only R instead of both B and R. For this reason, we restrict to the R-band in the derivation of the GCLF.
The counts are listed in Table 4. We remark that a gaussian fit does not give systematically different results (see e.g. Della Valle et al. dellavalle98 (1998); Larsen et al. soren01 (2001); Kundu & Whitmore kundu01 (2001)), but a function leads to a better representation of our data. Furthermore, we assume a of 1.1 which is a typical value for bright ellipticals (Harris harris01 (2001); Larsen et al. soren01 (2001)). The least-square fit is shown in Fig. 12, where the data are the number of cluster candidates (corrected for completeness and background contamination) at each 0.5 magnitude in R. The error bars account for poisson error in the binning process and for the completeness correction. According to this fit, the TOM in the R band is 23.56.
| R | |||||||
|---|---|---|---|---|---|---|---|
| 19.0 | 12 | 0.980 | 12.3 | 8 | 0.995 | 8.5 | 0.9 |
| 19.5 | 20 | 0.975 | 20.5 | 12 | 0.995 | 12.2 | 4.2 |
| 20.0 | 39 | 0.975 | 40.0 | 17 | 0.990 | 17.4 | 16.6 |
| 20.5 | 63 | 0.965 | 65.3 | 27 | 0.985 | 27.3 | 28.7 |
| 21.0 | 79 | 0.955 | 82.7 | 39 | 0.965 | 40.2 | 28.8 |
| 21.5 | 150 | 0.945 | 158.7 | 68 | 0.965 | 70.3 | 64.5 |
| 22.0 | 204 | 0.920 | 221.7 | 80 | 0.945 | 84.9 | 108.0 |
| 22.5 | 290 | 0.885 | 327.7 | 123 | 0.940 | 130.7 | 152.5 |
| 23.0 | 423 | 0.785 | 538.9 | 181 | 0.905 | 200.1 | 270.7 |
| 23.5 | 440 | 0.675 | 651.9 | 211 | 0.790 | 266.6 | 294.6 |
| 24.0 | 278 | 0.330 | 842.4 | 157 | 0.465 | 338.4 | – |
| 24.5 | 121 | 0.155 | 780.6 | 66 | 0.175 | 378.5 | – |

Leaving a free parameter, we get for the TOM(R) = 23.840.35 and = 1.220.11. We take the absolute TOM(R) from Della Valle et al. (dellavalle98 (1998)) who quote for the galactic system. Another absolute calibration comes from the Andromeda nebula. Barmby et al. (barmby01 (2001)) give R=16.40 for the apparent TOM of M31. Together with a distance modulus of (Freedman et al. freedman01 (2001)), one gets . We average these two values and adopt .
This leads to distance moduli of (keeping ) and (leaving free) for NGC 4374. In the following, we consider only the TOM with .
The SBF distance modulus is (Tonry et al. tonry01 (2001)). Our distance, although marginally higher, is still in agreement within the uncertainties. A slightly higher distance would anyway be expected because we used zeropoints from the Galaxy and M31, which contain a larger fraction of blue clusters. Larsen et al. (soren01 (2001)) find that the V-TOMs of blue clusters are brighter than those of red clusters by an average of 0.37 mag in their sample of 17 early-type galaxies. This difference should be somewhat smaller in R. Our photometry does not reveal the TOM definitely. However, it only could be fainter. If this were the case the difference between the SBF distance and the TOM distance would grow larger. There are some examples where the disagreement between SBF and GCLF distance can be related to the existence of an intermediate-age population (Richtler richtler03 (2003)). Therefore, a deeper photometry would be of interest.
3.6 Specific Frequency
The specific frequency relates the number of clusters belonging to a given galaxy with its luminosity in units of . It was first introduced by Harris & van den Bergh (harris81 (1981)) as:
| (4) |
with the total number of clusters and the absolute magnitude of the galaxy in the band.
Once the turnover has been measured, is normally derived via a calibration with the Galactic GCS. Neither nor are trivial quantities to measure. As it is nearly impossible to observe the total population of clusters, must be determined through rough extrapolations. Typically, the number of candidates brighter than the TOM is obtained (or estimated, if the TOM is not reached by the observations), and then the counts are doubled, assuming the LF to be represented by a symmetric function (a in our case). Matters are further complicated if the observations do not reach the background level, in which case, a spatial extrapolation is required as well.
The radial profile indicates that our population of candidates extends out to a projected radius of arcmin. This region is fully covered by our frames, so we do not need any extrapolation down to the background level.
Again, we have used only the R frame to count the clusters in several annuli, in almost the same way as with the radial profile. The only difference is that we count now up to the TOM (R=23.56). Table 3 lists the counts for . The bin center and size are given in the first two columns. The area of the annulus (in arcmin2) is in the third column. The seventh column shows the observed number of candidates up to the TOM. The completeness-corrected number of clusters in each annulus is in column 8. Finally, assuming the LF to be symmetric around the TOM and after the correction for background objects (8.36 arcmin-2), the total number of candidates on each annulus is given in column 9.
We have left out the inner region of the galaxy (513), because the completeness decreases dramatically as a consequence of the high noise associated to the galaxy light. To estimate the contribution of this region to the total number of clusters, we have used the power-law describing the radial profile. This gives 65 candidates per arcmin2, or 166 candidates in this region down to the TOM.
Adding the contribution of all annuli gives candidates distributed over a total area of 112.53 arcmin2. The distance modulus derived in the previous section is and the total apparent magnitude of NGC 4374 in the band is 9.11 (de Vaucouleurs et al. devaucouleurs91 (1991)). Using the colour excess of (Schlegel et al. schlegel98 (1998)), the absolute magnitude is ; we therefore derive a specific frequency of . This is a very low value for an early-type galaxy of this luminosity class. A possible explanation is suggested in the discussion.
4 Discussion
NGC 4374 is similar to NGC 1316 in two aspects which could both indicate the presence of an intermediate age-population: a high rate of supernova (SN) type Ia and a low specific frequency of globular clusters. SN type Ia are believed to have their progenitors in populations older than 1 Gyr (e.g. Yungelson et al. yungelson95 (1995); Yoshii et al. yoshii96 (1996); McMillan & Ciardullo mcmillan96 (1996)) and a low value of 1.6 might result from the higher galaxy luminosity produced by an intermediate-age population with respect to older populations.
In the case of NGC 1316, this has been already proven by the identification of GCs with ages of about 3 Gyr (Goudfrooij et al. goud01a (2001)). These clusters probably formed in a major merger event which was accompanied by a starburst. The very high star formation rate during these mergers seems to provide suitable conditions for the formation of massive stellar clusters (Larsen & Richtler soren00 (2000)).
For NGC 4374, spectra of clusters are not yet available, and broad-band photometry remains inconclusive regarding the existence of intermediate-age populations.
Integrated spectroscopy as well gives no indication: Terlevich & Forbes (terlevich02 (2002)) have catalogued the ages and metallicities of 150 field and cluster galaxies. Using the SSP models from Worthey & Ottaviani (worthey97 (1997)) and the H index measured by Goudfrooij et al. (goud99 (1999)), they quote an age of 11.8 Gyr for NGC 4374. The quoted ages for merger remnants like NGC 1316 and NGC 5018 (host to the Ia supernova 2002dj) are 3.4 Gyr and 1.5 Gyr, respectively. NGC 5018 also shares with NGC 4374 the characteristic of a low specific frequency (Hilker & Kissler hilker96 (1996)).
However, NGC 4374 is a polar-ring elliptical (Bettoni et al. bettoni01 (2001); note also that among the 10 polar-ring ellipticals, listed in that work, 3 are Ia host galaxies). It has a dust lane, which extends out to about 1 kpc, and is a prominent radio source as well (see Hansen et al. hansen85 (1985) for details on the morphology of the dust lane). These properties might be related to previous merger processes.
An interesting note regarding Ia host galaxies and GCSs can be made from the paper of Gebhardt & Kissler-Patig (gebhardt99 (1999)). These authors analyse the V-I colour distribution of the GCs of a sample of early-type galaxies. Their “skewness” parameter measures the asymmetry of the colour distribution with respect to the mean colour. The two GCSs which are skewed strongest towards red (i.e. metal-rich) clusters both belong to Ia host galaxies (NGC 4536, NGC 4374) as well as does the fourth in this sequence (NGC 3115).
Since SNe Ia in “normal” elliptical galaxies are so rare, one might ask whether NGC 4374 is in fact a S0 galaxy seen face on. This would alleviate the problem of the low specific frequency, and given the uncertainties, a specific frequency of 1.9 (the upper limit) is not unusual for a S0 galaxy (Harris harris91 (1991); Kundu & Whitmore kundu01 (2001)).
Looking for more peculiarities, it is striking that the ellipticity of the isophotes of NGC 4374 decreases with increasing radial distance rather than the opposite, which is commonly observed for ellipticals (Caon et al. caon94 (1994)). It is plausible that a face-on disk, which in projection in the inner parts is dominated by an elliptical bulge, may show this feature.
In that case, one may expect more conclusive information from dynamical analyses. Gerhard et al. (gerhard01 (2001)) included NGC 4374 in their sample of 21 round early-type galaxies for which they have derived the mass profiles out to 1 to 1.5 effective radii. According to Magorrian & Ballantyne (magorrian01 (2001)), a flattened structure when seen face-on, but dynamically treated as spherical, shows a spurious radial bias in its orbit structure. NGC 4374, however, does not show any striking anomaly regarding its anisotropy parameters. On the other hand, the radial extension of the analysis is limited to 100 arcsec of radial distance, so data which reach further out are of high interest. Investigating the kinematics of globular clusters is the best way to pursue this suspicion.
5 Conclusions
We analysed the GCS of the giant elliptical NGC 4374, host of two or even three SNe Ia. This may lead to the suspicion that an intermediate-age population may be present in NGC 4374, and perhaps manifest in the GCS properties. However, the colour distribution does not show anomalous features. It is best represented by a bimodal distribution with peaks at B-R=1.11 and B-R=1.36, resembling the colour distribution found in other early-type galaxies. A unimodal distribution is ruled out by a KMM test.
The spatial distributions of the red and blue subpopulations do not show significant differences.
However, the number of clusters in NGC 4374 turns out to be surprisingly lower than what is expected for its high luminosity. This could indicate the presence of an intermediate-age population, as has been the case for other early-type galaxies with low specific frequencies. It is intriguing that these examples (NGC 1316 and NGC 5018) also have been hosts of type Ia SNe.
The other possibility is that NGC 4374 is a S0 galaxy seen face-on, in which case the low specific frequency of 1.6 would fit to other objects of this class. One then would expect a disk-like kinematic behaviour of the metal-rich globular clusters or of a subsample . Measuring radial velocities of many globular clusters could provide further clues.
Acknowledgements.
We thank an anonymous referee for his/her comments which considerably improved the paper, particularly for pointing out an error in the photometric calibration. We also thank Georg Drenkhahn for discussions. We have made use of the NED Database, as well as online-data for NGC 4374 hosted by CDS. T.R. acknowledges support from the FONDAP center for astrophysics, Conicyt 15010003. M.G. thanks the DAAD for a studentship.References
- (1) Ajhar, E. A., Blakeslee, J. P., & Tonry, J. L. 1994, AJ, 108, 2087
- (2) Ashman, K. M., & Zepf, S. E. 1992, ApJ, 384, 50
- (3) Ashman, K. M., Bird, C. M., & Zepf, S. E., 1994, AJ, 108, 2348
- (4) Barmby, P., Huchra, J. P., & Brodie, J. P. 2001, AJ, 121, 1482
- (5) Bertin, E., & Arnouts, S. 1996, A&AS, 117, 393
- (6) Bettoni, D., Galletta, G., García-Burillo, S., & Rodríguez-Franco, A. 2001, A&A, 374, 421
- (7) Caon, N., Capaccioli, M., & D’Onofrio, M. 1994, A&AS, 106, 199
- (8) da Rocha, C., de Oliveira, C. M., Bolte, M., Ziegler, B. L., & Puzia, T. H. 2002, AJ, 123, 690
- (9) Della Valle, M., Kissler-Patig, M., Danziger, J., & Storm, J. 1998, MNRAS, 299, 267
- (10) de Vaucouleurs, G., de Vaucouleurs, A., Corwin, H. G., et al. 1991, Third Reference Catalogue of bright galaxies, Springer-Verlag Berlin Heidelberg New York (RC3)
- (11) Dirsch, B., Richtler, T., Geisler, D., et al. 2003, AJ 125, 1908
- (12) Elmegreen, B. G. 1999, Ap&SS, 269, 469
- (13) Forbes, D. A., & Forte, J. C., 2001, MNRAS 322, 257
- (14) Freedman, W. L., Madore, B. F., & Gibson, B. K. 2001, ApJ, 553, 47
- (15) Gebhardt, K., & Kissler-Patig, M. 1999, AJ, 118, 1526
- (16) Gerhard, O., Kronawitter, A., Saglia, R. P., & Bender, R. 2001 AJ, 121, 1936
- (17) Gómez, M., Richtler, T., Infante, L., & Drenkhahn, G. 2001, A&A, 371, 875
- (18) Goudfrooij, P., Gorgas, J., & Jablonka, P. 1999, Ap&SS, 269, 109
- (19) Goudfrooij, P., Mack, J., Kissler-Patig, M., et al. 2001, MNRAS, 322, 643
- (20) Grillmair, C. J., Forbes, D. A., Brodie, J. P., & Elson, R. A. 1999, AJ, 117, 167
- (21) Hansen, L., Nrgaard-Nielsen, H. U., & Jrgensen, H. E. 1985, A&A, 149, 442
- (22) Harris, W. E., & van den Bergh, S. 1981, AJ, 86, 1627
- (23) Harris, W. E. 1991, ARA&A, 29, 543
- (24) Harris, W. E. 1996, AJ, 112, 1487. Catalogue available at http://physun.physics.mcmaster.ca/Globular.html
- (25) Harris, W. E. 2001, Globular Cluster Systems, in Star Clusters, Saas-Fee Advanced Course 28, Lecture Notes 1998, Swiss Society for Astrophysics and Astronomy, eds. L Labhardt and B. Binggeli, Springer-Verlag Berlin, p.223
- (26) Hilker, M., & Kissler-Patig, M. 1996, A&A, 314, 357
- (27) Kavelaars, J. J. 1998, PASP, 110, 758
- (28) Kissler-Patig, M., Richtler, T., Storm, J., & Della Valle, M. 1997, A&A, 327, 503
- (29) Kundu, A., & Whitmore, B. C. 2001, AJ, 121, 2950
- (30) Landolt, A. U. 1992, AJ, 104, 340
- (31) Larsen, S. S., & Richtler, T. 2000, A&A, 354, 836
- (32) Larsen, S. S., Brodie, J. P., Huchra, J. P., et al. 2001, AJ, 121, 2974
- (33) Magorrian, J., & Ballantyne, D. 2001, MNRAS, 322, 702
- (34) McMillan, R. J., & Ciardullo, R. 1996, ApJ, 473, 707
- (35) Poulain, P. 1988, A&AS, 72, 215
- (36) Richtler, T. 2003, Proceedings of “Stellar Candles for the Extragalactic Distance Scale” Eds. W. Gieren, & D. Alloin. Lecture Notes in Physics, Springer
- (37) Schlegel, D. J., Finkbeiner, D. P., & Davis, M. 1998, ApJ, 500, 525
- (38) Terlevich, A. I, & Forbes, D. A. 2002, MNRAS, 330, 547
- (39) Tonry, J., Dressler, A., Blakeslee, J. P., et al. 2001, ApJ, 546, 681
- (40) Worthey, G., & Ottaviani, D. L. 1997, ApJS, 111, 377
- (41) Yoshii, Y., Tsujimoto, T., & Nomoto, K. 1996, ApJ, 462, 266
- (42) Yungelson, L., Livio, M., Tutukov, A., & Kenyon, S. J. 1995, ApJ, 447, 656