A Study of the Distribution of Star-Forming Regions in Luminous Infrared Galaxies by Means of H Imaging Observations
Abstract
We performed H imaging observations of 22 luminous infrared galaxies to investigate how the distribution of star-forming regions in these galaxies is related to galaxy interactions. Based on correlation diagrams between H flux and continuum emission for individual galaxies, a sequence for the distribution of star-forming regions was found: very compact ( 100 pc) nuclear starbursts with almost no star-forming activity in the outer regions (type 1), dominant nuclear starbursts 1 kpc in size and a negligible contribution from the outer regions (type 2), nuclear starbursts 1 kpc in size and a significant contribution from the outer regions (type 3), and extended starbursts with relatively faint nuclei (type 4). These classes of star-forming region were found to be strongly related to global star-forming properties such as star-formation efficiency, far-infrared color, and dust extinction. There was a clear tendency for the objects with more compact distributions of star-forming regions to show a higher star-formation efficiency and hotter far-infrared color. An appreciable fraction of the sample objects were dominated by extended starbursts (type 4), which is unexpected in the standard scenario of interaction-induced starburst galaxies. We also found that the distribution of star-forming regions was weakly but clearly related to galaxy morphology: severely disturbed objects had a more concentrated distribution of star-forming regions. This suggests that the properties of galaxy interactions, such as dynamical phase and orbital parameters, play a more important role than the internal properties of progenitor galaxies, such as dynamical structure or gas mass fraction. We also discuss the evolution of the distribution of star-forming regions in interacting galaxies.
1 Introduction
Many statistical studies of interacting galaxies have shown that galaxy interactions can enhance star-forming activity (e.g., Larson & Tinsley, 1978; Kennicutt et al., 1987; Hummel et al., 1987; Bushouse et al., 1988; Xu & Sulentic, 1991). Luminous infrared galaxies (LIRGs; [8–1000 µm] ) are galaxies which emit the bulk of their energy in the far-infrared (FIR) and often show signs of interaction, such as tidal tails, multiple nuclei, or disturbed outer envelopes (Sanders & Mirabel, 1996). LIRGs are considered to be extreme objects, where strong starbursts are induced by galaxy interactions, because in many such objects star formation can account for the infrared emission.
Theoretical work supports the idea that interactions play an important role in stimulating starbursts in galaxies. Numerical simulations of merging gas-rich spiral galaxies show that during the merging process, gas clouds lose their angular momentum and flow into the circumnuclear region of the host galaxies (e.g., Barnes & Hernquist, 1991; Mihos & Hernquist, 1996). The resulting high concentration of molecular gas can fuel star-formation activity in the circumnuclear region. This is consistent with compact nuclear starbursts and gas condensation in ultra-luminous infrared galaxies (ULIRGs; ), as observed in mid-infrared (MIR, Soifer et al., 2000), radio continuum (Condon et al., 1991, hereafter C91), and CO emission (e.g., Downes & Solomon, 1998; Bryant & Scoville, 1999) data. Therefore, a nuclear starburst triggered by gas inflow has generally been assumed to be the mechanism for producing enhanced star formation in interacting galaxies.
However, the diversity of star-forming and morphological properties in LIRGs, and the details of the physical processes that may enhance star-forming activity, are not fully understood. For example, several paired systems of LIRGs show intense star formation in the region of overlap of the two galaxies (Xu et al., 2000; Mirabel et al., 1998; Haas et al., 2000; Soifer et al., 2001; Le Floc’h et al., 2002), which is not predicted by numerical simulations. Moreover, some observational studies have suggested that the distribution of star-forming regions in LIRGs depends on pair separation (Hwang et al., 1999, hereafter H99), gas content (Mihos & Bothun, 1998), or degree of morphological disturbance (Xu et al., 2000). Although these observations yield intriguing clues, the samples are small (4–8 objects) and the mechanism that determines the distribution of star-forming regions in LIRGs remains unclear. As for the morphological properties, observational studies of galaxies have revealed a weak dependence of global star-forming properties, such as infrared luminosity and FIR color, on the interaction strength or morphological class (e.g., Xu & Sulentic, 1991; Lutz, 1992). These studies suggest that in order to better understand the physical processes in interaction-induced star-forming activity it is necessary to determine how the star-forming properties of interacting galaxies depend on the dynamical or physical properties of the system. On the other hand, even if objects with similar or FIR color are considered, there is a significant variation in morphological appearance. For example, 20–30% of LIRGs with 1011 1012 are apparently single galaxies, while the remaining objects are closely interacting or merging galaxies (Sanders & Mirabel, 1996). It is unclear why these galaxies are actively forming stars at the same level as strongly interacting galaxies, and whether the single-galaxy LIRGs have nuclear starbursts.
The distribution of star-forming regions is expected to be connected to the process by which star-formation activity is enhanced (e.g., Mihos & Bothun, 1998), and therefore it is important to investigate the distribution of star-forming regions in LIRGs and its dependence on morphological, physical, and dynamical properties. For this purpose, we have undertaken an H imaging survey of LIRGs. In contrast to previous H imaging surveys of interacting galaxies (Kennicutt et al., 1987; Bushouse, 1987; Combes et al., 1994; Domingue et al., 2003) and infrared-selected galaxies (Armus et al., 1990, hereafter AHM; Lehnert & Heckman 1996; Xu et al. 2000; Dopita et al. 2002), all of our sample objects are LIRGs, and they are not selected based on morphological properties or FIR color. This should enable us to focus on activated star formation, and may be useful for examining the relationships between the distribution of star-forming regions and other properties. As LIRGs are dust-rich systems, the H emission, especially the total H flux (Dopita et al., 2002), can be significantly affected by dust extinction. However, Lehnert & Heckman (1996) presented evidence that the half-light radius of H emission is a useful indicator of the size of the star-forming region. Therefore, H emission may be used to trace the spatial distribution of star-forming regions within individual galaxies. An advantage of H emission is its large range of spatial scales, i.e., it is sensitive to small ( 1″) and large ( 1′) scale emission. Although observations in MIR or radio continuum emission can provide the highest spatial resolutions ( 01 or smaller), such observations are insensitive to diffuse emission (C91; Soifer et al., 2000, 2001), which can extend well beyond several arcseconds. Continuum images also offer important information, since red images taken through a tunable filter are almost free from emission lines and can therefore be used to trace the distribution of old stars. This enables a direct comparison of the distribution of old and newly-formed stars.
In § 2, we present the sample selection and the observational details. In § 3, we describe the results of the observations for the individual objects and analyses of the resulting dataset. The observational results are discussed in § 4, and the conclusions and summary are given in the final section.
2 Observation
2.1 Sample Selection
The sample objects were selected from LIRGs observed in CO emission to enable comparison of our results with the gas content and star-formation efficiency. Among the systematic CO surveys of LIRGs (e.g., Mirabel et al., 1990; Sanders et al., 1991, hereafter SSS), our sample objects were selected from SSS, where total CO fluxes were obtained for 62% of the LIRGs in the Infrared Astronomical Satellite () Bright Galaxy Sample (BGS; Soifer et al., 1989; Sanders et al., 1995). The BGS includes galaxies covering nearly the entire sky at galactic latitudes higher than 5∘ with (60 µm) 5.24 Jy. The SSS selection criteria result in a sample that is relatively unbiased to any galaxy property. Uncertainties in the CO fluxes are typically smaller than 20%.
We selected objects from the SSS sample matching the following criteria: (1) , (2) no clear evidence for an active galactic nucleus (AGN), (3) 12000 km s-1, and (4) . No morphological selection was made. The narrow range in infrared luminosity was chosen to avoid confusion due to the effects of large differences in the classes of star-formation activity, as there is a weak dependence of the half-light radius of H emission on (AHM; Lehnert & Heckman, 1996). This should aid investigation of the relation between properties of the interacting systems and the distribution of star-forming regions. In addition, LIRGs with are relatively close as compared to ULIRGs, making it easier to investigate the distribution of star-forming regions in detail. We searched for evidence for AGN in observational studies that used optical and MIR spectroscopy, radio morphology, and hard X-ray emission. Based on these criteria, a total of 28 objects was selected, and observations were made of 22 of them. Among the 22 objects, some (III Zw 35, NGC 2623) show LINER-like optical spectra (Veilleux et al., 1995). However, their radio morphology, large FIR/radio and small ratios suggest that star-forming activity dominates the energetics of these objects. Hence, the LINER spectra may result from a contribution due to shock heating, possibly driven by superwind activities (Taniguchi et al., 1999; Lutz!et al., 1999). For all of the sample objects, the FIR/radio ratio is similar to or larger than that of normal star-forming galaxies and fairly constant, with a standard deviation of 0.14 in . This suggests that none of the sample objects harbors an energetically dominant AGN. Several objects in our sample are in common with those studied in previous H+[N II] imaging surveys of LIRGs; four with AHM (NGC 1614, NGC 2623, NGC 4194, and UGC 8335), one with Lehnert & Heckman (1995, Zw 049.057), one with Xu et al. (2000, NGC 6621/22), and two with Dopita et al. (2002, NGC 1614 and NGC 3110). The relatively small number of common objects is due to differences in the adopted selection criteria (AHM; Lehnert & Heckman, 1995; Xu et al., 2000) or to different sky coverage (Dopita et al., 2002). The observed objects are listed in Table 1 together with their global parameters: gas mass, infrared luminosity, and FIR fluxes at 25, 60, and 100 µm determined by SSS, Soifer et al. (1989), and Sanders et al. (1995).
Most of the sample objects are interacting systems, and many of them contain two or more galaxies in the beam; the FIR fluxes may therefore represent the total emission from the component galaxies, and so it is possible that there is no LIRG in the system (see e.g., Sulentic & de Mello Rabaca, 1993). To examine this possibility, we searched for radio continuum observations of objects that have nearby companions or are composed of two galaxies. These objects are listed in Table A Study of the Distribution of Star-Forming Regions in Luminous Infrared Galaxies by Means of H Imaging Observations, with for each component galaxy determined by assuming that they both have the same radio-to-FIR flux. For Mrk 331, no radio information was found for the companion galaxies. However, as the 100 µm mapping observation of Mrk 331 by Zink et al. (2000) found a flux consistent with the BGS flux, contamination by companion galaxies is considered to be negligible. Of the ten objects listed in Table A Study of the Distribution of Star-Forming Regions in Luminous Infrared Galaxies by Means of H Imaging Observations, the first five are paired galaxies included in BGS as interacting systems because of their small separations. The infrared luminosities of these objects were found to be dominated by one of the member galaxies, and so the analyses in the following sections are made for the dominant galaxy only. The H luminosity can also be used to resolve the confusion problem because it is closely correlated to FIR luminosity for normal star-forming galaxies (e.g., Kewley et al., 2002). However, in LIRGs, the ratio varies over an order of magnitude (AHM). In contrast, if there is not an energetically dominant AGN, the FIR/radio ratio is fairly constant, as is the case in our sample. Therefore, we did not use the H luminosity for this purpose.
2.2 H and Continuum Imaging
The H and continuum images were obtained in 1999 December, 2000 January and October, and 2001 April using the f/18 Cassegrain focus of the Okayama Astrophysical Observatory (OAO) 188-cm telescope. We used the Kyoto Tridimensional Spectrograph I (Ohtani et al., 1998) in imaging Fabry–Perot interferometer mode with a 5 µm gap Queensgate ET-50 etalon. This etalon provides bandpasses of 25 Å at 6598 Å and 29 Å at 6929 Å. A 45 square field is imaged onto a 10241024 TC215 CCD with a pixel size of 12 µm. By 22 on-chip binning, each 24 µm pixel subtends 0535 on the sky. Observational procedures for the Kyoto Tridimensional Spectrograph I and the system setup are described in detail in Ishigaki et al. (2000).
The central transmission wavelength of the etalon was tuned to the redshifted H emission of each object. Images of the continuum emission were also obtained at the rest-frame wavelengths of 6450 Å and/or 6650 Å. A log of these observations is presented in Table 2, which lists the observed wavelength, the exposure time, and the full width at half maximum (FWHM) of field stars. The contribution of H + [N II] to the continuum image is generally small, estimated to be about 1–10% for the typically observed H equivalent widths (EWs) of 10–100Å. Sixteen of our sample objects were observed by Kim et al. (1995) and their results show that the nuclear [N II]/H ratio ranges from 0.3 to 1.0. This means that [N II] emission contributes up to 30% of the obtained H images. A clear example may be III Zw 35, which shows, in addition to compact nuclear emission, elongation in the direction of the minor axis, suggesting that galactic-scale outflows may contribute to the H image. However, the compact distribution of star-forming regions in III Zw 35 is not greatly affected by the elongated component, and in the following analyses we consider such effects to be generally small.
The images were reduced in the standard manner for narrow-band filter imaging using IRAF. The procedure includes bias subtraction, dark subtraction, flat-fielding, cosmic-ray removal and sky subtraction. Flux calibrations were made for most of the objects by using data from photometric standard stars taken with the same instrumental setup, although relatively unstable weather conditions caused rather large uncertainties in the calibration. A comparison of the integrated fluxes with previous H imaging observations (AHM; Lehnert & Heckman, 1995; Dopita et al., 2002) in six of the sample objects showed log differences of about 0.3, and we therefore assumed this value as the uncertainty in the absolute flux calibration. No flux calibration was made for NGC 828, NGC 6090, and Mrk 331. Spatial registration and correction for the seeing variation were made using the positions and FWHM of field stars. Where reliable corrections for variations of system efficiency with wavelength and atmospheric transmission were not available, the counts of field stars were used to match the flux level of on- and off-band images. As the off-band images were obtained at both the long- and short-wavelength sides of the H emission, the effect of the color difference between field stars is expected to be small.
3 Results
3.1 H and Continuum Images
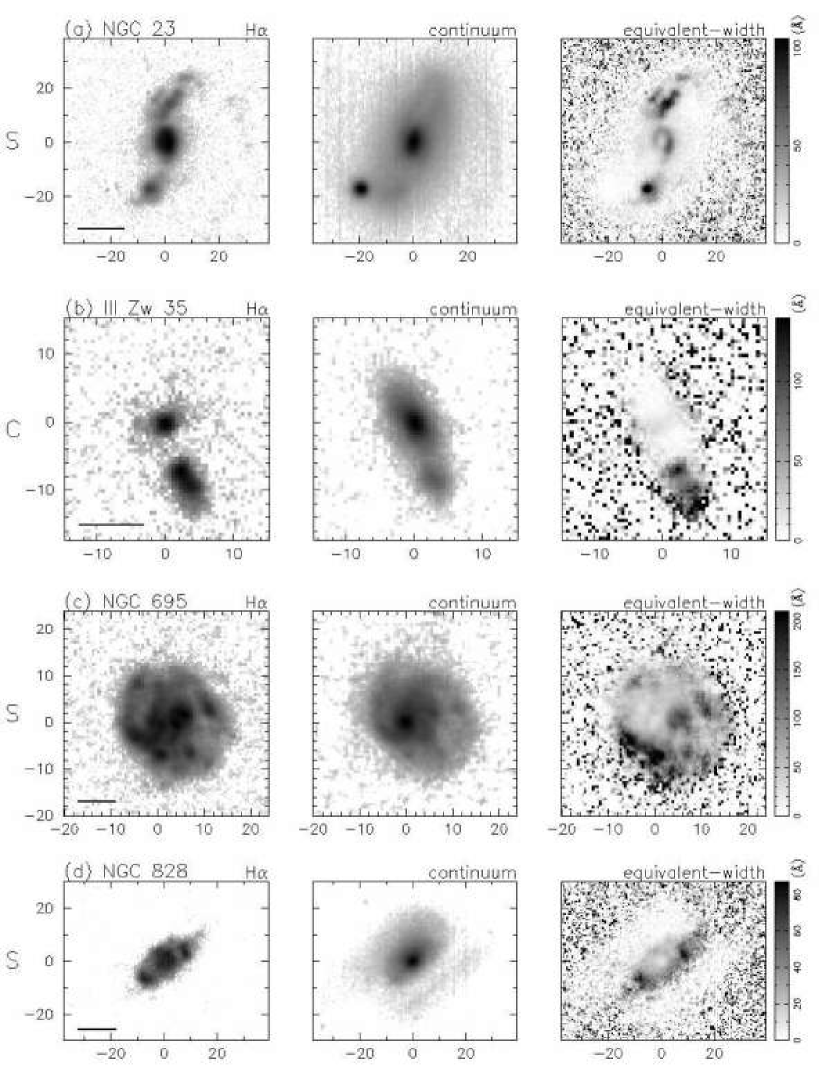
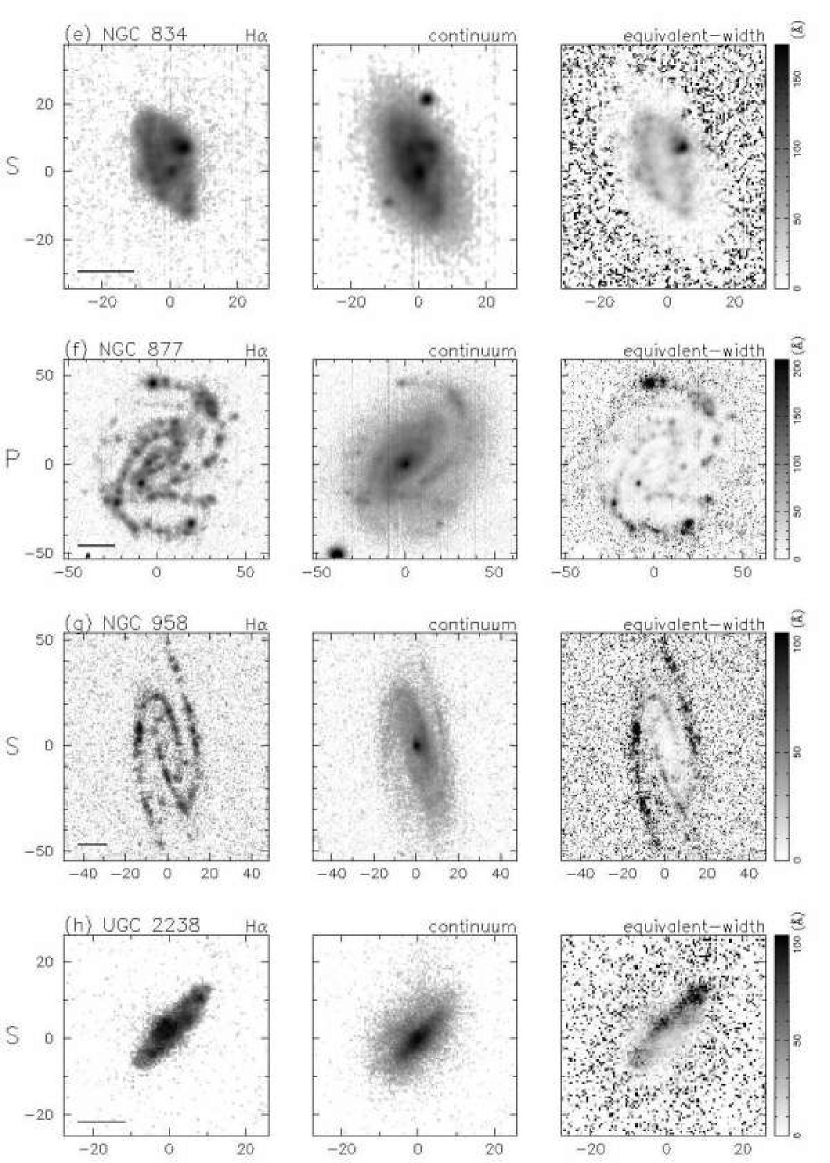
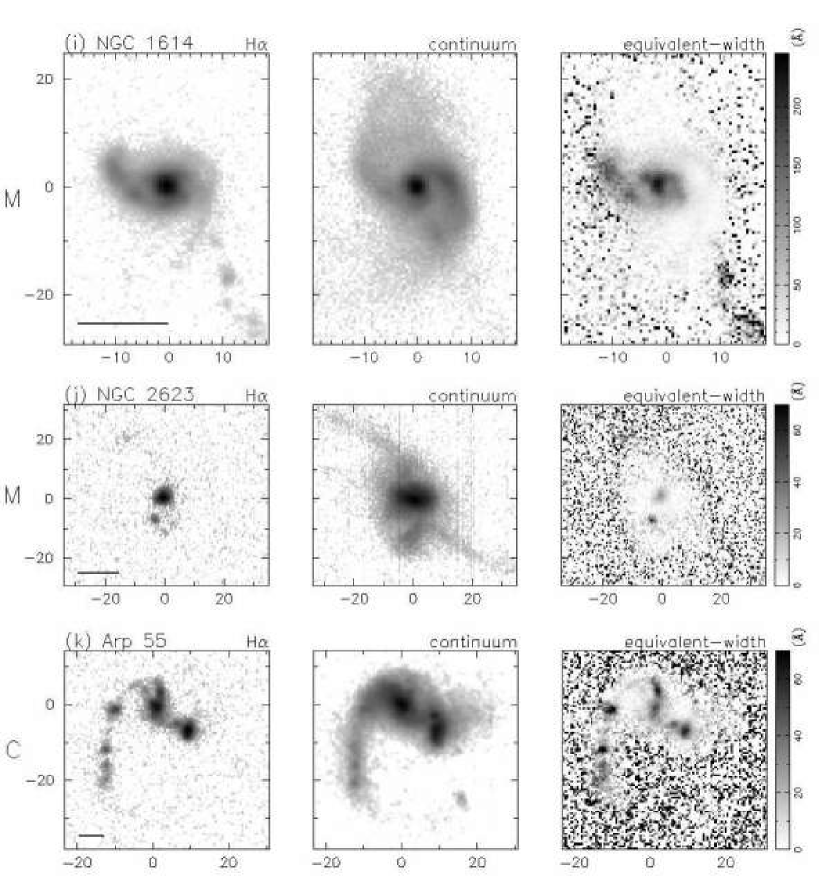
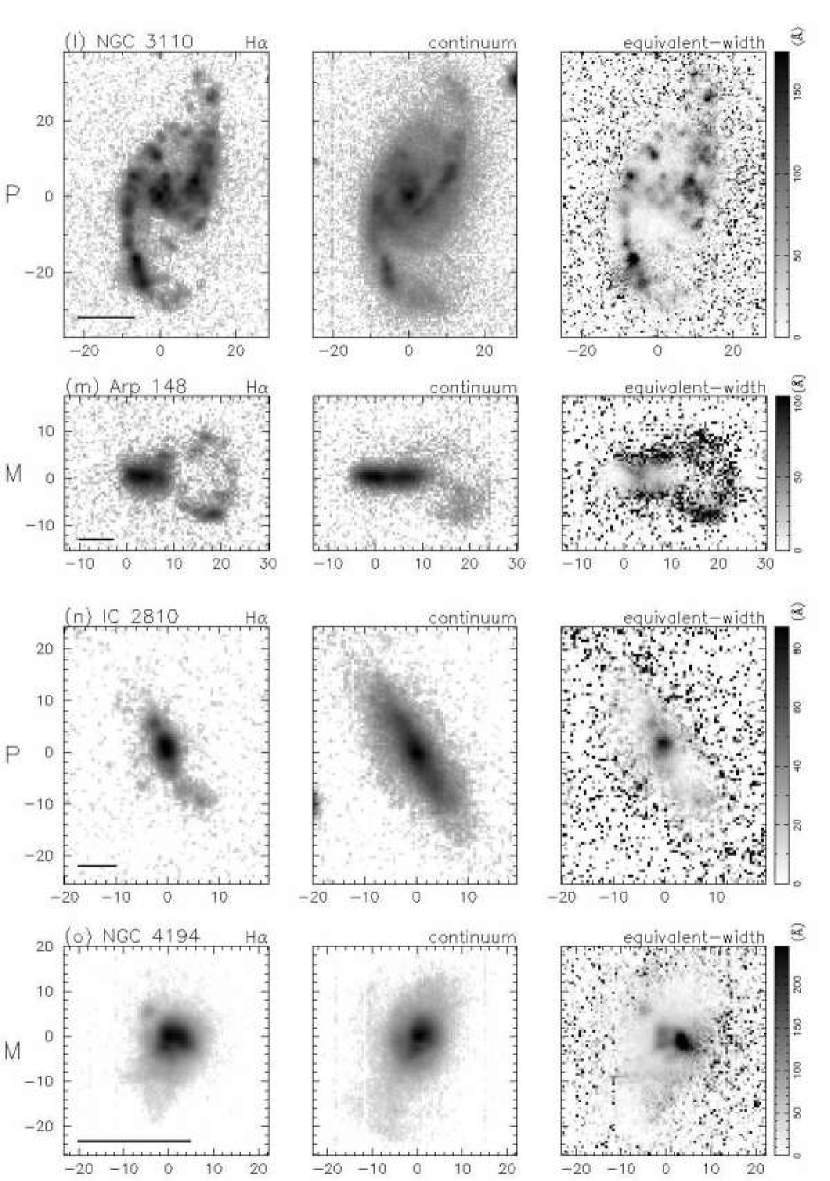
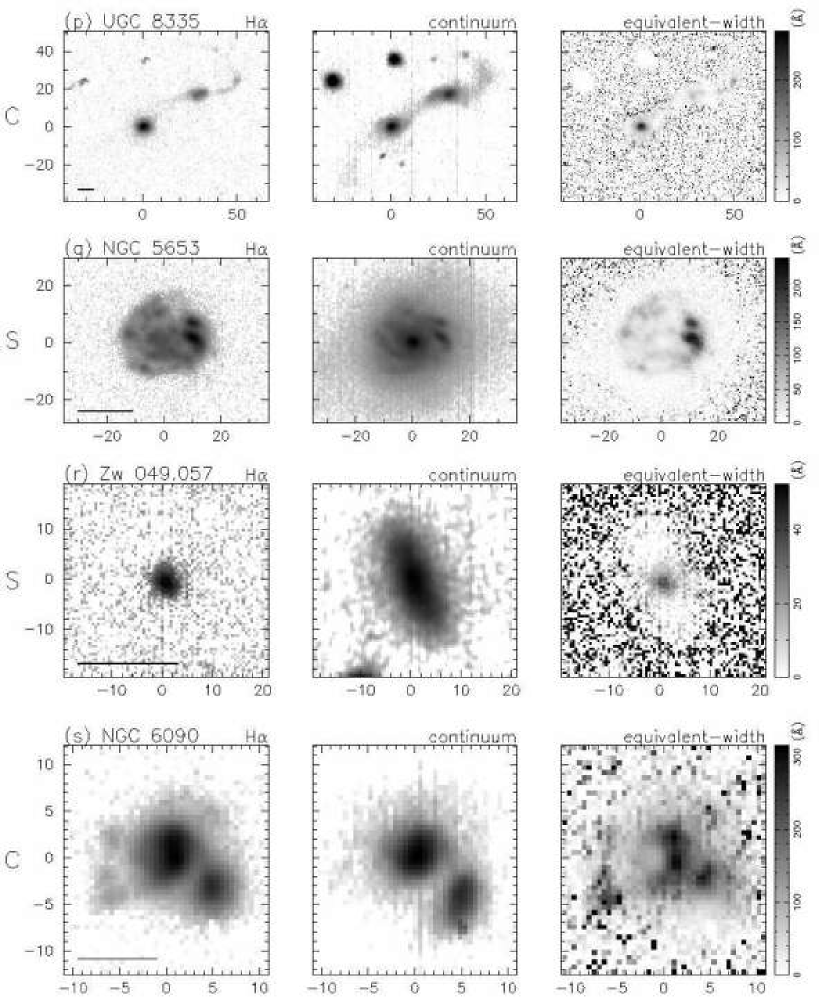
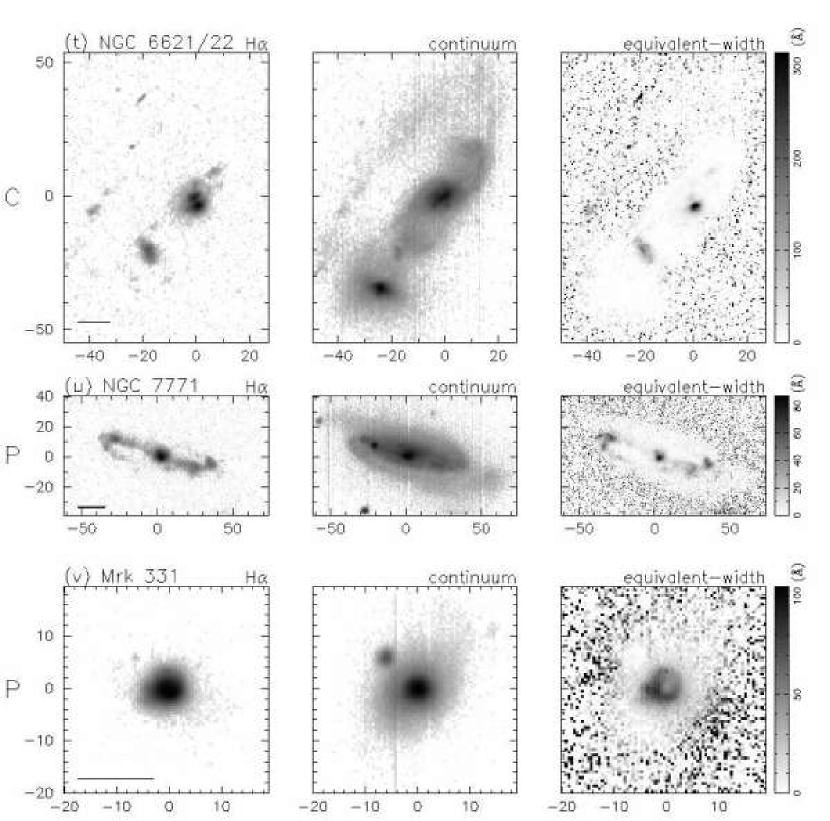
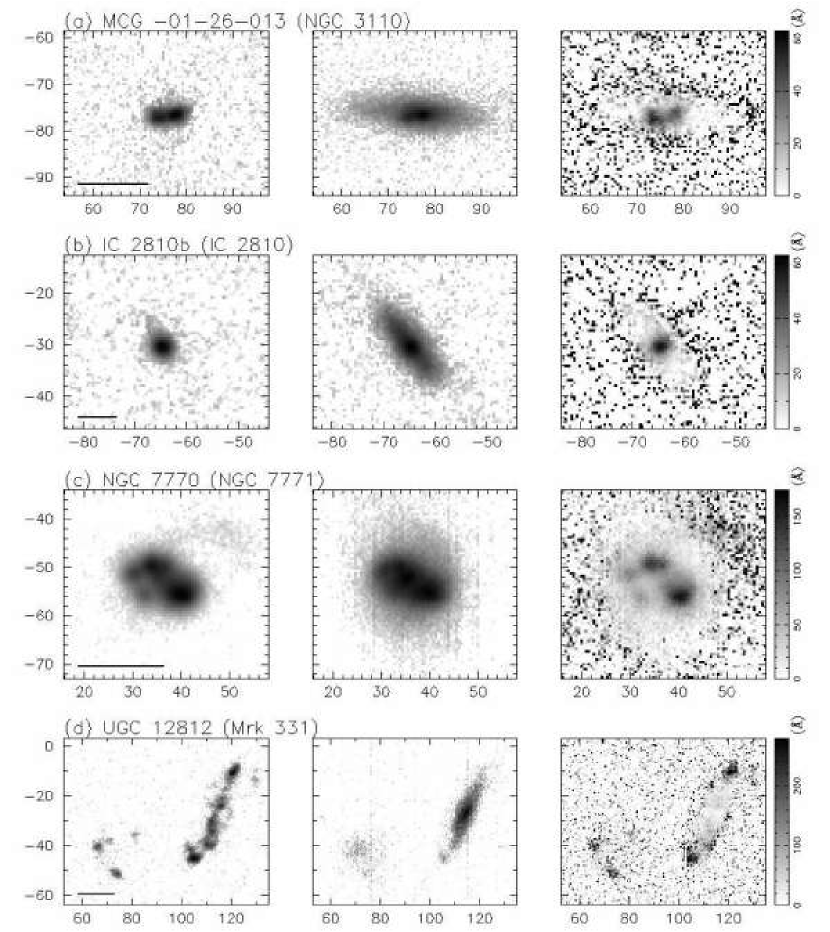
The continuum-subtracted H and continuum images of the sample objects are shown in Figure 1. By taking the ratio of the H and continuum images, we obtained the H equivalent-width maps, which are also given in Figure 1. For objects with an H-emitting companion galaxy, the images of the companion galaxies are shown separately in Figure 2. The images show a large variation in the distribution of H emissions, and analyses of the H images are made in the next subsection. A description of the results for each individual object is given in the appendix.
In continuum light, the sample objects span a broad range of morphologies from apparently normal spiral galaxies (e.g., NGC 958) to nearly complete mergers with strong tidal tails (e.g., NGC 2623). It is notable that in systems of paired galaxies most of the companion galaxies are small as compared to the main galaxies that are the dominant source of FIR emission.
We divided the sample objects into several morphological classes in order to facilitate comparisons with the star-forming properties given in the following sections. Morphological classifications have already been made by SSS for all of our samples. However, according to their classification, more than half of the galaxies are defined as ”merger”, partly because their ”merger” class includes paired galaxies with overlapping disks. Therefore, we made our own morphological classification as follows. Objects with strong tidal features and a single nucleus were classified as ”merger” (NGC 1614, NGC 2623, Arp 148, NGC 4194). Paired galaxies with overlapping disks or a connecting bridge were classified as ”close pair” (III Zw 35, Arp 55, UGC 8335, NGC 6090, NGC 6621/22) where the projected separation ranges from 4 kpc to 20 kpc. Galaxies which have nearby ( 100 kpc) companion galaxies at the same redshift but no evident overlap between the primary galaxy and its companion were classified as ”pair” (NGC 877, NGC 3110, IC 2810, NGC 7771, Mrk 331). The remaining eight objects were classified as ”single”. Note that, although the ”single” objects do not show strong tidal features, many of them show some distorted/asymmetric appearance. Thus, it is possible that some of the ”single” objects are remnants of mergers or have experienced tidal interactions. In Figure 1, the morphological classes are indicated to the left of the H images, where ”M”, ”C”, ”P”, and ”S” represent ”merger”, ”close pair”, ”pair”, and ”single”, respectively.
3.2 Distribution of H Emission and Equivalent Width
As seen in Figure 1, the morphological appearance of LIRGs in H is complicated and highly varied. To investigate the distribution of star-forming regions and compare it with physical and dynamical properties, we made ”H–continuum diagrams.” These diagrams plot the H versus red-continuum surface brightness at each galaxy position, and were made for each individual object. The surface brightness in red continuum light, which is considered to trace old stars, typically decreases with distance from the nucleus, so the diagram demonstrates how the H surface brightness changes with distance from the nucleus and, more specifically, the relative concentration towards the nucleus of H and continuum emission. Note that for paired systems, only the main galaxy, that emits most of the FIR flux (see Table A Study of the Distribution of Star-Forming Regions in Luminous Infrared Galaxies by Means of H Imaging Observations), is shown in the diagram. The use of continuum surface brightness as an indicator of the distance from the galaxy center has some advantages, in that it is insensitive to variations in galaxy size and inclination; however, there may be additional uncertainty due to non-axisymmetric features such as bars and spiral arms. In normal spiral galaxies, the distribution of H emission is similar to that of white light (Hodge & Kennicutt, 1983), and more extended than -band emission (Ryder & Dopita, 1994).
The H–continuum diagrams are shown in Figure 3 for all of the objects, where the ordinate and abscissa represent log H and continuum surface brightness in erg s-1 cm-2 arcsec-2 and erg s cm-2 Å-1 arcsec-2. For NGC 828, NGC 6090, and Mrk 331, the axes are shown in arbitrary units, as we did not make absolute flux calibrations for these objects. However, in these three objects, the relationship between the ordinate and abscissa is the same as in other objects, and H-equivalent widths can be measured. The abscissa increases leftward, so the galaxy nucleus corresponds to the left edge of the diagram. Before making these diagrams, the spatial sampling and FWHM of the point spread function were set to common values of 420 pc pixel -1 and 1.43 kpc, respectively, for all of the objects. In the diagrams, small dots represent the H and continuum surface brightnesses measured at each pixel of the image. If the distribution of H and continuum emission are similar, the small dots will be distributed along lines with a slope of 1.0, as shown in Figure 3. These three lines correspond to a constant EW of 20 Å, 100 Å, and 500 Å, respectively. In the upper panel of each diagram, we show the H flux integrated over the regions with the continuum surface brightness given by the abscissa value. Each continuum surface-brightness bin has a width of 0.1 in logarithmic scale, and the ordinate is linearly scaled, with the bottom line corresponding to zero H flux. In these plots, one can see the contributions to the total H flux from the nuclear and outer regions. Hereafter, they are referred to as ”H-flux histograms”.
The diagrams in Figure 3 are ordered from upper left to lower right by characteristics of appearance, and we classified them as follows. The H-flux histograms of the first eight objects (III Zw 35, NGC 2623, Zw 049.057, NGC 1614, NGC 4194, UGC 8335, NGC 6090, and Mrk 331) show that the total H flux of these objects is dominated by emission from the nuclear region. The H–continuum diagrams show a monotonic decline of H surface brightness towards the right-hand side, and the position of the H peak closely matches that of the continuum peak. In addition, most of the slopes are steeper than 1.0, i.e., the H distribution is more sharply peaked than the continuum. In spite of these common properties, there are two subgroups with distinctly different H surface brightnesses and EW: III Zw 35, NGC 2623, and Zw 049.057 show log (in cgs) and H EW lower than 20Åin their nuclei, while the other five objects show log and H EW larger than 100Å. Hereafter, the former group is referred to as type 1 and the latter as type 2. In the next six objects (NGC 23, UGC 2238, Arp 55, IC 2810, NGC 6621, and NGC 7771), the H-flux histograms clearly show that there are significant contributions from the outer regions to the total H flux. In addition, although the H peaks are located near the nuclei, the spread of the plotted points at the left edge of the H–continuum diagrams indicates that the H peaks are displaced from the continuum peaks. We call this class of objects type 3. The next seven objects (NGC 695, NGC 828, NGC 834, NGC 877, NGC 958, NGC 3110, and NGC 5653) are galaxies in which most of the H emission comes from the outer regions. Many of them have the strongest H emission far from the nucleus and show a more extended distribution of H than of continuum emission. These objects are type 4. Arp 148 does not match any of the types described above. This may be due to the apparent double components in continuum light, probably caused by heavy dust extinction at the nucleus, which is located halfway between the components (see appendix M), or it may be related to the peculiar appearance of the large off-center ring. In any case, Arp 148 is not included in any of the above types and is treated as an exceptional object.
To parameterize the distribution of H emission, we also calculated the peak surface brightness to total flux ratio () and the H-emitting area () in the spatial-resolution and -sampling adjusted images. measures the relative importance of the nuclear region to the disk region in star-forming activity and was used by H99 as a measure of the concentration of MIR emission. is defined as the total area of emission-line region(s) brighter than a threshold value of surface brightness. We adopt a value of 3.5 10-16 erg s-1 cm-2 arcsec-2 for the threshold, which is well above the background noise for most of the images. In practice, can be used to distinguish whether star-forming activity is confined to the nuclear region or extends to the outer regions. The global properties and the parameters of the H distribution are listed in Table 4, and Table 5 lists the mean and standard deviation of these values for each type. In these tables, is the spectral curvature at 60 µm defined by C91 as the difference in the spectral indices, .
3.2.1 Star-forming Properties of Each Type
From Table 5, it is clear that the classification based on the diagrams in Figure 3 is associated with the physical characteristics of star-forming activity. For example, the star-formation efficiency (SFE), measured by (Young et al., 1986), and the dust temperature, estimated from the ratio, are significantly higher in type 1 and type 2 than type 3 and type 4 objects. In addition, type 1 objects generally show exceptionally large or small values in , , , and relative to the other types.
More evidence for differences between the types of galaxy is given by the –, –, and – diagrams shown in Figure 4. These diagrams illustrate that different types occupy different parts of the diagrams. The diagrams also indicate that objects of the same type have surprisingly similar star-forming properties. In the following sections, we summarize the observational properties of each type and attempt to reveal the nature of star-forming activity in them.
Figure 4b shows a positive correlation between and with a correlation coefficient of 0.88. As shown by C91, LIRGs also show a definite positive correlation between and ”hybrid surface brightness”, which was defined as the ratio of the total 60 µm flux and the angular area in 8.44 GHz or 1.49 GHz emission of an object. The correlation shows that objects with large tend to have a compact radio source, and therefore a large hybrid surface brightness. C91 concluded that the large values of in compact radio sources result from large optical thicknesses at 25 µm. In these sources, the H emission may also suffer from strong dust extinction, resulting in the large values. Therefore, the correlation in Figure 4b suggests that the variations in and in our sample objects are dominated by the variations in the amount of dust extinction. If this is the case, we note that in Figure 4b the type 1 objects suffer the strongest dust extinction and the type 4 objects suffer the weakest.
3.2.2 Type 1 and Type 2
The type 1 and type 2 objects are characterized by warm dust temperatures (large ), large SFE (), and strongly concentrated H emission. This means that these galaxies are forming stars actively in their nuclear regions.
In addition to the above properties, the type 1 objects show extreme properties also in other observational quantities, i.e., they have the largest / and , and the smallest and among the four types. The small indicates that the star-forming activity in these objects is confined to their nuclei, and little star formation occurs in the outer regions, as is clearly seen in the original images of Figure 1b, j, r. The large suggests that these objects have compact nuclear star-forming regions, as noted in § 3.2.1. Actually, NGC 2623 and III Zw 35, two of the type 1 objects, were observed by C91 and described as ”dominated by compact radio components.” The physical size of the compact components is about 100 pc. In Zw 049.057, another type 1 object, the radio continuum emission at 1.49 GHz is dominated by a nuclear source with an estimated diameter of 05 (Condon et al., 1990), which corresponds to 100 pc. The strong dust extinction for nuclear star-forming regions, as deduced from the large and , may have the effect of decreasing the observed H emission, causing the faint H surface brightnesses and small EW in these objects. As for the gas content, the mean value of is a factor of two smaller than for the other types, although dispersions are large.
The H-flux histograms of type 2 objects are similar to those for type 1 objects. However, the morphologies observed in the original images clearly differ: while the H and continuum images of type 2 objects are similar in the nuclear region, those of type 1 objects are not. Moreover, high resolution radio/MIR observations reveal the following difference in the distribution of star-forming regions between the two types. UGC 8335 was observed by C91 and clearly shows an extended structure with a size of 1″ ( 600 pc), in contrast to III Zw 35 and NGC 2623, which are dominated by compact radio components as noted above. In addition, the star-forming regions in NGC 1614, NGC 4194, NGC 6090, and Mrk 331 are known to be spatially extended to several hundred parsecs or 1 kpc (Soifer et al., 2001; Aalto & Hüttemeister, 2000). Thus, it would appear that although both type 1 and type 2 objects show dominant nuclear starbursts, the nuclear star-forming regions are slightly larger in type 2 objects than in type 1 objects. The bright H surface brightness and the large EW in type 2 objects may be the result of a strong concentration of star-forming regions and relatively small dust extinction, as inferred from small .
3.2.3 Type 3
As seen in the H–continuum diagrams, objects of this type show active star formation in their nuclear region. However, there is a substantial contribution from the outer regions to the total H flux. In addition, the dust temperature and SFE are lower than for the two types above.
Examination of the original H images revealed that all of the type 3 objects have bright outer star-forming regions that are extended on scales of 10 kpc. The significant contributions from the outer regions seen in the H-flux histograms originate in these star-forming regions. These are associated with the disks (NGC 23, UGC 2238, IC 2810, and NGC 7771), the tidal tail (Arp 55), or the overlap region (NGC 6621). In addition, they all show slight offsets of the order of 1 kpc between the H and continuum peaks. The offsets are not artificial effects due to incorrect subtraction of continuum emission, because most of them show significant differences in their nuclear surface-brightness profiles even between the on- and off-band images, i.e., before the subtraction of continuum emission. In NGC 7771, there is a circumnuclear starburst ring with a diameter of 1.5 kpc (Smith et al., 1999; Reunanen et al., 2000). Although the ring cannot be seen in our H image, probably because of the coarser spatial resolution, the offset between the H and continuum peaks in NGC 7771 is clearly due to the presence of the starburst ring (see appendix U). This suggests that the nuclear star-forming regions in the other type 3 objects are also extended on scales of 1 kpc or larger. If this is the case, the size of the nuclear star-forming region in these objects is similar to or larger than the adjusted point spread function, having a FWHM of 1.43 kpc. That the nuclear star-forming regions are slightly larger in size than the point spread function naturally explains why, in spite of the nearly identical range of star-formation rates (), the type 3 objects have fainter nuclear H surface brightnesses (typically by a factor of ten) and smaller EW than type 1 objects. The reduced peak surface brightness and the large contribution from the outer regions to the total H flux may cause the smaller values of as compared to type 1 and type 2 objects (Figure 4c).
3.2.4 Type 4
As noted in § 3.2, the total H fluxes of the type 4 objects are dominated by emission from extended star-forming regions. They have small , low dust temperatures, and small SFE and (Table 5). These properties indicate that the star-forming activity in these objects is relatively mild as compared with the other types. It is probably because of this that observations of these objects have been very limited in the literature to date.
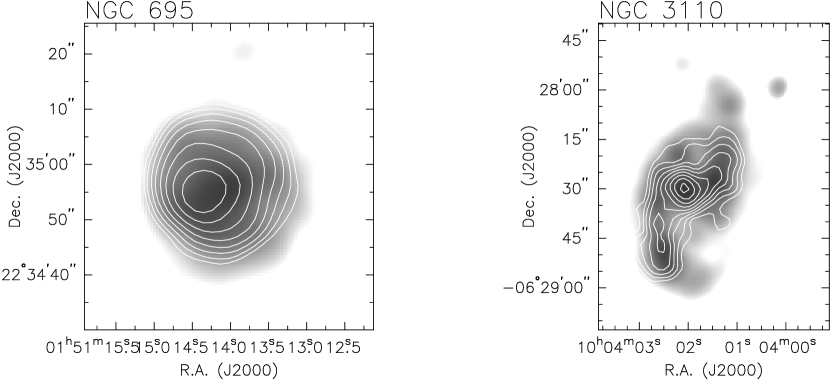
A remarkable characteristic of the distribution of star-forming regions in the type 4 objects is their knotty and asymmetric appearance. In particular, NGC 834 and NGC 5653 have a dominant extra-nuclear H source, which results in large values of As compared to the other type 4 objects (see Figure 4c). It is notable that all of the type 4 objects show small values of (Figure 4b,c), suggesting that the amount of dust extinction in these objects is relatively small. Thus, it is unlikely that the relative faintness of their nuclei in H is due to suppression by strong dust extinction. We examined this question in more detail by searching for images that trace the star-forming regions and are relatively insensitive to dust extinction. As noted in appendix Q, the Pa image of NGC 5653 (Alonso-Herrero et al., 2002) shows features that are nearly identical to our H image. In Figure 5, we compared the distribution of H in NGC 695 and NGC 3110 with 1.49-GHz radio continuum maps (Condon et al., 1990) with matched spatial resolution of 5″. Apart from a slight offset of the peak position in NGC 695, the overall appearance in H and radio continuum emission is similar in the two galaxies. Moreover, the radio emission extends beyond 10 kpc, and the total flux is dominated by emission from the outer regions as in H. In this respect, they are distinctly different from the other types, most of which show dominant nuclear sources in radio continuum emission. Therefore, the star-forming activity in the type 4 objects is probably dominated by an extended starburst rather than a nuclear one.
The type 4 objects account for an appreciable fraction of our 60 µm flux-limited sample of LIRGs: 32% in the whole sample and 46% in the lower luminosity range, . This suggests that, in addition to nuclear starbursts, star formation extending to several kiloparsecs is another attribute of star-forming activity in LIRGs.
4 Discussion
4.1 Distribution and Global Properties of Star Formation
In § 3.2, it is shown that the size of the nuclear star-forming region increases from type 1, through type 2, to type 3 objects. In the type 3 objects, there are substantial contributions from the outer regions to the total H flux. The star-forming activity in the type 4 objects is dominated by extended starbursts. If the distribution of molecular gas clouds is similar to that of star-forming regions, the density of gas clouds may also vary from type to type, being highest in the type 1 objects and lowest in type 4 objects. The higher density of gas clouds in galaxies with compact star formation will lead to a higher SFE, because of the non-linear dependence of the star-formation rate on gas density (Kennicutt, 1998). The high efficiency of star formation will then produce more photons to heat the dust and, consequently, raise the dust temperature (Young et al., 1986). In Figure 4a, galaxies with a strong concentration (type 1 and type 2) show the largest values of , i.e., the highest dust temperature, whereas galaxies that are dominated by extended starbursts (type 4) show the smallest values, with type 3 lying between the two extremes. Except for type 1, the ratio shows a similar tendency to , although the difference between the types is less clear. The small values of in the type 1 objects are also expected to be caused by the compact distribution of nuclear star-forming regions, as discussed in § 3.2.2. Therefore, the difference in the distribution of star-forming regions between the types can explain their segregation in Figure 4a.
In addition to the compactness of the nuclear star-forming regions ( 100 pc), the type 1 objects are remarkable in the small amount of molecular gas present and the nearly complete lack of star-forming activity in the outer regions. These properties suggest that they are in a late stage in the star-formation history of LIRGs (Gao & Solomon, 1999), and that most of the remaining gas has fallen to the nuclear region. In addition, all of the type 1 objects are either OH megamaser sources or OH absorbers. This suggests that there is a strong radio source in the type 1 objects, located behind an extended molecular-gas screen. It is notable that, although LIRGs with as large as type 1 are rare, Arp 220, the prototypical ULIRG, shows comparably faint H emission and large ratio (AHM). The FIR color and the presence of an OH megamaser source in Arp 220 are also similar to type 1 objects. Thus, it is probable that, as in Arp 220, the energy source of type 1 objects is a compact starburst deeply embedded in dusty molecular clouds (Downes & Solomon, 1998; Sakamoto et al., 1999, see also Baan et al. 1987). This would cause the large and the small seen in type 1 objects.
From the above discussion, we conclude that differences in the distribution of star-forming regions causes the differences in star-forming properties among the types of object. Therefore, the H–continuum diagram combined with the H-flux histogram (Figure 3) is a useful tool for investigating the properties of star-forming activity in LIRGs.
4.2 Morphological Consideration
In this subsection, we investigate the relationship between star-forming properties and the morphological class of the sample objects. As the object types defined in § 3.2 were found to be strongly correlated with the distribution and global properties of star formation, it may be useful to compare our type classification with the morphological class of the galaxies.
In Figure 6, histograms of the types are shown for each morphological class. The type 1 and type 2 objects are relatively small in number and are both dominated by nuclear starbursts, so the objects of the two types are combined and labeled as ”Type 1/2” in Figure 6. The morphological classes are defined in § 3.1. Dynamical disturbance due to galaxy interactions is expected to be the strongest in ”mergers” and to gradually become weaker in the order ”close pairs”, ”pairs”, and ”singles”. Therefore, Figure 6 implies that the more severely disturbed objects tend to have a more compact distribution of star-forming regions. Although there are several exceptions to this rule, we suggest that the degree of dynamical disturbance plays an important role in determining the distribution of star-forming regions.
From MIR imaging of seven LIRGs with morphological properties indicating the early/intermediate stages of merging, H99 found that the peak-to-total flux ratio, which is a measure of the concentration of star-forming regions (see § 3.2), increases as the projected separation of the interacting pairs becomes smaller. Morphologically, their entire sample corresponds to the class of ”close pairs” in our classification scheme, and their FIR colors are similar to our type 2 and type 3 objects. In addition, the objects with larger projected separations have FIR colors similar to type 3 objects, and the objects with smaller projected separations have FIR colors similar to type 2 objects. Therefore, H99’s and our results are complementary: whereas H99 revealed the detailed dependence of the distribution of star-forming regions on the interaction stage in a morphologically selected sample, our results show that the dependence can be extended to a sample with a broader range of morphological properties. H99 interpreted their results as a manifestation of the evolutionary sequence: as the merging process advances, star formation becomes more active and develops a more concentrated distribution. A similar interpretation may also be applicable to our sample, with the exception of the single galaxies. This issue will be discussed in the next subsection.
Mihos & Bothun (1998) and Xu et al. (2000) also found connections between dynamical states and the distribution of star-forming regions. From imaging Fabry–Perot observations of four ULIRGs, Mihos & Bothun (1998) found that the H emission is more spatially concentrated in the later stages of a galaxy interaction. Xu et al. (2000) found that relatively undisturbed systems show evenly distributed MIR and H emission in the disks of component galaxies, while severely disturbed objects show dominant nuclear components and enhanced emission in the overlap regions of the pairs. As the star-forming activity of their sample objects differs significantly from ours, we do not make detailed comparisons with these studies. Nevertheless, it is notable that these studies obtained qualitatively similar results to ours. Therefore, it is almost certain that the strength of dynamical disturbance plays a critical role in determining the distribution of star-forming regions. Our sample size, the restricted range of star-formation rates, and the broad range of morphological properties of our sample objects explain why such a clear relation emerges in Figure 6.
With respect to global star-forming properties, several statistical studies of galaxies, covering a wide range of morphological properties, have shown that they are weakly connected to the interaction strength (e.g., SSS; Xu & Sulentic, 1991; Lutz, 1992). Our results suggest that this is because the interaction strength controls the distribution of star-forming regions: the stronger the dynamical disturbance, the more compact the region to which the star-forming activity is confined, resulting in the more extreme properties of higher SFE and higher dust temperature.
4.3 Evolution of the Distribution of Star-forming Regions
In this subsection, we consider the relation between the type and the star-formation history of LIRGs.
There are remarkable differences in the size of nuclear star-forming regions and in the relative contribution of the outer regions to the total H flux between the different types of galaxy. These properties, combined with the connection between type and morphological class, suggest a sequence in the distribution of star-forming regions in interacting galaxies. At an early stage of interaction, active star formation occurs in both the nuclear and outer regions (type 3). As the process of interaction proceeds, the infall of gas clouds activates nuclear star formation, making it the dominant energy source of the system (type 2). By the final phase, most of the gas clouds have fallen into the nuclear region, and the star-forming activity is confined to the nucleus (type 1). In this process, the size of the nuclear star-forming region also becomes gradually smaller.
The evolutionary sequence above is similar to that described by Scoville & Polletta (2001), which invokes star formation induced by cloud-cloud collisions (Scoville et al., 1986). In their sequence, the cloud collision rate is increased by tidally enhanced velocity dispersion in the individual disks in the initial phase, later by the passage of the disks through each other, and lastly by concentration of the gas at smaller radii in the merged nucleus. Therefore, star formation in the outer regions is expected to be important at an earlier phase of galaxy interaction, which is consistent with the observed sequence described above. As for the variation in size of the nuclear star-forming regions, a probable cause of the slightly larger ( 1 kpc) size in type 3 objects is a nuclear resonance ring, such as that observed in NGC 7771 (see § 3.2.3). The circumnuclear star-forming ring might shrink with time as a result of the combined effect of a non-axisymmetric potential and the self-gravity of gas (Wada & Habe, 1992) or due to the friction exerted by background stars on gas clouds (Combes et al., 1992). The timescale of these processes is of the order of years. As this is shorter than the merger timescale ( years), and in some cases strong gaseous inflows can occur at early stages of galaxy interactions (Mihos & Hernquist, 1996), interacting galaxies in the type 3 phase can evolve into the type 2 or type 1 phase before the final merger. Therefore, the absence of a one-to-one correspondence between the morphological class and the type (Figure 6) does not conflict with this evolutionary sequence.
Since may vary significantly throughout the star-formation history of LIRGs (e.g., Xu et al., 2000; Murphy et al., 2001), type 3 objects may not evolve simply into type 2 and then into type 1. Our suggestion is that the distribution of star-forming regions in interacting galaxies follows the sequence above and, during some phases, the galaxies are recognized as LIRGs. Although this evolutionary model seems to succeed in explaining the processes that occur in the evolution of the distribution of star-forming regions, detailed studies of individual objects are needed to examine the validity of these conclusions.
As many of the type 4 objects are singles, we consider them separately. With the exception of NGC 828, the star-forming activity in type 4 objects is characterized by either prominent spiral arms (NGC 877, NGC 958, NGC 3110) or the brightest H source being located in the outer regions (NGC 695, NGC 834, NGC 5653), with both of these groups showing a knotty appearance in H. In addition, their morphological properties are related to the distribution of star-forming regions. All of the objects with prominent spiral arms have a small companion at a projected separation of 20–30 kpc, assuming that the faint galaxy 70″ southeast of NGC 958 has the same redshift as NGC 958. The other objects have peculiar morphologies, with no galaxy-like object within a projected radius of 100 kpc. Since strong spiral arms can be induced by the presence of a small companion (e.g., Toomre, 1981), this result suggests that the star-forming activity in the first group is enhanced by the presence of such tidally excited spiral arms. However, it is unclear whether such a process is efficient enough to induce active star formation and produce a LIRG. As for the latter group, in spite of the fact that they appear to be isolated galaxies, the structural peculiarities and the asymmetric distribution of star-forming regions suggest that their star-forming activity is also induced by galaxy interactions. This result could be explained if they are remnants of either minor mergers or high speed tidal encounters. The lack of detailed observational information about the type 4 objects makes it difficult to examine these possibilities. Two-dimensional kinematic observations are needed to reveal the nature of these objects, and may be useful in further developing our understanding of star-forming activity in LIRGs.
5 Summary
In order to investigate the relation between the distribution of star-forming regions and galaxy interactions, H imaging observations of twenty-two LIRGs were carried out using an imaging Fabry-Perot interferometer.
The H–continuum diagram
The distribution of H emission was investigated with H–continuum diagrams, using the continuum surface brightness as an indicator of the distance from the galactic center, and with H-flux histograms, in which the distribution of integrated H flux was shown as a function of continuum surface brightness. The sample objects were classified into four types according to the appearance in the diagrams. These types were found to be strongly related to global star-forming properties, such as FIR color, SFE, and dust extinction. The variations in these properties between the types of object can be explained by differences in the distribution of star-forming regions.
Connection with morphological properties
We studied the galaxy morphology of each of the four types, and found a clear tendency for severely disturbed objects to show concentrated distributions of star-forming regions. This is consistent with previous studies. However, the larger sample size, broader range of morphological types, and the restricted range of star-formation rates in our work provide a clearer result.
Evolution of the distribution of star-forming regions
From the sequence of the distribution of star-forming regions and its relation to morphological properties, we propose a scenario in which the relative importance of nuclear and extended starbursts, as well as the size of nuclear star-forming regions, changes with time.
Extended starburst
The star-forming activity in an appreciable fraction of our 60µm flux-limited sample of LIRGs is dominated by extended starbursts. This suggests that star formation extending to several kiloparsecs is also important in LIRGs. Therefore, it may be crucial to determine the triggering mechanism of star formation in these objects, in order to better understand star-forming activity in LIRGs.
We would like to thank the staff of Okayama Astrophysical Observatory for their kind help during the observations.
References
- Aalto & Hüttemeister (2000) Aalto, S., & Hüttemeister, S. 2000, A&A, 362, 42
- Alonso-Herrero et al. (2001) Alonso-Herrero, A., Engelbracht, C. W., Rieke, M. J., Rieke, G. H., & Quillen, A. C. 2001, ApJ, 546, 952
- Alonso-Herrero et al. (2002) Alonso-Herrero, A., Rieke, G. H., Rieke, M. J., & Scoville, N. Z. 2002, AJ, 124, 166
- Armus et al. (1990) Armus, L., Heckman, T. M., & Miley, G. K. 1990, ApJ, 364, 471 (AHM)
- Baan et al. (1987) Baan, W. A., Henkel, C., & Haschick, A. D. 1987, ApJ, 320, 154
- Barnes & Hernquist (1991) Barnes, J., & Hernquist, L. E. 1991, ApJ, 370, 65
- Bergvall (1981) Bergvall, N. 1981, A&A, 97, 302
- Bizyaev et al. (2001) Bizyaev, D. V., Zasov, A. V., & Kaisin, S. S., 2001, Astronomy Letters, 27, 217
- Bryant & Scoville (1999) Bryant, P. M., & Scoville, N. Z. 1999, AJ, 117, 2632
- Bushouse (1987) Bushouse, H. A. 1987, ApJ, 320, 49
- Bushouse et al. (1988) Bushouse, H. A., Werner, M. W., & Lamb, S. A. 1988, ApJ, 335, 74
- Bushouse et al. (1998) Bushouse, H. A., Telesco, C. M., & Werner, M. W. 1998, AJ, 115, 938
- Chapman et al. (1990) Chapman J. M., Staveley-Smith, L., Axon, D. J., Unger, S. W., Cohen, R. J., Pedlar, A., & Davies, R. D. 1990, MNRAS, 244, 281
- Chitre & Jog (2002) Chitre, A., Jog, C. J. 2002, A&A, 388, 407
- Combes et al. (1992) Combes, F., Gerin, M., Nakai, N., Kawabe, R, & Shaw, M. A. 1992, A&A, 258, L27
- Combes et al. (1994) Combes, F., Prugniel, P., Rampazzo, R., & Sulentic, J. W. 1994, A&A, 281, 725
- Condon et al. (1990) Condon, J. J., Helou, G., Sanders, D. B., & Soifer, B. T. 1990, ApJS, 73, 359
- Condon et al. (1991) Condon, J. J., Huang, Z. -P., Yin, Q. F., & Thuan, T. X. 1991, ApJ, 378, 65 (C91)
- Condon et al. (1996) Condon, J. J., Helou, G., Sanders, D. B., & Soifer, B. T. 1996, ApJS, 103, 81
- Domingue et al. (2003) Domingue, D. L., Sulentic, J. W., Xu, C., Mazzarella, J., & Gao, Y. 2003, AJ, 125, 555
- Dopita et al. (2002) Dopita, M. A., Pereira, M., Kewley, L. J., & Capaccioli, M. 2002, ApJS, 143, 47
- Downes & Solomon (1998) Downes, D., & Solomon, P. M. 1998, ApJ, 507, 615
- Gao & Solomon (1999) Gao, Y., & Solomon, P. M. 1999, ApJ, 512, 99
- Garcia (1993) Garcia, A. M. 1993, A&AS, 100, 47
- Haas et al. (2000) Haas, M., Klaas, U., Coulson, I., Thommes, E., & Xu, C. 2000, A&A, 356, L83
- Hodge & Kennicutt (1983) Hodge, P. W., & Kennicutt, R. C., Jr. 1983, ApJ, 267, 563
- Hummel et al. (1987) Hummel, E., van der Hulst, J. M., Keel, W. C., & Kennicutt, R. C., Jr. 1987, A&AS, 70, 517
- Hutchings & Neff (1991) Hutchings, J. B., & Neff, S. G. 1991, AJ, 101, 434
- Hwang et al. (1999) Hwang, C. -Y., Lo, K. Y., Gao, Y., Gruendl, R. A., & Lu, N. Y. 1999, ApJ, 511, L17 (H99)
- Ishigaki et al. (2000) Ishigaki, T., Yoshida, M., Aoki, K., Ohtani, H., Sugai, H., Hayashi, T., Ozaki, S., Hattori, T., & Ishii, M. 2000, PASJ, 52, 185
- Joy & Harvey (1987) Joy, M., & Harvey, P. M. 1987, ApJ, 315, 480
- Kennicutt et al. (1987) Kennicutt, R. C., Jr., Keel, W. C., van der Hulst, J. M., Hummel, E., & Roettiger, K. A. 1987, AJ, 93, 1011
- Kennicutt (1998) Kennicutt, R. C., Jr. 1998, ApJ, 498, 541
- Kewley et al. (2002) Kewley, L. J., Geller, M. J., Jansen, R. A., & Dopita, M. A. 2002, AJ, 124, 3135
- Kim et al. (1995) Kim, D. -C., Sanders, D. B., Veilleux, S., Mazzarella, J. M., & Soifer, B. T. 1995, ApJS, 98, 129
- Larson & Tinsley (1978) Larson, R. B., & Tinsley, B. M. 1978, ApJ, 219, 46
- Le Floc’h et al. (2002) Le Floc’h, E., Charamandaris, V., Laurent, O., Mirabel, I. F., Gallais, P., Sauvage, M., Vigroux, L., & Cesarsky, C. 2002, A&A, 391, 417
- Lehnert & Heckman (1996) Lehnert, M. D., & Heckman, T. M. 1996, ApJ, 472, 546 (LH96)
- Lehnert & Heckman (1995) Lehnert, M. D., & Heckman, T. M. 1995, ApJS, 97, 89
- Liu & Kennicutt (1995) Liu, C. T., & Kennicutt, R. C., Jr 1995, ApJS, 100, 325
- Lutz (1992) Lutz, D. 1992, A&A, 259, 462
- Lutz!et al. (1999) Lutz, D., Veilleux, S., & Genzel, R. 1999, ApJ, 517, 13
- Martin et al. (1988) Martin, J. M., Bottinelli, L., Dennefeld, M., Gouguenheim, L., Handa, T., Le Squeren, A. M., Nakai, N., & Sofue, Y. 1988, A&A, 195, 71
- Mihos & Hernquist (1996) Mihos, J. C., & Hernquist, L. 1996, ApJ, 464, 641
- Mihos & Bothun (1998) Mihos, J. C., & Bothun, G. D. 1998, ApJ, 500, 619 (MB98)
- Mirabel et al. (1998) Mirabel, I. F., Vigroux, L., Charmandaris, V., Sauvage, M., Gallais, P., Tran, D., Cesars, C., Madden S. C., & Duc, P. -A. 1998, A&A, 333, L1
- Mirabel et al. (1990) Mirabel, I. F., Booth, R. S., Johansson, L. E. B., Garay, G., & Sanders, D. B. 1990, A&A, 236, 327
- Murphy et al. (2001) Murphy, T. W., Jr., Soifer, B. T., Matthews, K., & Armus, L. 2001, ApJ, 559, 201
- Nordgren et al. (1997) Nordgren, T. E., Chengalur, J. N., Salpeter, E. E, & Yervant, T. 1997, AJ, 114, 77
- Ohtani et al. (1998) Ohtani, H., Ishigaki, T., Maemura, H., Hayashi, T., Sasaki, M., Ozaki, S., Hattori, T., Aoki, K., & Sugai, H. 1998, in Optical Astronomical Instrumentation, ed. S. D’Odorico, Proc. SPIE, 3355, 750
- Pihlström et al. (2001) Pihlström, Y. M., Conway, J. E., Booth, R. S., Diamond, P. J. & Polatidis, A. G. 2001, A&A, 377, 413
- Reunanen et al. (2000) Reunanen, J, Kotilainen, J. K., Laine, S., & Ryder, S. D. 2000, ApJ, 529, 853
- Rozas et al. (1998) Rozas, M., Knapen, J. H., & Beckman, J. E. 1998, MNRAS, 301, 631
- Ryder & Dopita (1994) Ryder, S. D., & Dopita, M. A. 1994, ApJ, 430, 142
- Sakamoto et al. (1999) Sakamoto, K., Scoville, N. Z., Yun, M. S., Crosas, M., Genzel, R., & Tacconi, L. J. 1999, ApJ, 514, 68
- Sanders & Mirabel (1996) Sanders, D. B., & Mirabel, I. F. 1996, ARA&A, 34, 749
- Sanders et al. (1995) Sanders, D. B., Egami, E., Lipari, S., Mirabel, I. F., & Soifer, B. T. 1995, AJ, 110, 1993
- Sanders et al. (1991) Sanders, D. B., Scoville, N. Z., & Soifer, B. T. 1991, ApJ, 370, 158 (SSS)
- Scoville et al. (1986) Scoville, N. Z., Sanders, D. B., & Clements, D. P. 1986, ApJ, 310, 77
- Scoville et al. (2000) Scoville, N. Z., Evans, A. S., Thompson, R., Rieke, M. J., Hines, D. C., Low, F. J., Dinshaw, N., Surace, J. A., & Armus, L. 2000, AJ, 119, 991
- Scoville & Polletta (2001) Scoville, N. Z., & Polletta, M. 2001, in ASP Conf. Ser. 249, The Central Kiloparsec of Starbursts and AGN: The La Palma Connection, ed. J. H. Knapen, J. E. Beckman, I. Shlosman, & T. J. Mahoney (San Francisco: ASP), 591
- Smith et al. (1996) Smith, D. A., Herter, T., Haynes, M. P., Beichman, C. A., Gautier, T. N., III 1996, ApJS, 104, 217
- Smith et al. (1999) Smith, D. A., Herter, T., Haynes, M. P., & Neff, S. G. 1999, ApJ, 510, 669
- Soifer et al. (2001) Soifer, B. T., Neugebauer, G., Matthews, K., Egami, E., Weinberger, A. J., Ressler, M., Scoville, N. Z., Stolovy, S. R., Condon, J. J., Becklin, E. E. 2001, AJ, 122, 1213
- Soifer et al. (2000) Soifer, B. T., Neugebauer, G., Matthews, K., Egami, E., Becklin, E. E., Weinberger, A. J., Ressler, M., Werner, M. W., Evans, A. S., Scoville, N. Z., Surace, J. A., & Condon, J. J. 2000, AJ, 119, 509
- Soifer et al. (1989) Soifer, B. T., Boehmer, L., Neugebauer, G., & Sanders, D. B. 1989, AJ, 98, 766
- Stanford & Bushouse (1991) Stanford, S. A., & Bushouse, H. A. 1991, ApJ, 371, 92
- Sulentic & de Mello Rabaca (1993) Sulentic, J. W., & de Mello Rabaca, D. F. 1993, ApJ, 410, 520
- Taniguchi et al. (1999) Taniguchi, Y., Yoshino, A., Ohyama, Y., & Nishiura, S. 1999, ApJ, 514, 660
- Toomre (1981) Toomre, A. 1981, in The Structure and Evolution of Normal Galaxies, ed. S. M. Fall & D. Lynden-Bell (Cambridge: Cambridge Univ. Press), 111
- Veilleux et al. (1995) Veilleux, S., Kim, D. -C., Sanders, D. B., Mazzarella, J. M., & Soifer, B. T. 1995, ApJS, 98, 171
- Wada & Habe (1992) Wada, K., & Habe, A. 1992, MNRAS, 258, 82
- Wang et al. (1991) Wang, Z., Scoville, N. Z., & Sanders, D. B. 1991, ApJ, 368, 112
- Wright et al. (1990) Wright, G. S., James, P. A., Joseph, R. D., & McLean, I. S. 1990, Nature, 344, 417
- Xu et al. (2000) Xu, C., Gao, Y., Mazzarella, J., Lu, N., Sulentic, J. W., & Domingue, D. L. 2000, ApJ, 541, 644
- Xu & Sulentic (1991) Xu, C., & Sulentic, J. W. 1991, ApJ, 374, 407
- Young et al. (1986) Young, J. S., Kenney, J. D., Tacconi, L., Claussen, M. J., Huang, Y. -L., Tacconi-Garman, L., Xie, S., & Schloerb, F. P. 1986, ApJ, 311, 17
- Zink et al. (2000) Zink, E. C., Lester, D. F., Doppmann, G. H., & Harvey, P. M. 2000, ApJS, 131, 413


| Name | czaaThese values are taken from SSS. The values were calculated from using a CO to H2 conversion factor of 3 cm-2 (K km s-1)-1. | aaThese values are taken from SSS. The values were calculated from using a CO to H2 conversion factor of 3 cm-2 (K km s-1)-1. | aaThese values are taken from SSS. The values were calculated from using a CO to H2 conversion factor of 3 cm-2 (K km s-1)-1. | aaThese values are taken from SSS. The values were calculated from using a CO to H2 conversion factor of 3 cm-2 (K km s-1)-1. | bbThe flux densities are from Soifer et al. (1989) and Sanders et al. (1995). | bbThe flux densities are from Soifer et al. (1989) and Sanders et al. (1995). | bbThe flux densities are from Soifer et al. (1989) and Sanders et al. (1995). |
|---|---|---|---|---|---|---|---|
| (km s-1) | (Mpc) | () | () | (Jy) | (Jy) | (Jy) | |
| NGC 23 | 4536 | 61.3 | 9.68 | 11.05 | 1.24 | 8.77 | 14.96 |
| III Zw 35 | 8257 | 109.3 | 9.84 | 11.55 | 1.00 | 11.86 | 13.75 |
| NGC 695 | 9769 | 129.8 | 10.34 | 11.63 | 0.81 | 7.61 | 13.80 |
| NGC 828 | 5359 | 72.6 | 10.14 | 11.32 | 1.04 | 12.03 | 24.38 |
| NGC 834 | 4630 | 62.8 | 9.55 | 10.94 | 0.87 | 6.81 | 12.76 |
| NGC 877 | 3866 | 50.8 | 9.63 | 11.03 | 1.40 | 11.76 | 23.34 |
| NGC 958 | 5896 | 76.4 | 10.14 | 11.16 | 0.95 | 5.90 | 14.99 |
| UGC 2238 | 6478 | 85.2 | 10.14 | 11.27 | 0.63 | 8.16 | 15.22 |
| NGC 1614 | 4847 | 62.3 | 10.03 | 11.61 | 7.82 | 33.12 | 36.19 |
| NGC 2623 | 5538 | 76.1 | 9.77 | 11.54 | 1.85 | 25.72 | 27.36 |
| Arp 55 | 11957 | 162.7 | 10.46 | 11.70 | 0.62 | 6.53 | 10.21 |
| NGC 3110 | 5091 | 69.3 | 10.30 | 11.26 | 1.10 | 11.68 | 23.16 |
| Arp 148 | 10438 | 143.3 | 10.18 | 11.59 | 0.37 | 6.95 | 10.99 |
| IC 2810 | 10299 | 140.5 | 10.26 | 11.53 | 0.58 | 5.60 | 9.80 |
| NGC 4194 | 2620 | 41.4 | 9.28 | 11.09 | 4.57 | 25.66 | 26.21 |
| UGC 8335 | 9296 | 129.2 | 10.13 | 11.76 | 1.96 | 12.01 | 12.92 |
| NGC 5653 | 3618 | 54.4 | 9.63 | 11.03 | 1.33 | 10.27 | 21.86 |
| Zw 049.057 | 3870 | 52.3 | 9.47 | 11.22 | 0.93 | 21.06 | 29.88 |
| NGC 6090 | 8831 | 123.3 | 10.15 | 11.51 | 1.22 | 6.25 | 9.34 |
| NGC 6621/22 | 6234 | 88.4 | 10.01 | 11.22 | 1.02 | 6.99 | 12.35 |
| NGC 7771 | 4346 | 58.6 | 9.95 | 11.35 | 2.18 | 20.46 | 37.42 |
| Mrk 331 | 5385 | 72.3 | 10.11 | 11.41 | 2.56 | 17.32 | 20.86 |
| Name | Date | Wavelength | Exposure time | Spatial resolutionaaEstimated from FWHMs of field stars in the final images after data reduction. | Remark |
|---|---|---|---|---|---|
| (Å) | (seconds) | ||||
| NGC 23 | 2000 October 26 | 6663 | 1800 2 | 233 | on-band |
| 6548, 6751 | 1800 2 | off-band | |||
| III Zw 35 | 2000 January 4 | 6746 | 1800 2 | 162 | on-band |
| 6631, 6836 | 1800 2 | off-band | |||
| NGC 695 | 2000 January 4 | 6773 | 1800 2 | 170 | on-band |
| 6657 | 1800 | off-band | |||
| NGC 828 | 2000 October 27 | 6681 | 1800 747 | 242 | on-band |
| 6769 | 1800 | off-band | |||
| NGC 834 | 2000 October 30 | 6663 | 1800 1389 | 201 | on-band |
| 6752 | 1800 | off-band | |||
| NGC 877 | 2000 October 26 | 6648 | 1800 | 217 | on-band |
| 6534, 6736 | 1800 2 | off-band | |||
| NGC 958 | 2000 January 8 | 6689 | 1800 | 157 | on-band |
| 6573 | 1547 | off-band | |||
| UGC 2238 | 1999 December 12 | 6703 | 1800 | 178 | on-band |
| 6790 | 1800 | off-band | |||
| NGC 1614 | 1999 December 12 | 6667 | 900 2 | 183 | on-band |
| 6756 | 1800 | off-band | |||
| NGC 2623 | 2000 October 30 | 6684 | 1800 | 205 | on-band |
| 6773 | 1800 | off-band | |||
| Arp 55 | 2000 January 8 | 6821 | 1800 2 | 167 | on-band |
| 6705, 6920 | 1800 2 | off-band | |||
| NGC 3110 | 2000 January 8 | 6673 | 1800 | 135 | on-band |
| 6558, 6762 | 1800 2 | off-band | |||
| Arp 148 | 2000 January 4 | 6789 | 1800 2 | 173 | on-band |
| 6672, 6860 | 1800 2 | off-band | |||
| IC 2810 | 2000 January 4 | 6647 | 1800 2 | 205 | on-band |
| 6672, 6860 | 1800 2 | off-band | |||
| NGC 4194 | 2001 April 19 | 6618 | 1800 2 | 175 | on-band |
| 6504, 6706 | 1800 2 | off-band | |||
| UGC 8335 | 2001 April 22 | 6766 | 1800 2 | 228 | on-band |
| 6650, 6856 | 1800 2 | off-band | |||
| NGC 5653 | 2001 April 22 | 6641 | 1800 | 201 | on-band |
| 6527, 6729 | 1800 2 | off-band | |||
| Zw 049.057 | 2001 April 22 | 6641 | 1800 | 283 | on-band |
| 6527 | 1800 | off-band | |||
| NGC 6090 | 2001 April 19 | 6754 | 1800 | 180 | on-band |
| 6638 | 1800 | off-band | |||
| NGC 6621/22 | 2001 April 22 | 6696 | 1800 2 | 149 | on-band |
| 6581, 6786 | 1800 2 | off-band | |||
| NGC 7771 | 2000 October 30 | 6657 | 1800 2 | 252 | on-band |
| 6542, 6746 | 1800 2 | off-band | |||
| Mrk 331 | 2000 October 27 | 6683 | 1800 2 | 189 | on-band |
| 6568, 6772 | 1800 2 | off-band |
| Name | Reference | ||
|---|---|---|---|
| total | expected | ||
| III Zw 35 | 11.55 | 1 | |
| north | 11.55 | ||
| south | — | ||
| Arp 55 | 11.70 | 2 | |
| east | 11.55 | ||
| west | 11.16 | ||
| UGC 8335 | 11.76 | 2 | |
| southeast | 11.68 | ||
| northwest | 10.88 | ||
| NGC 6090 | 11.51 | 3 | |
| northeast | 11.47 | ||
| southwest | 10.50 | ||
| NGC 6621/22 | 11.22 | 4 | |
| NGC 6621 | 11.22 | ||
| NGC 6622 | — | ||
| NGC 877 | 11.03 | 10.95 | 2 |
| NGC 3110 | 11.26 | 11.23 | 2 |
| IC 2810 | 11.53 | 11.36 | 2 |
| NGC 7771 | 11.35 | 11.29 | 2 |
| Mrk 331 | 11.41 | 11.41 | 5 |
| Name | Morphological | Type | bb | ||||||
|---|---|---|---|---|---|---|---|---|---|
| ClassaaM=merger, C=close pair, P=pair, and S=single | (kpc-2) | (kpc2) | () | () | |||||
| NGC 23 | S | 3 | -0.879 | 2.036 | 1.37 | 0.85 | 0.23 | 1.19 | 2.927 |
| III Zw 35 | C | 1 | -0.720 | 1.006 | 1.71 | 1.07 | 0.06 | 2.54 | 4.123 |
| NGC 695 | S | 4 | -1.685 | 2.313 | 1.29 | 0.97 | 0.26 | 1.39 | 2.922 |
| NGC 828 | S | 4 | -1.377 | 1.18 | 1.06 | 0.31 | 1.25 | ||
| NGC 834 | S | 4 | -1.125 | 1.901 | 1.39 | 0.89 | 0.27 | 1.15 | 2.958 |
| NGC 877 | P | 4 | -1.771 | 2.581 | 1.40 | 0.92 | 0.30 | 1.09 | 2.923 |
| NGC 958 | S | 4 | -1.887 | 2.608 | 1.02 | 0.79 | 0.40 | 0.26 | 2.844 |
| UGC 2238 | S | 3 | -1.357 | 1.783 | 1.13 | 1.11 | 0.27 | 1.71 | 3.607 |
| NGC 1614 | M | 2 | -0.602 | 2.122 | 1.58 | 0.63 | 0.04 | 1.48 | 3.085 |
| NGC 2623 | M | 1 | -0.746 | 1.211 | 1.77 | 1.14 | 0.03 | 2.89 | 4.557 |
| Arp 55 | C | 3 | -1.105 | 1.373 | 1.24 | 1.02 | 0.19 | 1.81 | 3.692 |
| NGC 3110 | P | 4 | -1.442 | 2.292 | 0.96 | 1.03 | 0.30 | 1.36 | 2.853 |
| Arp 148 | M | -1.446 | 1.781 | 1.41 | 1.27 | 0.20 | 2.45 | 3.613 | |
| IC 2810 | P | 3 | -1.057 | 1.532 | 1.27 | 0.98 | 0.24 | 1.49 | 3.736 |
| NGC 4194 | M | 2 | -0.577 | 1.939 | 1.81 | 0.75 | 0.01 | 1.93 | 2.954 |
| UGC 8335 | C | 2 | -0.660 | 1.624 | 1.63 | 0.79 | 0.03 | 1.93 | 3.341 |
| NGC 5653 | S | 4 | -1.008 | 1.965 | 1.40 | 0.89 | 0.33 | 0.86 | 2.827 |
| Zw 049.057 | S | 1 | -0.444 | 0.975 | 1.75 | 1.35 | 0.15 | 2.88 | 4.741 |
| NGC 6090 | C | 2 | -0.840 | 1.36 | 0.71 | 0.17 | 1.08 | ||
| NGC 6621/22 | C | 3 | -0.877 | 1.861 | 1.21 | 0.84 | 0.25 | 1.04 | 3.202 |
| NGC 7771 | P | 3 | -0.914 | 2.101 | 1.40 | 0.97 | 0.26 | 1.38 | 3.541 |
| Mrk 331 | P | 2 | -0.640 | 1.30 | 0.83 | 0.08 | 1.82 |
| Type | ||||||||||||||||
|---|---|---|---|---|---|---|---|---|---|---|---|---|---|---|---|---|
| (kpc-2) | (kpc2) | ( ) | () | |||||||||||||
| mean | mean | mean | mean | mean | mean | mean | mean | |||||||||
| 1 | -0.637 | 0.137 | 1.064 | 0.105 | 11.437 | 0.153 | 1.743 | 0.025 | 1.191 | 0.120 | 0.081 | 0.052 | 4.474 | 0.259 | 2.767 | 0.163 |
| 2 | -0.664 | 0.093 | 1.895 | 0.206 | 11.476 | 0.225 | 1.536 | 0.186 | 0.741 | 0.070 | 0.067 | 0.059 | 3.127 | 0.161 | 1.646 | 0.329 |
| 3 | -1.032 | 0.170 | 1.781 | 0.259 | 11.353 | 0.211 | 1.270 | 0.092 | 0.963 | 0.095 | 0.244 | 0.026 | 3.451 | 0.291 | 1.436 | 0.271 |
| 4 | -1.471 | 0.305 | 2.277 | 0.271 | 11.196 | 0.217 | 1.234 | 0.172 | 0.938 | 0.076 | 0.314 | 0.043 | 2.888 | 0.049 | 1.050 | 0.363 |
Note. — All values except for use logarithmic scales.
Appendix A NGC 23 (Mrk 545)
NGC 23 (Figure 1a) is a barred spiral galaxy paired with NGC 26, a spiral galaxy, with an apparent separation of 92 ( 160 kpc). In the H image, NGC 23 shows a bright nuclear component and extended emission having the appearance of an integral sign. The nuclear-component has an asymmetric shape with a peak position in H offset by 17 to the west of the nucleus. In the H equivalent-width map, a ring-like feature that surrounds the nucleus at a radius of 7″ ( 2 kpc) is seen. This means that the H distribution is less sharply peaked than the continuum in the nuclear region.
The continuum source located 30″ southeast of the nucleus is a foreground star.
Appendix B III Zw 35
III Zw 35 (Figure 1b) is composed of two galaxies separated by 9″ ( 5 kpc) along a position angle of 20∘. The northern galaxy is the dominant source in the optical continuum image. In H, it appears compact but slightly elongated in the direction of the minor axis. The southern galaxy also shows clear elongation along a P.A. of 23∘. Although the two galaxies have comparable fluxes in H, the majority of the radio continuum (and also probably FIR) emission originates in the northern galaxy (Chapman et al., 1990).
From optical emission lines, the nucleus of the northern galaxy is classified as a LINER and the southern one as an H II nucleus (Veilleux et al., 1995; Chapman et al., 1990). The morphological appearance in radio continuum emission suggests that star-forming activity dominates the energetics of the northern galaxy (Pihlström et al., 2001); the classification as a LINER may be due to a contribution from shock heating, possibly driven by superwind activity (Taniguchi et al., 1999; Lutz!et al., 1999). The elongated appearance described above is consistent with this interpretation: a significant [N II] contribution to the H emission may enhance the shock heated regions, which are extended in the direction of the minor axis.
Note that the analyses presented in § 3.2 are made only for the northern galaxy.
Appendix C NGC 695
In the optical/near-IR continuum images, NGC 695 (Figure 1c) has the appearance of a disturbed face-on spiral galaxy (Hutchings & Neff, 1991; Smith et al., 1996). Our H image reveals more clearly the knotty and chaotic distribution of star-forming regions in this galaxy. The brightest source in H is located 56 (3.5 kpc) north-west of the nucleus, corresponding to the position where the inner spiral arm seen in the continuum image terminates.
Appendix D NGC 828
NGC 828 (Figure 1d) is a disturbed spiral galaxy with a prominent dust lane to the southwest side of the main body. In the H image, a diffuse source at the center and two sources located nearly symmetrically along the major axis of the galaxy can be seen. The surface brightnesses of the three sources are comparable.
Wang et al. (1991) suggested, based on an anomaly in the CO rotation curve and the presence of two emission peaks (the nucleus and one 4″ to the southeast) in the radio continuum image, that this galaxy is an ongoing merger.
Appendix E NGC 834
NGC 834 (Figure 1e) is a spiral galaxy with a complicated appearance. It belongs to a group (Garcia, 1993), and its nearest neighbors are NGC 841, 106 ( 190 kpc) to the south, and UGC 1673, 94 ( 170 kpc) to the north. The brightest H source lies 8″ (2.4 kpc) northwest of the nucleus. A large ring of star-forming regions with a radius of 15″ is seen in the H equivalent-width map. This ring is also seen in the combined color-index () image of Bizyaev et al. (2001).
Appendix F NGC 877
NGC 877 (Figure 1f) is a late-type spiral galaxy paired with NGC 876, a spiral galaxy 21 ( 31 kpc) to the southwest. These two galaxies are also members of a group that includes NGC 870 and NGC 871.
The H image of NGC 877 shows numerous knots distributed along the two spiral arms, which appear slightly disturbed. It is interesting that there are several pairs of relatively bright H sources located at nearly opposite positions with respect to the nucleus; this is a phenomenon seen in several grand-design spirals without bars (Rozas et al., 1998). The pair of brightest sources located at the ends of the two spiral arms is a typical example. The H emission from the nucleus is much fainter than that from the spiral arms.
Appendix G NGC 958
NGC 958 (Figure 1g) is a late-type spiral galaxy viewed at a high inclination. There are several faint galaxy-like objects around NGC 958. As in normal late-type spirals, the H emission is distributed along the spiral arms, and the nucleus is not detected in H.
Appendix H UGC 2238
UGC 2238 (Figure 1h) has a highly elongated appearance. In deep optical/near-infrared images it has two faint spiral arms and a faint tail-like structure. Smith et al. (1996) suggested, based on the tail-like structure and the single nucleus, that this galaxy is an advanced merger. The H image shows that UGC 2238 has a relatively flat distribution of H emission as compared to the other galaxies in our sample. The nucleus is located at the southwest edge of the emission-line region.
Appendix I NGC 1614
NGC 1614 (Figure 1i) is one of the most well-studied objects in our sample. It is a strongly interacting galaxy in a late stage of the merging process, with spectacular tidal features. Our H image has identical features to the H[N II] image by AHM and Dopita et al. (2002): a bright nuclear source, the inner spiral arms, and H II regions along the southwestern linear tail. The nuclear source is very compact and the nuclear ring (Alonso-Herrero et al., 2001) is not spatially resolved in our image [with 18 ( 0.5 kpc) seeing].
Appendix J NGC 2623
NGC 2623 (Figure 1j) is a nearly completed merger showing an profile at K-band (Wright et al., 1990; Stanford & Bushouse, 1991; Chitre & Jog, 2002) and two long tidal tails. Extensive observations of this galaxy have been made from the X-ray to the radio. The radio continuum (Condon et al., 1991), mid-infrared (Soifer et al., 2001), CO (Bryant & Scoville, 1999), and H+[N II] (AHM) emission distributions are dominated by a nuclear compact source. In our H image, the nucleus also dominates the emission, and there is little emission in the outer regions, except for a faint source 8″ ( 3 kpc) southeast of the nucleus.
Appendix K Arp 55 (UGC 4881)
Arp 55 (Figure 1k) is an interacting system of two galaxies with a separation of 115 ( 9 kpc). To the east of the main body, a bright tail extends towards the south. The western nucleus shows compact H emission with a slight extension in the north-south direction. The eastern nucleus shows an arm-like structure extending towards the north, and the peak position in H is displaced by 1″ to the southwest of the nucleus. There are also four H sources along the eastern tail.
Appendix L NGC 3110
NGC 3110 (Figure 1l) is a distorted spiral galaxy with a small companion 18 ( 36 kpc) to the southwest (MCG –01-26-013). An H+[N II] image of this galaxy (Dopita et al., 2002) shows bright H knots along the two spiral arms. Our H image also shows the knots, as well as a possible bar-like structure through the nucleus with P.A. 60∘ and length 20″. The bar-like structure cannot be seen in our continuum image. Zink et al. (2000) investigated the distribution of 100µm emission and concluded that the disk or arms of NGC 3110 contribute up to 35% of the total FIR flux.
The companion galaxy MCG –01-26-013 (Figure 2a) shows H emission associated with the nucleus (Dopita et al., 2002). There is also an H source 3″ east of the nucleus.
Appendix M Arp 148
Arp 148 (Figure 1m), known as Mayall’s Object, is a ring galaxy composed of an elongated main body with double components separated by 5″ ( 4 kpc) and an oval ring with a diameter of 16″ to the west of the main body. From JHKL-band mapping, Joy & Harvey (1987) found that the nucleus of Arp 148 lies between the double optical components of the main body, and concluded that the nucleus suffers from heavy extinction. Despite the heavy extinction, the H emission peaks midway between the double components. The ring is more prominent in H than continuum light.
Appendix N IC 2810
IC 2810 (Figure 1n) is a disk galaxy viewed nearly edge-on. In contrast to the continuum image, which shows a bright nucleus and a linearly extended disk, the H image reveals a warped structure that is more distinct on the south side of the nucleus. The brightest H emission in the nucleus is extended by 3″ ( 2 kpc) towards the north.
There is a small companion galaxy (IC 2810b), which is also edge-on 70″ ( 48 kpc) to the southeast. Compact H emission is detected from the nucleus (Figure 2b).
Appendix O NGC 4194
NGC 4194 (Figure 1o), known as The Medusa, is a merger with tidal features of peculiar appearance. An H+[N II] image is presented by AHM and shows a single dominant nucleus with several circumnuclear hotspots embedded in a faint halo of 3 kpc diameter. Our H image reproduces these features, though with coarser spatial resolution. A close inspection of the H image suggests that the nuclear source has an arc-like appearance. This arc-like structure is composed of the brightest nuclear source and two extensions ( 3″, 0.6 kpc) to the west and the south. The western extension is reminiscent of the one seen in the radio continuum map by Condon et al. (1990, see also ).
Appendix P UGC 8335 (Arp 238)
UGC 8335 (Figure 1p) is a pair of spiral galaxies separated by 35″ ( 22 kpc), with a linking bridge and strong tidal tails. Most of the H flux is emitted by a compact source at the nucleus of the eastern galaxy. This is also true in radio continuum emission and probably in FIR (see Table A Study of the Distribution of Star-Forming Regions in Luminous Infrared Galaxies by Means of H Imaging Observations). The western galaxy has a relatively extended distribution of H emission, with an elongated nuclear component and several sources along the western tidal tail.
Note that the analyses presented in § 3.2 are made only for the eastern galaxy.
Appendix Q NGC 5653
NGC 5653 (Figure 1q) is an isolated spiral galaxy classified as a lopsided galaxy (Rudnick et al. 2000). The H emission is distributed along the spiral arms and the brightest H II regions are located 10″ ( 2.6 kpc) west of the nucleus. The Pa distribution in NGC 5653 derived from HST/NICMOS observations (Alonso-Herrero et al., 2002) shows nearly identical features to our H image: bright H II regions to the west of the nucleus and no bright nuclear emission.
Appendix R Zw 049.057
Zw 049.057 (Figure 1r) is a highly inclined disk galaxy. Although several galaxies are seen around Zw 049.057, those with known redshifts belong to the background cluster of galaxies Abell 2040 at a redshift of 0.046 and most of the others may also belong to it.
The nucleus of Zw 049.057 suffers from heavy extinction (Scoville et al., 2000) and shows OH megamaser emission (Baan et al., 1987; Martin et al., 1988). The H emission is very faint and confined to the nucleus. A Pa image of Zw 049.057 was presented by Alonso-Herrero et al. (2002) It shows only faint Pa emission in the nuclear region. In spite of its highly elongated appearance in continuum light, Scoville et al. (2000) found that the near-infrared light profiles are better fitted by an law than by an exponential disk profile.
Appendix S NGC 6090 (Mrk 496)
NGC 6090 (Figure 1s) is a pair of spiral galaxies with a compact main body and long tidal tails (Bergvall, 1981). Although the two galaxies show strong H emission at their nuclei, the H emission appears to be brighter on the companion-facing side of each galaxy. This effect is seen more clearly in the equivalent-width map: the H equivalent width peaks 15 ( 1 kpc) southwest of the nucleus in the northeastern galaxy and 15 northeast in the southwestern galaxy.
Appendix T NGC 6621/22 (Arp 81)
NGC 6621/22 (Figure 1t) is a pair of spiral galaxies and is included in the ”Toomre Sequence” (Toomre 1977) as an intermediate-stage merger. The northwestern galaxy (NGC 6621) contributes nearly all of the radio and FIR flux (Condon et al., 1996; Bushouse et al., 1998). The H flux is also dominated by NGC 6621. Excess H emission is seen from the overlapping regions of the two galaxies (see also Xu et al., 2000). The nuclear region of NGC 6621 shows two bright H sources separated by 3″ ( 1.3 kpc). The southwestern source is the brightest in the entire system, and the northeastern one coincides with the nucleus of NGC 6621. We detected no evidence for H emission from the nucleus of NGC 6622, consistent with the nuclear spectrum of Liu & Kennicutt (1995). Faint H emission in the tidal tail is seen 40″ east and 5″ south of the NGC 6621 nucleus.
The analyses presented in § 3.2 are made only for the eastern galaxy.
Appendix U NGC 7771
NGC 7771 (Figure 1u) is a highly inclined, barred spiral galaxy in a group with NGC 7769, NGC 7770 and NGC 7771A (Nordgren et al., 1997), and the latter two are also included in our field-of-view at distances of 1′ ( 18 kpc) and 28 ( 48 kpc), respectively. While the CO flux reported in SSS refers only to NGC 7771, part of the FIR emission measured by may originate from NGC 7770 (Condon et al., 1990). The nuclear region of NGC 7771 shows a complicated structure both in the H and continuum images, which may be due to the starburst ring, which is thought to have a complicated star-formation history and extinction (Smith et al., 1999; Reunanen et al., 2000). The H peak is offset by 24 ( 0.7 kpc) to the west of the continuum peak. This is reminiscent of the relation between the Br and K-band images (Reunanen et al., 2000). H emission is also detected along the bar and spiral arms.
NGC 7770 (Figure 2c) is a strong H source, showing double peaks in both H and continuum emission, and has a comparable flux to NGC 7771. The western peak in H is coincident with the continuum peak, while the eastern one is offset by 2″ to the north of the eastern continuum peak. In addition, there is a tail-like structure extending to the west from the northern part of the main body. This structure cannot be seen in our continuum image, nor in the -band image shown in Smith et al. (1999). We also detected faint H emission from NGC 7771A (not shown).
Appendix V Mrk 331
Mrk 331 (Figure 1v) has two faint companions at 2′ ( 42 kpc) to the west (UGC 12812) and 14 ( 30 kpc) to the southwest. The H and continuum images show a strong peak at the nucleus. While little structure can be seen in the circumnuclear region in either H or continuum emission, the equivalent-width map of Mrk 331 reveals a ring-shaped structure surrounding the nucleus with a diameter of 5″ ( 1.8 kpc). As Mrk 331 is known from high-spatial-resolution radio and MIR maps (C91; Soifer et al., 2001) to have a circumnuclear star-forming ring with dimensions of 3″ 2″ , this star-forming ring, when affected by the 2″ seeing, may appear as the larger ring in the equivalent-width map.
We also detected H emission from both companion galaxies. Both show extended and complex distributions with large equivalent width (Figure 2d).