Month-Timescale Optical Variability in the M87 Jet
Abstract
A previously inconspicuous knot in the M87 jet has undergone a dramatic outburst and now exceeds the nucleus in optical and X-ray luminosity. Monitoring of M87 with the Hubble Space Telescope and Chandra X-ray Observatory during 2002-2003, has found month-timescale optical variability in both the nucleus and HST-1, a knot in the jet from the nucleus. We discuss the behavior of the variability timescales as well as spectral energy distribution of both components. In the nucleus, we see nearly energy-independent variability behavior. Knot HST-1, however, displays weak energy dependence in both X-ray and optical bands, but with nearly comparable rise/decay timescales at 220 nm and 0.5 keV. The flaring region of HST-1 appears stationary over eight months of monitoring. We consider various emission models to explain the variability of both components. The flares we see are similar to those seen in blazars, albeit on longer timescales, and so could, if viewed at smaller angles, explain the extreme variability properties of those objects.
Subject headings:
galaxies: individual (M87) — galaxies: active — galaxies: jets —BL Lacertae objects: general — magnetic fields — radiation mechanisms: nonthermal1. Introduction
M87 is among the nearest galaxies with a bright radio/optical/X-ray jet. Its proximity (distance 16 Mpc, Tonry 1991, giving a scale of 78 pc/arcsec) allows features to be studied with unparalleled spatial resolution.
The dynamic nature of the M87 jet was first recognized in the X-rays by Harris et al. (1997, 1998), who found variability on year timescales. In the optical, Biretta et al. (1999) found superluminal motion throughout the inner of the jet, with speeds up to , as well as gradual changes in flux. These observations did not explore timescales months, however. More recently, the jet’s optical spectrum was found to harden in knots, consistent with local particle acceleration (Perlman et al. 2001a). And Chandra observations found spectral indices , broadly consistent with an extrapolation of the radio-optical synchrotron emission (Marshall et al. 2002, Wilson & Yang 2002). X-ray synchrotron emission implies radiative lifetimes 1-10 years, and thus requires in situ acceleration.
All this evidence suggested the possibility of shorter-timescale variability in the M87 jet. Indeed, recently Harris et al. (2003, hereafter paper I) detected X-ray flaring on timescales month during 2002 in both the nucleus and HST-1, a knot in the jet. Here we discuss observations of the M87 jet with both HST and the Chandra X-ray Observatory, which find flares in both the nucleus and knot HST-1 on timescales of months. A second paper (Biretta et al. 2003, hereafter paper III) discusses the longer timescale variability of the M87 jet.
2. Observations and Data Reduction
We make use of Chandra and HST observations of M87 during November 2002 - June 2003. During this interval we observed M87 roughly every 20-40 days. Table 1 lists the HST observations; the Chandra data will be discussed in an upcoming paper (Harris et al., in prep.).
Our Chandra data reduction procedures were detailed in Paper I. All HST observations were reduced in IRAF and PyRAF with the best available flat fields, biases, darks and illumination correction images. Dithered images were combined using PYDRIZZLE, which combines drizzling (Fruchter & Hook 2002) with cosmic ray and hot pixel removal, geometric correction and mosaicing. Galaxy subtraction was done on the F475W and F814W data using ELLIPSE, BMODEL and IMCALC. Identical galaxy models were used at all epochs. Flux-calibrated images were obtained using SYNPHOT. We applied a standard Galactic extinction law and assumed to correct the fluxes for reddening. Polarized light images were combined into Stokes’ parameters in AIPS, using standard formulae.
Considerable effort was expended to estimate uncertainties. We accounted for several error sources, including zero-point and slope errors in the SYNPHOT calibration, flat-fielding errors, and Poisson errors in the data and in modelling and subtraction of the galaxy. Errors were propagated by adding in quadrature. The cumulative error in the HST photometry is typically 3-4%, and is dominated by the flat-fielding and zero-point errors.
Lightcurves were extracted from our data at three UV/optical wavelengths - 220 nm, 475 nm and 814 nm, and three X-ray bands (paper I) - 0.2-0.75 keV (“soft”; nominal 0.5 keV), 0.75-2 keV (“medium”; nominal 1.4 keV), and 2-6 keV (“hard”; nominal 4 keV). The 2003 March 31 and 2003 May 10 (part of a snapshot program led by D. Maoz) images were taken at a slightly longer wavelength; to place them on a common 220 nm flux scale we assumed (Perlman et al. 2001a). Finally, we have also made use of flux points from 2001-2002 HST data which are discussed in more detail in Paper III.
3. Results
Figure 1 shows the 2003 April 17 F220W image of the inner of the M87 jet, as well as optical and X-ray lightcurves for the nucleus and HST-1 respectively. As can be seen, both components vary on timescales of a few months in the optical, with typical month-to-month variations being about 10-15% at 220 nm. Other regions do not vary significantly from month to month and so are not shown in Figure 1. For the nucleus, flux was extracted from and square boxes, which showed identical variability. In Figure 1 we use the box. For knot HST-1, we extracted flux from a box. The extraction regions for our Chandra data were described in paper I. Our data confirm Tsvetanov et al.’s (1998) claim of month-timescale nuclear optical variability. However, this is the first such report for any jet component.
| Date | Instrument & Bands | Program |
|---|---|---|
| 2002-11-30 | ACS F220W, F475W, F814W | 9705 |
| 2002-12-07 | ACS F606W + POLVIS | 9705 |
| 2002-12-22 | ACS F220W, F475W, F814W | 9705 |
| 2003-02-02 | ACS F220W, F475W, F814W | 9705 |
| 2003-03-06 | ACS F220W, F475W, F814W | 9705 |
| 2003-03-31 | ACS F250W, F330W | 9454 |
| 2003-04-17 | ACS F220W, F475W, F814W | 9705 |
| 2003-05-10 | ACS F250W, F330W | 9454 |
| 2003-06-07 | STIS F25QTZ | 9474 |
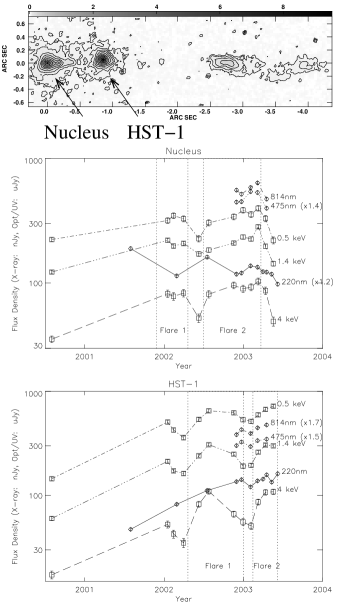
At 220 nm, of the flux in both varying regions is contained within a distribution consistent with the PRF. Thus both are unresolved, and so (1.5 pc) in size. This implies light-travel times within a factor 3-20 (depending on the Doppler factor ) of the variability timescales (§4, Paper I). The nucleus’s variable region is from the galactic center, with HST-1’s varying region being (64 pc) distant, locations identical to of those measured with Chandra (Paper I). We detect no motion in HST-1’s flaring region; therefore, the flare likely occurred in the nearly stationary component at its upstream end (Biretta et al. 1999), rather than one that propagates at the velocities seen in moving components within HST-1, namely (/year, easily detectable in these data).
Figure 2 shows the F606W polarized light image. As can be seen, the nucleus is essentially unpolarized. HST-1 shows fractional polarization at its flux peak, a maximum (nearly the theoretical maximum for synchrotron radiation from an ordered magnetic field) at its upstream end from the nucleus, and a minimum from the nucleus. The magnetic field vectors in HST-1 are perpendicular to the jet direction, consistent with a shock. The alternative interpretation of a tightly wound helix would require cycles separated by to be consistent with the observed morphology. A much higher bulk would also be needed (because of the longer path) to be consistent with (Biretta et al. 1999). The polarization at HST-1’s flux peak is much higher than in 1995 (, Perlman et al. 1999). This is in line with the properties of BL Lac objects, which often have higher optical polarizations in high states (e.g., Hagen-Thorn et al. 1998).

4. Constraints from the Lightcurves
To constrain the physics, we compute doubling and halving timescales , given in Table 2 for timeperiods referenced in Figure 1. We can compare these with predictions from models with losses, which are of the form . If the emission is synchrotron radiation and synchrotron cooling dominates, , (Kirk, Mastichiadis & Rieger 1998; Paper I). As shown in Böttcher et al. (2003), if synchrotron self-Compton (SSC) losses dominate, the dominant factor in is the synchrotron radiation energy density , so that = –1 to –0.75 for electron spectral index to 2 [, which is related to via ].
| Doubling or Halving Timescale in Band (days) | |||||||||
|---|---|---|---|---|---|---|---|---|---|
| Component | Band | Dates | Type (Flare #) | 814 nm | 475 nm | 220 nm | 0.5 keV | 1.4 keV | 4 keV |
| Nucleus | X-rays | June-July 2002 | Rise (2) | … | … | … | |||
| Nucleus | X-rays | March-May 2002 | Fall (1) | … | … | … | |||
| Nucleus | Optical | Dec. 2002-Feb. 2003 | Rise (2) | … | … | … | |||
| Nucleus | Optical | Mar.-Apr. 2003 | Fall (2) | … | … | … | |||
| HST-1 | X-rays | Feb.-Apr. 2003 | Rise (2) | … | … | … | |||
| HST-1 | X-rays | Nov.-Dec. 2002 | Fall (1) | … | … | … | |||
| HST-1 | Optical | Feb.-Apr. 2003 | Rise (2) | … | … | … | |||
| HST-1 | Optical | Dec. 2002 - Feb. 2003 | Fall (1) | … | … | … | |||
Table 2 shows several differences between the variability behavior of the nucleus and HST-1. The nucleus does not show strong energy-dependence in either the X-rays ( and ) or optical ( and , but the departure from zero in the latter measurement is due entirely to the lower significance of the fall in F220W during 2003 Feb.-Apr.; further, note that the drop accelerated after monitoring in F475W and F814W ceased). By comparison, HST-1 does show energy-dependent behavior in the X-rays, with and . But in the optical, our data are less constraining, giving and .
HST-1’s behavior in the X-rays agrees with the predictions of a simple synchrotron model. But such a model cannot easily account for the comparable optical and X-ray variability timescales. Two other models can explain such behavior. The first is that the flare was caused by adiabatic compression, followed by expansion on a dynamical timescale of days. This would allow radiative losses dominate at high energies, where , while expansion losses would dominate at low energies. The X-ray variability behavior then requires mG. However, this model has difficulty explaining X-ray and optical increases and decreases that do not exactly coincide in time (Figure 1). Alternately, the X-ray flare could be triggered by shock compression (as suggested by the polarimetry, §3), with the optical emission representing the shocked plasma’s downstream propagation. This model requires a stronger magnetic field downstream of the shock to explain the similar 0.5 keV and 220 nm variability timescales.
The nearly energy-independent variability behavior of the nucleus disagrees with simple synchrotron models, although some cannot be excluded formally because of the large error bars. One could account for the energy independence either by adiabatic compression and expansion, or a helical trajectory, where flux would change with viewing angle (suggested by Urry et al. 1993 to explain the nearly energy-independent variability of PKS 2155304 in 1991). But perhaps the most attractive model is that the varying region has light-days, so that the light-crossing time controls the variability behavior (e.g., Chiaberge & Ghisellini 1999). In this case we would require mG.
5. Comparison to Blazar Flares
The flares of the nucleus and HST-1 (Figure 2) resemble those of blazars, albeit on longer timescales. Can we explain blazar flares ( days; Ulrich, Maraschi & Urry 1997; Pian 2002), as highly beamed versions of these events? Timescales Lorentz-transform as , so days requires (also consistent with the luminosities seen in blazar flares, e.g., Giebels et al. 2002), while day requires . For reasonable , this requires , at the lower end of the range considered for HST-1 in Paper I, and implies . Consistency with HST-1’s (Biretta et al. 1999), then requires and , much tighter constraints than in previous works. A timescale days then requires and if ), while day requires and , plus smaller . Unified schemes usually constrain and less tightly (e.g., and , Urry & Padovani 1995). However, one can imagine a range of or stronger magnetic fields (e.g., Li & Kusunose 2000, Kataoka et al. 2000, Böttcher et al. 2003).
Blazars can show either energy-dependent or energy-independent behavior, even within the same campaign. Often, energy-dependent behavior includes one band leading the other. With our data, any discussion of delays is premature, although there are possible indications in the data. Monitoring of M87 continues, and we will discuss this subject in a later paper.

6. Spectral Variability
Do we also see spectral variability in these components? Figure 3 shows broadband spectra in three epochs, representing both high and low states.
The nucleus has and , in agreement with the fit value of Hz found using historical data (Perlman et al. 2001b). But in all epochs, , where and are, respectively, the spectral indices in the optical, optical-X-ray and X-ray bands. Thus for standard synchrotron models, the X-ray emission must come from a component distinct from that responsible for the optical emission, since a single electron population cannot produce spectral hardenings blueward of . The nucleus displays only modest spectral variability, with the 2002 December points (a low optical state) having flatter but steeper . This is consistent with a significant SSC contribution.
By contrast, HST-1 has in all epochs, with for epochs (2003 April, 2002 December, 2003 February), similar to that seen in 1998, when it was fainter in optical (Perlman et al. 2001a). These values of are consistent with shock injection. The optical to X-ray spectrum steepens in low states and flattens in high states, as expected for synchrotron flaring. Interestingly, the 2003 April high state has a clearly harder spectrum than that seen in 2002 December.
7. Final Thoughts
Here and in paper I we have found strong optical and X-ray variability in the nucleus of M87, and knot HST-1 in its jet. Is it possible to link the variability of the nucleus and HST-1 in any way? Perhaps the flaring in HST-1 was triggered by a density enhancement travelling down the beam of the jet. If we assume a near-constant apparent speed of for this material, its ejection would have occurred years ago. Such an episode could plausibly have caused a radio flare in the nucleus. Interestingly, DeYoung (1971) detected % variations in the nuclear radio flux in 1969-1971. It is possible (but speculative) to link the flaring in the nucleus in to the current behavior of HST-1.
References
- (1) Biretta, J. A., Sparks, W., & Macchetto, F., 1999, ApJ, 520, 621
- (2) Biretta, J. A., Harris, D. E., Perlman, E. S., Sparks, W. B., & Macchetto, F., 2003, ApJL, submitted (Paper III)
- (3) Böttcher, M., et al., 2003, ApJ, in press, astro-ph/0307022
- (4) Chiaberge, M., & Ghisellini, G., 1999, MNRAS, 306, 551
- (5) DeYoung, D. S., 1971, Nature, 231, 253
- (6) Fruchter, A. S., & Hook, R. N., 2002, PASP, 114, 144
- (7) Giebels, B., et al., 2002, ApJ, 571, 763
- (8) Hagen-Thorn, V. A., et al., 1998, A & A Supp., 133, 353
- (9) Harris, D. E., Biretta, J. A., & Junor, W., 1997, MNRAS 284, L21
- (10) Harris, D. E., Biretta, J., & Junor, W., 1998, in The Radio Galaxy M87, ed. H.-J. Roeser & K. Meisenheimer (Springer), p. 319
- (11) Harris, D. E,. Biretta, J. A., Junor, W., Perlman, E. S., Sparks, W. B., & Wilson, A. S., 2003, ApJ, 586, L41 (Paper I)
- (12) Kataoka, J., et al., 2000, ApJ, 528, 243
- (13) Kirk, J. G., Rieger, F., & Mastichiadis, A., 1998, A & A, 333, 452
- (14) Li, H., & Kusunose, M., 2000, ApJ, 536, 729
- (15) Marshall, H. L., Miller, B. P., Davis, D. S., Perlman, E. S., Wise, M., Canizares, C. R., & Harris, D. E., 2002, ApJ, 584, 683
- (16) Owen, F. N., Hardee, P. E., & Cornwell, T. J., 1989, ApJ, 340, 698.
- (17) Perlman, E. S., Biretta, J. A., Zhou, F., Sparks, W. B., & Macchetto, F. D., 1999, AJ, 117, 2185
- (18) Perlman, E. S., Biretta, J. A., Sparks, W. B., Macchetto, F. D., Leahy, J. P., 2001a, ApJ, 551, 206
- (19) Perlman, E. S., Sparks, W. B., Radomski, J., Packham, C., Fisher, R. S., Piña, R., Biretta, J. A., 2001b, ApJ, 561, L51
- (20) Pian, E., 2002, PASA, 19, 49
- (21) Sparks, W. B., Biretta, J., & Macchetto, F., 1996, ApJ, 473, 254
- (22) Tonry, J. L., 1991, ApJ 373, L1
- (23) Tsvetanov, Z. I., et al., 1998, ApJ, 498, L83
- (24) Ulrich, M.–H., Maraschi, L., Urry, C. M., 1997, ARAA, 35, 445
- (25) Urry, C. M., et al., 1993, ApJ, 411, 614
- (26) Urry, C. M., & Padovani, P., 1995, PASP, 107, 830
- (27) Wilson, A. S., & Yang, Y., 2002, ApJ, 568, 133
- (28)