The Distribution of Maximum Relative Gravitational Torques in Disk Galaxies
Abstract
The maximum value of the ratio of the tangential force to the mean background radial force is a useful quantitative measure of the strength of nonaxisymmetric perturbations in disk galaxies. Here we consider the distribution of this ratio, called , for a statistically well-defined sample of 180 spiral galaxies from the Ohio State University Bright Galaxy Survey and the Two Micron All-Sky Survey. can be interpreted as the maximum gravitational torque per unit mass per unit square of the circular speed, and is derived from gravitational potentials inferred from near-infrared images under the assumptions of a constant mass-to-light ratio and an exponential vertical density law. In order to derive the most reliable maximum relative torques, orientation parameters based on blue-light isophotes are used to deproject the galaxies, and the more spherical shapes of bulges are taken into account using two-dimensional decompositions which allow for analytical fits to bulges, disks, and bars. Also, vertical scaleheights are derived by scaling the radial scalelengths from the two-dimensional decompositions allowing for the type dependence of indicated by optical and near-infrared studies of edge-on spiral galaxies. The impact of dark matter is assessed using a “universal rotation curve” parametrization, and is found to be relatively insignificant for our sample. In agreement with a previous study by Block et al. (2002), the distribution of maximum relative gravitational torques is asymmetric towards large values and shows a deficiency of low galaxies. However, due to the above refinements, our distribution shows more low galaxies than Block et al. We also find a significant type-dependence in maximum relative gravitational torques, in the sense that is lower on average in early-type spirals compared to late-type spirals. The effect persists even when the sample is separated into bar-dominated and spiral-dominated subsamples, and also when near-infrared types are used as opposed to optical types.
1 Introduction
Nonaxisymmetric features are a pervasive and complex aspect of disk galaxies. In normal, relatively non-interacting galaxies, these features are in the forms of bars or spirals. It is well-known that the presence of nonaxisymmetric structures in galaxy disks can impact the evolution of morphology. For example, bars may drive spiral density waves (Kormendy and Norman 1979), generate resonance rings of gas (Schwarz 1981; Buta & Combes 1996), impact abundance gradients (Martin & Roy 1994), or induce gas inflow that may lead to bar destruction and bulge growth (Norman, Sellwood, & Hasan 1996). A spiral may trigger shocks, inducing star formation (Roberts, Roberts, & Shu 1975), or may rearrange stochastically-induced star-forming regions into a more organized pattern (McCall 1986). It is clear that nonaxisymmetric features, with their associated pattern speeds and resonances, are extremely important to galactic evolution, and understanding how these features develop is one of the principal problems in galaxy formation and dynamics.
The source of much of the evolution caused by bars and spirals is gravity torques due to tangential forces. Combes & Sanders (1981; see also Sanders & Tubbs 1980) suggested that these forces could provide a useful measure of the strengths of nonaxisymmetric features such as bars, if the potential could be determined. The idea is to derive the maximum value of the ratio of the tangential force to the mean background (or axisymmetric) radial force, which would give a single dimensionless number indicating the relative importance of nonaxisymmetry in the potential of a galaxy. This ratio, which is physically the same as the maximum gravitational torque per unit mass per unit square of the circular speed, will be referred to in this paper as , while the method for deriving will be referred to as the gravitational torque method (or GTM).
The advent of routine near-infrared imaging of galaxies has made application of the GTM more practical than ever. Near-infrared images trace the stellar mass distribution of galaxies, due to their emphasis on the older, dominant stellar populations. Potentials can be derived from such images using fast Fourier transform techniques in conjunction with assumptions concerning the mass-to-light ratio and the vertical density distribution (e.g., Quillen, Frogel, and González 1994, hereafter QFG). From this potential, the radial and tangential components of the forces in the plane of the galaxy can be derived, and the Combes & Sanders ratio can be estimated. Recent studies by Buta & Block (2001), Block et al. (2001), Laurikainen, Salo, & Rautiainen (2002), Laurikainen & Salo (2002), and Block et al. (2002) have provided the first attempts to derive the maximum force ratios for significant samples of galaxies. However, in these cases, the samples were either ill-defined statistically, based entirely on relatively short exposure Two Micron All-Sky Survey (2MASS, Skrutskie et al. 1997) near-infrared images, or used deprojected images that did not allow for the typically rounder shapes of bulges or the most reliable estimates of vertical scaleheights.
There are good reasons for trying to derive the maximum force ratio for a large, statistically well-defined sample of galaxies using a refined version of the GTM. Firstly, Sellwood (2000) has argued that we could evaluate scenarios of bar formation in disk galaxies if we knew the observed distribution of bar strengths. Various bar formation scenarios, such as the natural “bar instability” (Miller, Prendergast, & Quirk 1970; Hohl 1971; Sellwood & Wilkinson 1993 and other references therein) or tidal bar formation (e.g., Noguchi 1996; Miwa & Noguchi 1998), may predict different distributions of maximum relative bar torques, and an observed distribution may distinguish which mechanism is most important. Secondly, recurrent bar formation due to accretion of external gas would impact the distribution of maximum force ratios (Bournaud & Combes 2002). The idea is that bars can be the engines of their own destruction in the presence of gas (see, for example, Das et al. 2003), but may reform or regenerate later if a galaxy accretes significant quantities of external gas during a Hubble time that may cool the disk sufficiently (see also Sellwood & Moore 1999). Thus, accretion can impact the “duty cycle” of bars. This idea was evaluated by Block et al. (2002) using an application of the GTM to the Ohio State University Bright Galaxy Survey (OSUBGS, Eskridge et al. 2002). Block et al. concluded that the distribution of maximum relative torques favored the idea that galaxies accrete enough gas to double their mass in 1010 years.
In this paper, we re-examine the distribution of maximum relative torques in spiral galaxies based on application of a much refined version of the GTM to basically the same OSUBGS sample as used by Block et al., supplemented by a few larger galaxies with images from the 2MASS database. Our goal is to derive a reliable distribution of maximum relative bar and spiral torques in disk galaxies that can be compared with model predictions. The refinements we use account for the shapes of bulges, improved estimates of the galaxy orientation parameters, vertical scaleheights inferred from type-dependent scalings of the radial scalelength, and a statistical evaluation of the impact of dark matter. The values we use are from Laurikainen et al. (2003). Only a few of the technical details connected with these values will be provided here, and we refer the reader to Laurikainen et al. (2003) for a full accounting of our application of the GTM. Our approach allows us to derive the most reliable maximum relative torques, and therefore the most accurate distribution of these torques.
2 Properties of the Sample
Our sample consists of 158 galaxies from the OSUBGS having inclinations less than 65∘ and 22 2MASS galaxies having a similar inclination limit but which were too large to be in the OSUBGS. The selection criteria for the OSUBGS are that the RC3 T index is in the range 09 (S0/a to Sm), the total magnitude 12.0, the isophotal diameter 6.′5, and the declination is in the range (Eskridge et al. 2002). Table 1 summarizes several of the mean properties of the sample, based on data from RC3 (de Vaucouleurs et al. 1991). Of the 180 galaxies, 177 have family classifications given in RC3. Table 1 shows that in the sample, there are virtually equal numbers of galaxies classified as SA, SAB, or SB. Table 1 divides the averages according to this classification parameter. The table shows that mean parameters in the sample are similar within these families. The mean Hubble type is Sb-Sbc. Average colors, apparent angular size, radial velocities, and distances are similar among the families. There is an indication that, on average, the SA galaxies in the sample are slightly more inclined than the SAB and SB galaxies. Also, SA galaxies are slightly more luminous and larger than SAB and SB galaxies. An inclination effect on the morphological recognition of bars is not unexpected and merely highlights the difficulty of seeing bars which are weak and viewed at high inclination. However, with bulge/disk decomposition and deprojection, as well as near-IR imaging, we can detect some of these lost bars.
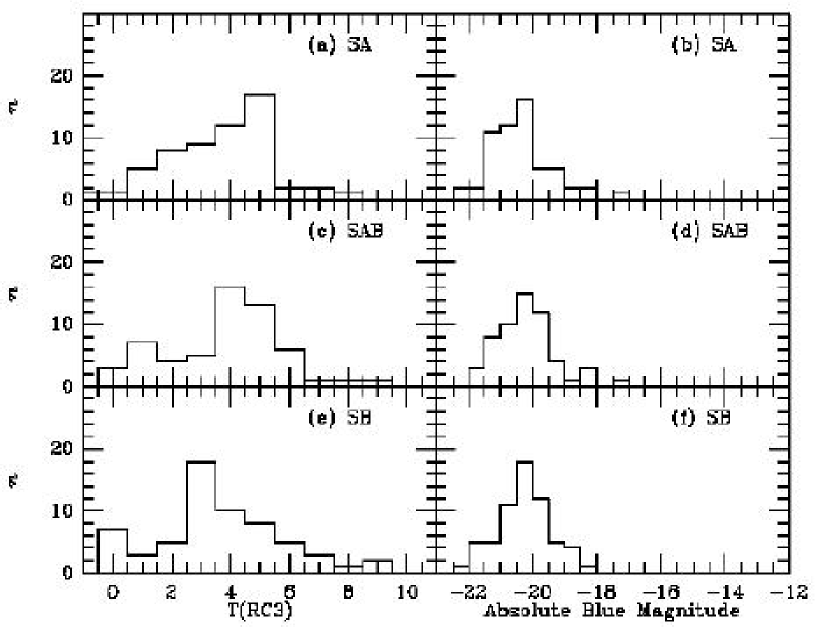
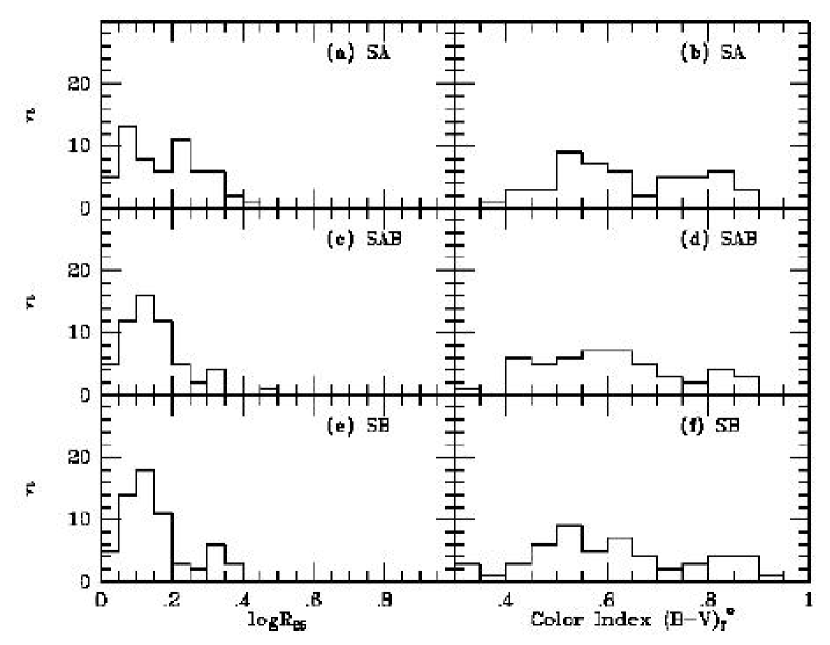
Figures 1 and 2 show the more detailed distributions of SA, SAB, and SB galaxies in the sample versus RC3 type, absolute blue magnitude , the logarithm of the isophotal axis ratio , and corrected color index . Absolute magnitudes use from RC3 and distances either from or on the scale of Tully (1988). Although the mean index is nearly the same for the separate families, SB galaxies are asymmetrically distributed towards early types while SA galaxies are asymmetrically distributed towards later types. The distributions by absolute magnitude show the higher luminosities of the SA galaxies compared to SAB and SB galaxies. The distribution with definitely emphasizes lower inclinations for SB galaxies, while it is more uniform for SA galaxies to the cutoff. Integrated colors are similarly distributed over the three families.
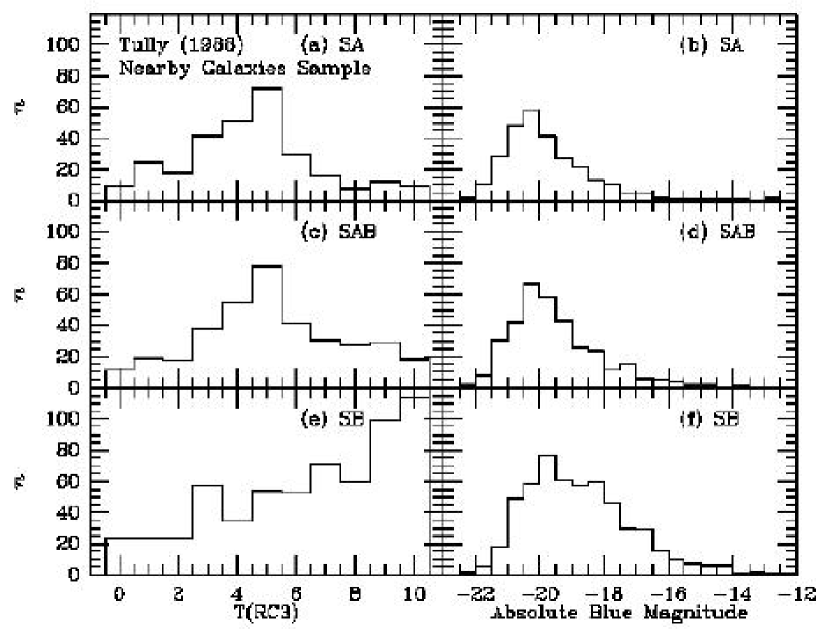
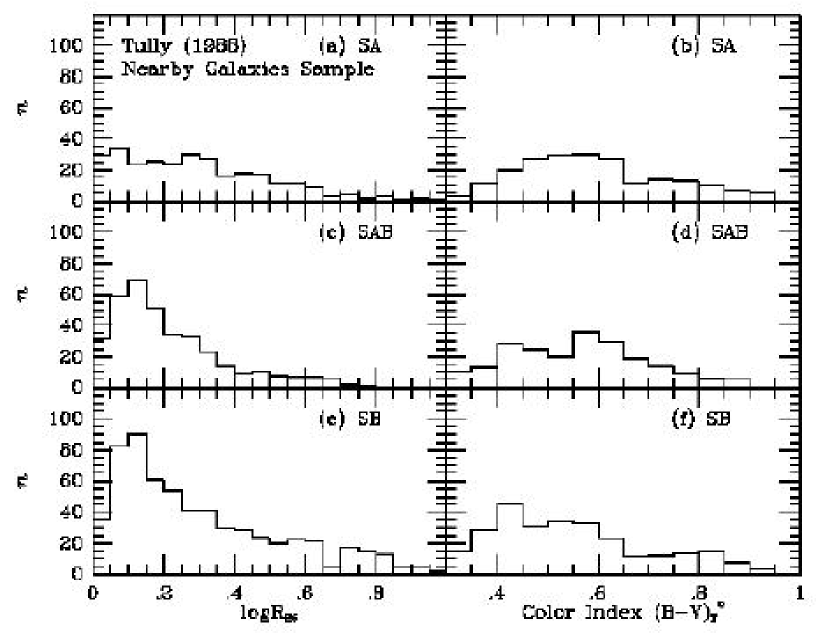
For comparison, Figures 3 and 4 show the same histograms for a distance-limited sample of 1264 spirals111This number includes only those Tully sample galaxies having RC3 data available. from the catalog of Tully (1988). Table 1 lists the mean parameters for the same sample. Our magnitude- and diameter-limited OSU/2MASS sample emphasizes earlier Hubble types and brighter absolute magnitudes than the Tully catalog, the differences being most extreme for SB galaxies. The distributions of color and axis ratio, except for our inclination cutoff, are similar to those for our sample galaxies. Thus, our sample is mainly biased against late-type, low-luminosity barred spirals. There is less bias in the SA and SAB subsamples because these tend to have fewer late-type, low luminosity examples. A critical issue is that it appears that our sample is not necessarily biased much against nonbarred spirals.
3 Refinements to the GTM
The basic assumptions in the GTM are: (1) the near-infrared light distribution traces the mass, i.e., the mass-to-light ratio is constant; (2) the vertical density distribution can be simply represented as, for example, exponential with vertical scaleheight ; and (3) galaxies can be deprojected as thin disks, after allowing for the shape of the bulge. As noted by Buta & Block (2001), the first assumption is probably valid for many galaxies in the bar region, where maximum disks tend to be found (e.g., Freeman 1992). However, this is still an open question as noted by Kranz, Slyz, & Rix (2003), who used the amplitudes of modeled noncircular motions in five spirals to deduce that maximum disks may be valid only if the maximum rotation velocity exceeds 200 km s-1. In our sample, this would be the case only for galaxies having 20.8 (Tully et al. 1998). We address this issue further in section 8 using the “universal rotation curve” approach of Persic, Salucci, & Stel (1996). Laurikainen & Salo (2002) showed that the GTM is fairly insensitive to the form of the assumed vertical density distribution.
3.1 Polar versus Cartesian Grid
The first refinement we use over Buta & Block (2001) is a polar coordinate grid as opposed to a Cartesian grid (Laurikainen & Salo 2002). Buta & Block used the QFG method of transforming near-IR images into gravitational potentials, which operates on a two-dimensional image. This approach provides an image of the potential, which can be used to derive a two-dimensional map of the ratio of the tangential to the mean radial force. In such a map, if a strong bar is present, four well-defined maxima or minima are seen in the form of a “butterfly pattern.” Buta & Block defined the bar strength to be the average of the absolute values of the four maxima/minima.
Laurikainen, Salo, & Rautiainen (2002) and Laurikainen & Salo (2002) used a polar grid approach as an alternative to QFG to allow the application of the GTM to noisy and rather low resolution 2MASS images. Fourier components of the light distribution are computed as a function of radius and azimuthal angle , and these Fourier light components are individually transformed into potential components. The potential is then reconstructed analytically, and the maximum force ratio, , as a function of radius is computed.
3.2 Orientation Parameters
In previous GTM studies such as those of Buta & Block (2001) and Block et al. (2001, 2002), orientation parameters from RC3 were used to deproject most of the galaxy images. However, these orientation parameters are in many cases based on photographic images and can be manifestly improved with modern digital images. We have used the -band images from the OSUBGS to fit ellipses to outer isophotes and derive mean axis ratios and position angles for the outer disks. In the future, these can also be improved upon using two-dimensional velocity fields. The results of the ellipse fits, as well as uncertainties, will be provided by Laurikainen et al. (2003).
3.3 Bulge Shapes
Although the bulges of some barred galaxies might be as flat as the disk (Kormendy 1993), in many galaxies the bulge is a rounder component than the disk. If this rounder shape is ignored when deprojecting a galaxy, the bulge isophotes will be stretched into a bar-like distortion (called “deprojection stretch” by Buta & Block 2001), leading to false torques. To deal with this problem we have used two-dimensional photometric decomposition, based on Sérsic models (Sérsic 1968) and allowing for seeing effects. The bulge and disk are described as in Mollenhöff & Heidt (2001), and in addition a bar component is added to the fit (Ferrer’s bar with index n=2), which in some cases is essential for avoiding artificially large bulge models. The technique we used, as well as the derived parameters, will be outlined in more detail by Salo, Laurikainen, & Buta (2003). The decompositions allowed us to remove the bulges, deproject the disks, and then add back the bulges as spherical components. Thus, our analysis is not affected seriously by bulge “deprojection stretch.”
3.4 Vertical Scaleheight
The computation of a potential from a near-infrared image requires a value for the vertical scaleheight, which can be directly measured only for edge-on galaxies. Buta & Block (2001) and Block et al. (2001) simply assumed that all galaxies had the same vertical exponential scaleheight as our Galaxy, = 325pc (Gilmore & Reid 1983). However, this approach required knowledge of the distance to each galaxy, which had to be based on radial velocities. Here we follow Laurikainen, Salo, & Rautiainen (2002) and derive (=0.5, where equals the isothermal scaleheight) by scaling values from the radial exponential scalelength, . As shown by de Grijs (1998), the ratio / depends on Hubble type, being larger for later types compared to earlier types. Values of were provided by our decompositions, and we used the following scalings by type: = 4 for S0/a-Sa galaxies, 5 for Sab-Sbc galaxies, and 9 for Sc galaxies and later.
4 The Maximum Relative Gravitational Torque
We define the maximum relative gravitational torque, , to be the maximum value of the ratio of the tangential force to the mean radial force derived from a plot of versus , based on a quadrant analysis. In some cases, is mostly measuring the maximum torque due to a bar, while in other cases is clearly measuring only spiral torques. In many cases, will be measuring a combination of bar and spiral torques, as shown by Buta, Block, & Knapen (2003), who developed a Fourier-based bar/spiral separation technique. Thus, our analysis cannot provide a true distribution of maximum relative bar torques . For the evaluation of accretion models of spirals, Block et al. (2002) noted that this is not a problem because the models often also have spiral torques that contribute to estimates.
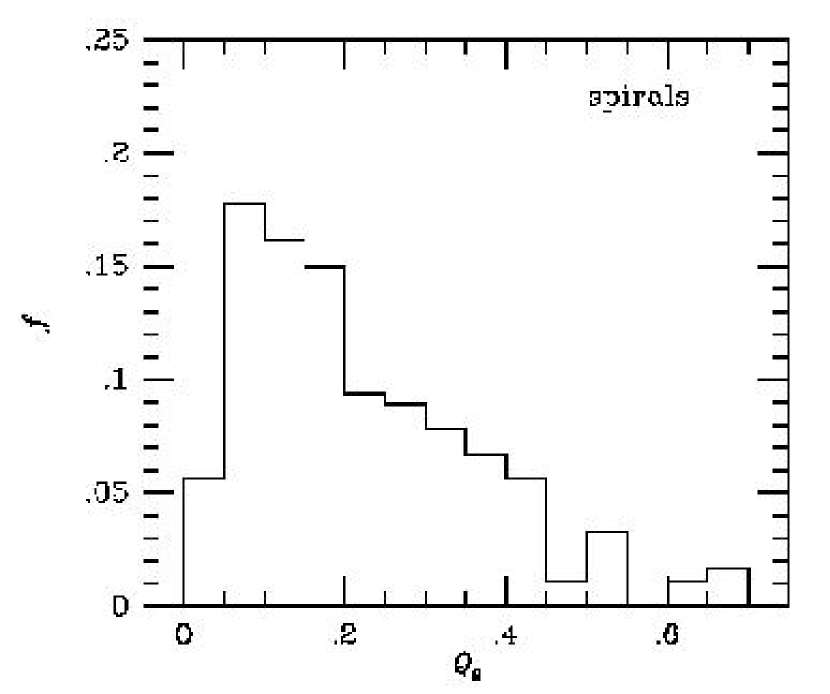
5 The Distribution of Values
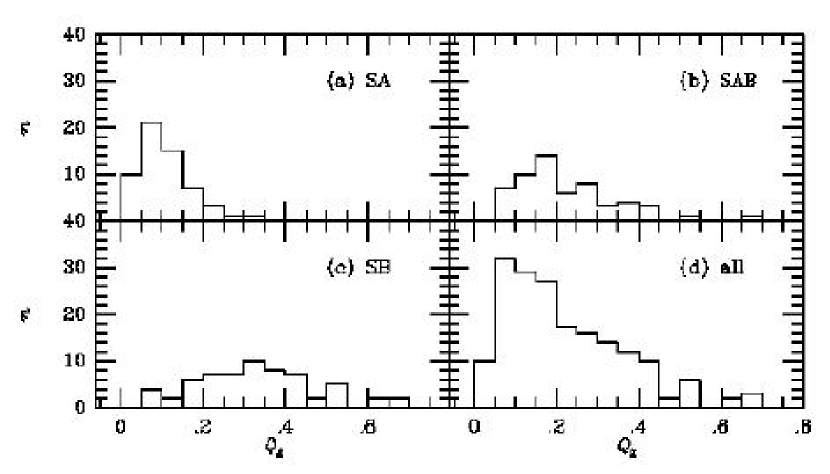
Our main result is shown in Figure 5, and is compiled as counts and relative frequencies (=/180) in Table 2. The distribution of maximum relative gravitational torques is shown for the full sample of 180 galaxies in comparison to the subsamples of SA, SAB, and SB galaxies in Figure 6. The latter plots show again that there is indeed a correlation between maximum torque and de Vaucouleurs family classification, but the spread in is very wide for SAB and SB galaxies. SA galaxies appear to genuinely select the narrowest range of , while SAB and SB galaxies include objects having between 0.05 and 0.7. Thus, except for SA galaxies, the de Vaucouleurs family classifications do not tell us much about real gravitational bar torques except in an average sense. In Table 1, the mean values of by family are listed. The mean increases linearly from SA to SB, with maximum relative gravitational torques being 11% for a typical SA galaxy, 22% for a typical SAB galaxy, and 33% for a typical SB galaxy.
Figure 5 shows an asymmetric distribution of maximum relative gravitational torques, with a “tail” extending to 0.7. From the histograms in Figure 6, it is clear that the primary peak in this plot is due mainly to SA and SAB galaxies, while the extended tail is due to SAB and SB galaxies. The average value of for the full sample is 0.222 with a standard deviation of 0.147.
6 Distribution Uncertainties and a Comparison with Block et al. (2002)
As we have noted, a similar study of the distribution of maximum relative gravitational torques in the OSUBGS sample was made by Block et al. (2002). They selected 163 galaxies from the original sample of 198 having inclinations of 70∘ or less and not members of obviously interacting systems. Vertical exponential scaleheights were derived from roughly estimated radial scalelengths (see below) as . Most importantly, no bulge/disk decompositions were made to allow for the likely rounder shapes of bulges, and approximate orientation parameters from RC3 were used for the deprojections. Like us, however, Block et al. derive from graphs of versus .222Block et al. (2002) use the term for their parameter, but it is not derived in the same manner as the defined by Buta & Block (2001). Instead, it is the same as our definition of . Thus, a comparison between our histogram of maximum relative torques and theirs is appropriate.
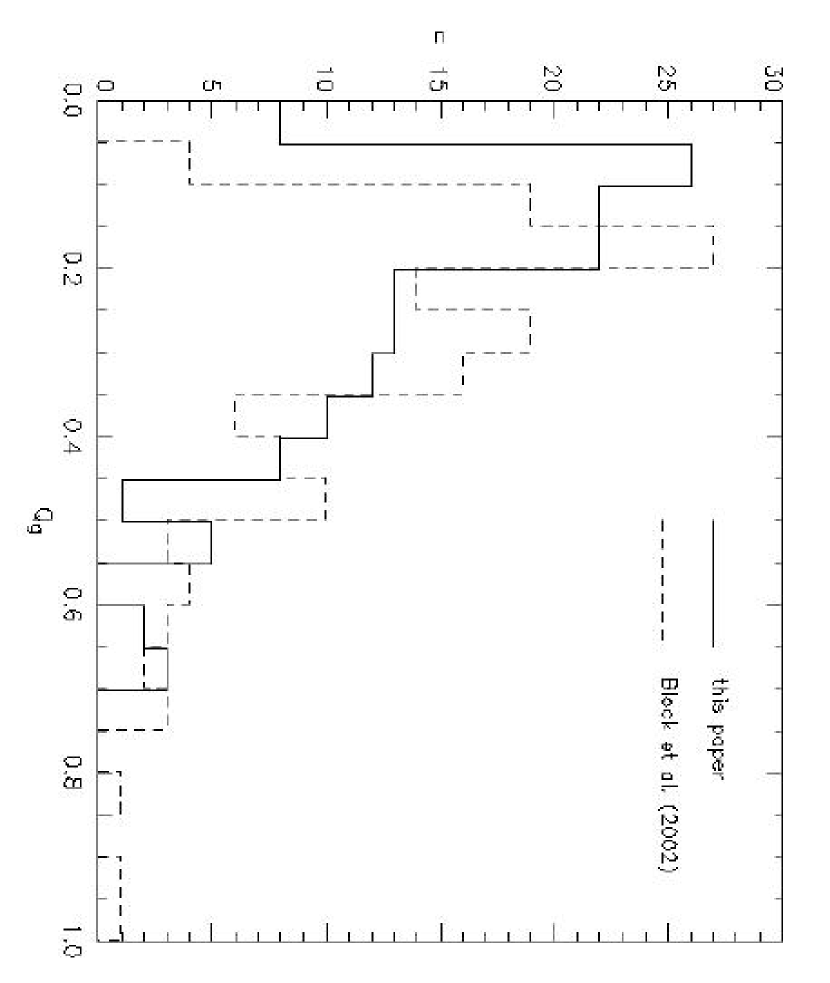
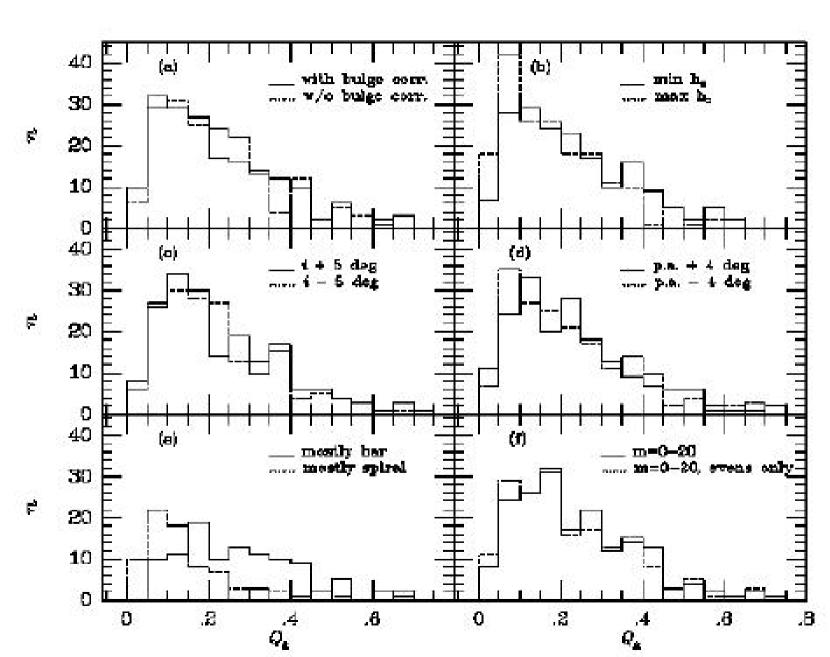
Figure 7 compares the Block et al. distribution of maximum gravitational torques with our distribution. The Block et al. histogram is not exactly the same as the one published, but is based on a table kindly sent to us by. F. Combes. It includes 159 galaxies where the measured . In spite of the similar numbers of objects, the Block et al. sample is missing 13 galaxies that are in our sample, and includes 18 galaxies missing from our sample. The differences are in part due to our different inclination cutoffs (65∘ in our analysis versus 70∘ used by Block et al.) as well as the different axis ratios used to estimate inclinations (isophotal fits for our sample versus RC3 for Block et al.). To make the comparison fair, we use only the 145 galaxies in common between our samples. Although both histograms are similar in showing an asymmetric distribution, our distribution shows more galaxies having low maximum relative torques ( 0.15). The first two bins in the Block et al. histogram are extremely deficient in galaxies, a point used by them to argue that galaxies double their mass by accretion in 1010 years. The reasons for the differences can be tied directly to a number of causes, highlighted by the histograms in Figure 8. Figure 8a shows that without the correction for bulge shape, deprojection stretch can depopulate the first two bins. However, the effect seems less important than might have been expected given that our inclination cutoffs were high in both cases. A more serious effect could be the assumed scaleheights, as shown in Figure 8b. In this plot, we allow for the scatter in from de Grijs (1998) and compute for the minimum values of = 1, 3, and 5 (“max ” case) and maximum values of 5, 7, and 12 (“min ” case) for types S0/a to Sa, Sab-Sbc, and Sc and later, respectively. The “max ” case clearly shows more low values than the “min ” case. Since Block et al. (2002) used = 12 for all galaxies irrespective of Hubble type, their analysis favored lower vertical scaleheights and larger values of on average. Our use of bulge/disk decompositions and a type dependence to / means that on average, our vertical scaleheights are higher than those used by Block et al. (2002), and hence our gravitational torques will be weaker. For a fairer comparison, we have recomputed for our deprojected images assuming . As expected, this depletes the first two bins but does not account for all the differences seen. The use of improved orientation parameters could also contribute a little to the differences.
Figures 8c and d show that uncertainties of 5∘ in inclination and 4∘ in major axis position angle do not impact the observed distribution of gravitational torques too seriously. The number of Fourier terms to =20 (Figure 8f) also has little impact.
Figure 8e shows the histograms for those galaxies where is clearly measuring a bar mostly and those where is clearly measuring a spiral. The distinction was made by examining the phase of the =2 component in the region of the maximum. If this phase was relatively constant, then the plot was concluded to be bar-dominated at the radius of the maximum. Otherwise, it was concluded to be spiral-dominated. Both distributions show a wide spread, although spirals are weaker on average than bars.
Table 3 summarizes the uncertainties in individual estimates of due to inclination, position angle, and vertical scaleheight. The table compiles the average deviation for 5∘, 4∘, and the minimum and maximum values of , for three bins of inclination.
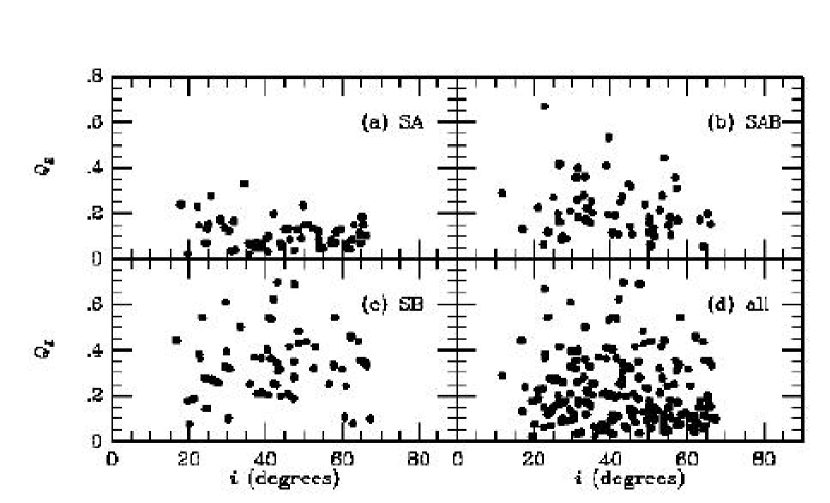
In Table 4 and Figure 9, we look for any systematic effects due to inclination. Figure 9 shows plots of versus inclination , where is computed using either our mean ellipse-fit axis ratios for the OSUBGS sample, or log for the 2MASS sample. We compute assuming oblate spheroids and an intrinsic axis ratio =0.2. The figure shows no strong systematic effect with inclination. This is verified in Table 4, where we compile the mean values for each sample in Figure 9 divided around the median: 45.∘6 for the SA sample, 40.∘7 for the SAB sample, 42.∘6 for the SB sample, and 42.∘7 for the full sample. Except for the SAB sample, the high and low inclination samples have the same means within the mean errors.
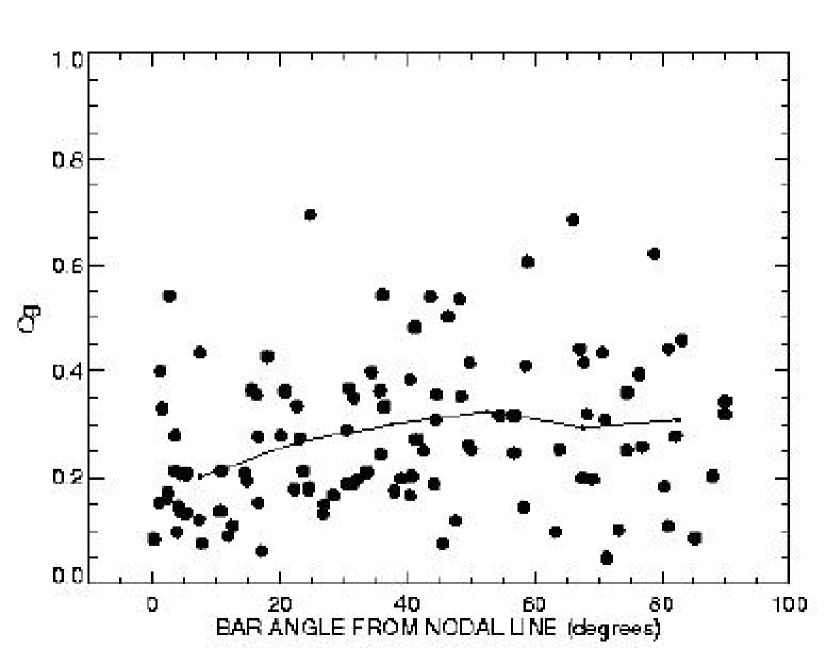
Another issue related to uncertainties is the impact of the position angle of the bar relative to the line of nodes. Buta & Block (2001) showed that in a case like NGC 1300, where the bar is oriented nearly along the line of nodes, the maximum torque is very sensitive to the assumed inclination. The same would be true if the bar is viewed end-on. We have investigated how important this might be in our current sample. Figure 10 shows a plot of versus relative bar position angle . In this plot, is determined from the phase of the =2 component of the potential at the radial location where attains a maximum; the direction in the disk plane is then projected to the sky plane. Analysis of Figure 10 indicates that there is indeed a bias in the sense that the average bar strength is weaker for those systems where the bar becomes “thicker” in deprojection. The averages are
The solid line in the plot shows the running mean of in 15∘ wide bins. The difference is statistically significant, with the probability of having the same true mean values being only 0.0035.
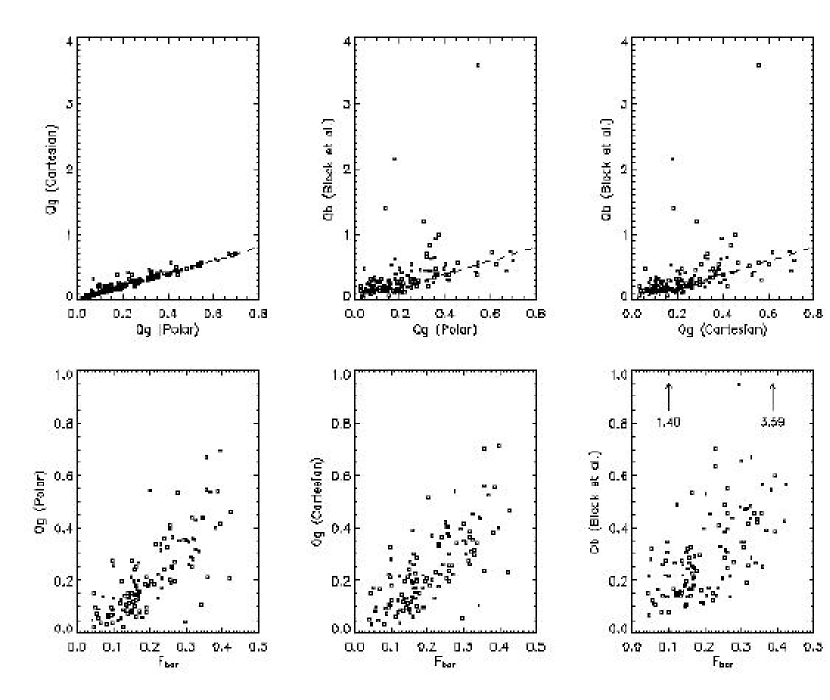
The referee has questioned whether our use of a polar grid approach might cause lower values of to be measured. The idea is that smoothing with a polar grid might reduce the strength of the perturbation, increasing the number of low values. We have checked this by recomputing our values using a Cartesian approach with a 128128 grid resolution (covering the whole galaxies usually, but not necessarily the whole image). The radial profiles were constructed separately for four image quadrants, and the mean of these profiles was computed. The Cartesian was then taken from the peak of the Cartesian profile, limited to the radial range around the force maximum found by the polar method. This was done to insure that the Cartesian corresponds to the bar region, and does not refer to some spurious force maximum in the outer parts of the images. Figure 11 (upper panels) shows the results of the comparison. We find very good agreement between our estimates from the Cartesian and polar grid approaches. However, comparison of the same numbers with the Block et al. (2002) values is poorer, as shown by the upper middle and upper right panels of Figure 11.
The upper left panel of Figure 11 does show that some Cartesian values are noticeably larger than the polar grid values. However, as discussed in Laurikainen & Salo (2002), the Cartesian method can lead to large spurious force values in the noisy outer parts of images, sometimes leading to an overestimate of if the results are automatically collected, without careful inspection of the force profiles. This might account for several very large values of estimated by Block et al. (2002), seen in the upper panels of Figure 11. Mainly for this reason, we chose the polar grid force evaluation as our standard procedure. The Cartesian method is useful as a check of the polar method results.
As a further check on how our methods affect the histogram of maximum relative torques, we have analyzed more closely three highly-inclined galaxies in our sample, NGC 3166, 3338, and 3675, trying to duplicate the methods used by Block et al.: (1) use the RC3 position angle and inclination to deproject the galaxies; (2) no correction for the shape of the bulge; (3) radial scalelength derived from in RC3 assuming all the galaxies follow the Freeman (1970) law, with =/12; and (4) using a Cartesian transformation for the potential. The results are = 0.26, 0.16, and 0.15, respectively, compared with the values of 0.27, 0.14, and 0.15 actually derived by Block et al. Thus, mimicking the Block et al. treatment with our codes yields values that fully agree with those obtained by Block et al. In contrast, our refined approach gives values of = 0.11, 0.08, and 0.08 for the same galaxies. The reason for the low values we get compared to theirs is due to our refinements, and not a serious difference in our codes.
The idea that galaxies might accrete significant quantities of external gas during a Hubble time is certainly intriguing. Our revised histogram (with its extended tail of large values) still supports this idea, but may favor an accretion rate between the two cases discussed by Block et al. (2002): the no accretion idea and a rate which doubles the mass in 1010 years. As shown in this work, the bulge correction, improvements in the orientation parameters, and the larger vertical scaleheights we use considerably increase the number of galaxies with low maximum relative torques.
In spite of the differences with Block et al., we still find a deficiency of galaxies in the lowest torque bin, 0.05. Truly axisymmetric galaxies appear to be rare in the OSUBGS and 2MASS samples, although we note that because cannot be negative, noise could also deplete the first bin to some extent.
7 Comparison with the Parameter
Whyte et al. (2002) have used the OSUBGS to compute bar strength using an isophotal analysis. They derived a bar strength parameter, , based on the minimum -band isophotal axis ratio, , in the bar region estimated from a moment analysis involving a series of cuts through an image in surface brightness (Abraham & Merrifield 2000). The parameter is convenient because it scales the bar strength to the range 0.0 to 1.0, and also because it stretches the range corresponding to the important small values. Block et al. (2002) used the Whyte et al. results to support their findings of few nonbarred galaxies in the OSU database, and thus their conclusions concerning the accretion rate in galaxies.
The lower panels of Figure 11 show comparisons between our values (both polar and Cartesian) and and (Block et al.) and . The most striking difference is how well correlates with our values of , showing that the shape of the bar does correspond well to the strength of the gravity field. This was also shown by Laurikainen, Salo, & Rautiainen (2002) for their 2MASS sample. In contrast, the comparison between and (Block et al.) shows a noticeably larger scatter.
In spite of the good agreement between and our values, is by no means a suitable replacement for . is probably determined by the self-consistent response of the bar to the gravitational field that maintains it, and thus it measures the force in an indirect fashion. , on the other hand, estimates this field directly from the luminosity distribution.
8 The Impact of Dark Matter
Ideally, the way to assess the impact of dark matter on a torque indicator such as would be to compare an observed rotation curve with a rotation curve predicted from an azimuthally-averaged light profile, preferentially a near-infrared profile corrected for color effects due to a radial stellar population change (e.g., Bell & de Jong 2001). Then the signature of the dark component would be how much the observed and predicted rotation curves disagree, especially in the outer parts of the galaxies. However, it is impractical for us to carry out such a comparison for our full sample in a homogeneous way. Thus, we have used a more statistical approach.
Our estimates for halo corrections are based on the extensive analysis of rotation curves and light profiles by Persic, Salucci, & Stel (1996, hereafter PSS). In this paper the dark halo rotation curves are described by the isothermal sphere law, with a smooth transition to constant core density
where is the radius normalized to the optical radius, a fiducial reference radius enclosing 83% of the total blue luminosity.333For this radius we have actually used /2, which is specifically valid only for a Freeman disk. The error committed for those galaxies that may not be Freeman disks is not serious given the approximate nature of these estimates. The parameter is the halo core radius, also in units of . PSS (see especially their erratum) give, based on their sample of 1100 optical and radio rotation curves,
and
where in the -band. Near the optical radius we may estimate
where includes the rotation velocity due to the disk plus bulge.
Eqs. (1)-(3) now define at all radii, as a function of , and the value of at some value near . Once is known, the profiles computed under a constant assumption are modified to
where and are the radial forces due to visible and dark masses, respectively, and the superscript “hc” means “halo-corrected”. If the measurements extend to , then has been used, while in the case , then ) was used for fitting . Values of were taken from RC3, and the -band luminosities were calculated from -magnitudes and Galactic extinctions given in NED and distances from Tully (1988).
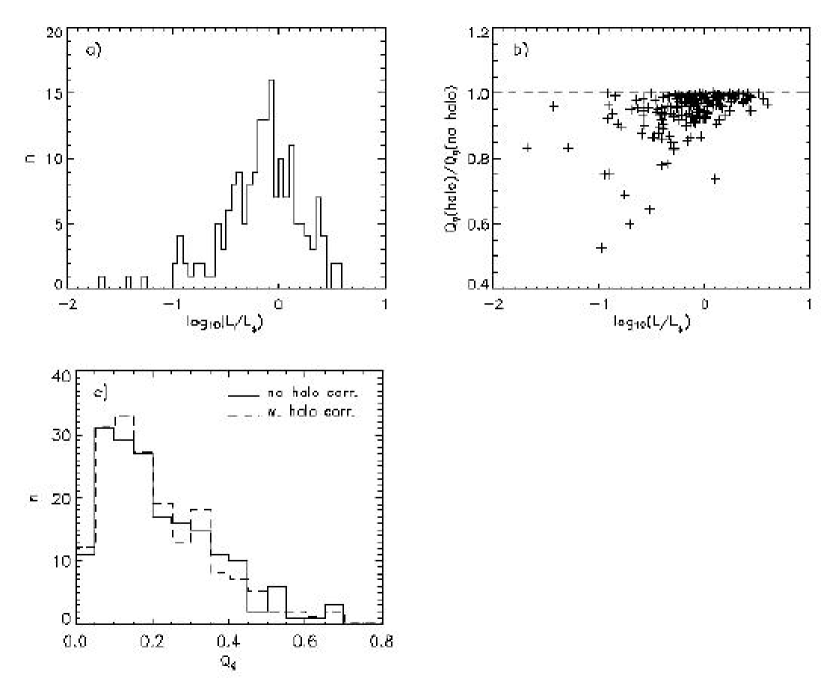
Figure 12a shows the distribution of for our sample of 180 galaxies. The distribution peaks near 1. Figure 12b shows the distribution of as a function of , indicating how the correction gets more important for less luminous galaxies with more dominant halo components. The deviating point at is NGC 7213, for which is practically zero and obtained near ( changes from 0.023 to 0.017). Finally, Figure 12c shows the distribution of with and without halo correction. The average value of with the correction is 0.209 compared with 0.222 without the correction, indicating only a marginal (6%) reduction.
Altogether, the effect of dark halos appears to be weak for the sample, which as we have shown is dominated by fairly luminous systems for which PSS models imply halos with rather large core radii and relatively small mass within . Therefore, the contribution to is small in the inner parts of the galaxy where maximum ’s are typically obtained, at least for bars. For spiral forces alone the effect would be more prominent.
A potential problem with the fits described above for low luminosity galaxies is that in many cases the measurements probably do not reach far enough, in terms of disk scalengths, to yield reliable outer rotation curves (truncation of the disk overestimates the disk radial force and thus the rotation velocities). For measurements this is not a problem, as noted by Laurikainen & Salo (2002). However, the above procedure uses outer ’s to estimate ’s, which therefore might in some cases be overestimated. Indeed, strange, strongly rising rotation curves follow for some of the less luminous galaxies when the above procedure is applied (although they are rising already before inclusion of the halo). Nevertheless, since this error in all cases overestimates the reduction of due to the inclusion of a halo, it is not important for the present purpose.
9 Type Dependence of Maximum Relative Gravitational Torques
Because the bulge is usually more significant in early-type galaxies, we might expect that maximum relative gravitational torques would be diluted somewhat compared to later-type galaxies. This is because the bulge can be a significant contributor to the mean axisymmetric radial force in the bar regions of early-type spirals. Block et al. (2001) searched for this effect in their combined sample of 75 galaxies but did not detect a measurable type dependence. They argued that the bulge dilution at early types could be partly offset by the shorter bars found at later types (e.g., Elmegreen & Elmegreen 1985).
Laurikainen, Salo, & Rautiainen (2002) also searched for a type dependence in in a 2MASS sample of 43 barred galaxies, half of which have AGN. In their sample, 19 galaxies have types Sa-Sb and 21 galaxies have types Sbc and later. These authors derived = 0.250.03 for the early types and 0.380.05 for the later types, suggesting a possible difference.
Our refined treatment of bulges and our larger sample compared to these previous studies allows us to re-evaluate this possible effect more reliably. As we have noted, we allowed for the more spherical shapes of bulges using two-dimensional photometric decompositions that took into account, where necessary, the contributions of bars. We also treated bulges as spherical in their potentials, such that the forces in the plain are properly estimated. In Buta & Block (2001) and Block et al. (2001), bulges were assumed to be as flat as disks, which overestimated their radial forces in the plane.
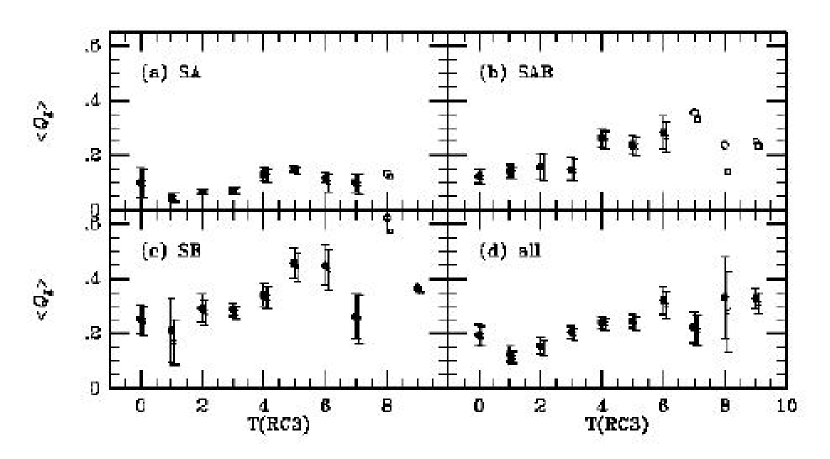
Figure 13 shows the correlation of with RC3 revised Hubble type in our present sample. The filled circles show the averages with no dark halo correction, while the crosses show the averages with a halo correction. Table 5 also summarizes the numerical values for no halo correction. This plot does appear to detect a type-dependence in our measured maximum relative gravitational torques. For early-type spirals (=0-3, or S0/a-Sb), = 0.1770.014, while for late-type spirals (=4-9, or Sbc-Sm), = 0.2580.015. A halo correction reduces these means only slightly, to 0.169 for S0/a-Sb and 0.247 for Sbc-Sm. The difference between early and late-type spirals appears to be significant. As shown in Figure 13 and Table 4, the effect persists even when the sample is divided by de Vaucouleurs family, and has the same trend in the sense that early-types have lower average . This suggests that early-type spirals do indeed have diluted maximum relative gravitational torques, an effect which must contribute to the observed scatter of among the three de Vaucouleurs families.
In interpreting this result, the first question one might ask is how reliable the bulge decompositions are. Since we used a sophisticated two-dimensional decomposition allowing for a bulge, a disk, and a bar in the fit, we believe the decompositions are as good as we will be able to make them. The referee argues that bulge subtraction is delicate and not unique, and that if the bulge participates in the bar instability (as in the box/peanut shape), then its impact may not be reliably treated. This is a valid concern. However, Laurikainen & Salo (2002) have tested a radius-dependent scaleheight that simulates a peanut-shaped distribution in the sense that the vertical scaleheight increases towards the outer parts of the bar by an amount similar to that observed in real galaxies. This was found to affect estimates by only about 5%.
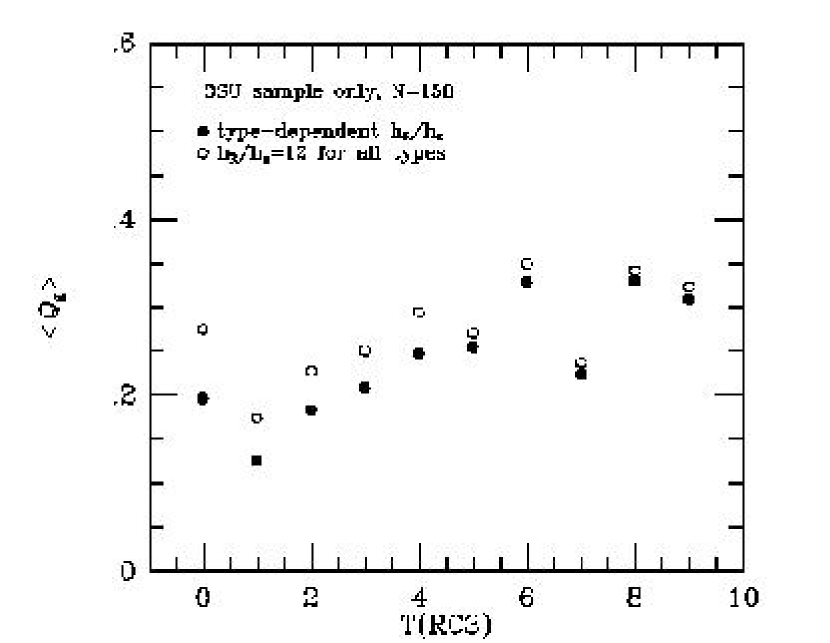
Another important question is how our assumptions concerning the vertical scaleheight contribute to the observed type dependence. Our estimates of have utilized the findings of de Grijs (1998) to infer from , assigning larger values of to early-types compared to late-types. If we assume instead that = /12 for all types, we get the results shown in Figure 14. Our assumption of a type dependence to does indeed enhance the measured type-dependence in . However, the assumption of a constant value of is inconsistent with studies of edge-on galaxies and favors our approach.
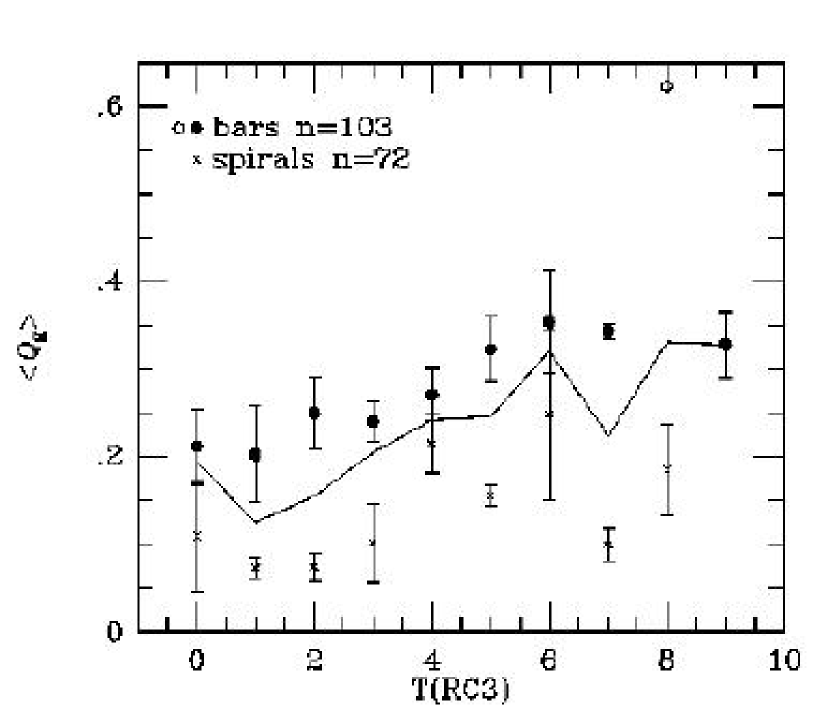
Figure 13 shows that is type-dependent, but it does not prove unequivocably that this means bars are relatively weaker in early-type spirals than in late type spirals. This is because is also affected by spiral arm torques. To try and approximately separate the two phenomena, we use the bar/spiral discriminations from Figure 8e and discussed in section 6. If we compute as a function of type for these subsamples separately, we get the results in Figure 15. Surprisingly, it appears that both bars and spirals are relatively weaker in early-types as compared to late-types. For bars especially, the type dependence is remarkably well-defined.
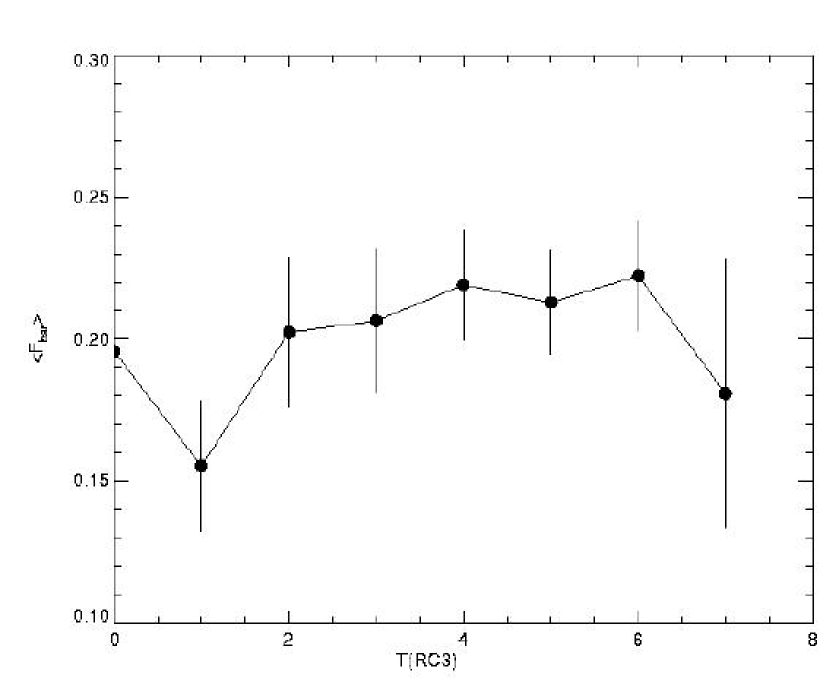
A type-dependence in bar strength is also found in the Whyte et al. (2002) analysis, although it is smaller than found for . Figure 16 shows vs RC3 type index . Just as for , early-type spirals have lower average than late-types. For 49 S0/a-Sb galaxies in the Whyte et al. sample, = 0.190 0.013, while for 76 Sbc and later galaxies, = 0.213 0.011. The effect is marginal but is still in the same sense as found for .
Note that on the basis of theoretical models, one might expect early-type galaxy bars to have stronger maximum torques simply because the bars are longer than those in later types (Elmegreen & Elmegreen 1985). Apparently, bulge dilution is a more dominant effect, so that late-type galaxy bars are stronger in a relative sense. Note that this result refers mainly to Sbc-Sc galaxies as late-types, as our sample has few galaxies of types Scd and later. This is a result of our sample biases. A distance-limited sample would provide more reliable results for the very late-type spirals.
10 Correlations with Near-Infrared Morphology
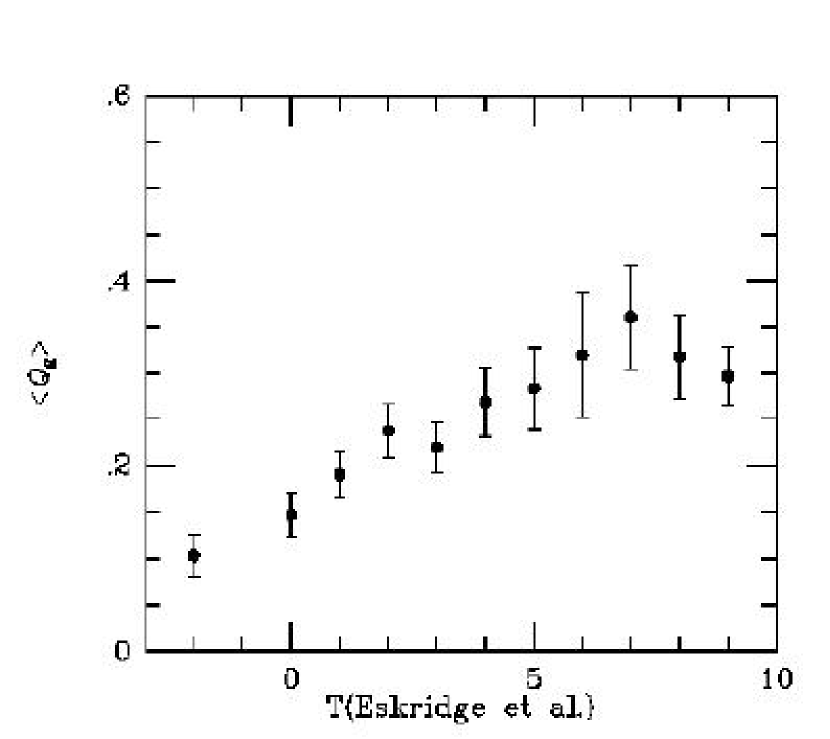
Eskridge et al. (2002) used the -band images in the OSUBGS to estimate near-IR classifications of galaxies within the revised Hubble framework of de Vaucouleurs (1959) and Sandage and Bedke (1994). These classifications include the family (SAB or SB and plane S for nonbarred galaxies), and the stage from S0 to Sm. We converted the -band stages, estimated as if the images were blue light images, to the RC3 numerical index scale. Eskridge et al. (2002) note that the apparently increased bulge-to-disk ratio and the greater degree of smoothness of structure biases near-IR classifications towards earlier types on average. For galaxies where these effects changed the type from a spiral classification to S0 or SB0, we have used the index =2.
Table 6 summarizes the mean values by stage and family from the near-IR classifications. As noted by Eskridge et al. (2000), near-IR classifications from the OSU sample show twice as many strongly-barred (SB) types as in the optical. However, Table 6 shows that the Eskridge et al. SAB and SB classifications have slightly lower than the corresponding RC3 families. RC3 SB galaxies in our sample have = 0.331 0.019 (m.e.), while Eskridge et al. SB galaxies in our sample have = 0.290 0.015. The likely reason for this difference is that near-IR images not only make weak bars more evident, but also make stronger bars more obvious. Thus, near-IR imaging does not necessarily change the rankings of bars much. There is no new category for a -band SB spiral to be placed into even though it looks stronger in the near-IR. However, a -band SAB spiral can be placed into the SB category if it looks stronger in the near-IR. Since the real rankings are not changed much, the mean for the near-IR families is decreased because of inclusion of weaker bars.
Figure 17 shows that when is plotted against the numerically coded near-IR stages, a strong trend with type is seen that extends into the near-IR S0 class. The trend is smoother than that found using RC3 types, but has about the same amplitude from S0/a to Sm. The improved correlation is probably not unexpected since the appearance of the spiral arms helped to determine the near-IR type, and the strength of the arms can impact . For example, the spiral arms in some of the OSU galaxies is virtually invisible in the near-IR, leading to a classification of S0. However, the implication once again is that maximum relative torques are weaker in early-type disk galaxies than in late-type disk galaxies.
11 Conclusions
We have derived an accurate distribution of maximum relative gravitational torques in a sample of 180 OSUBGS and 2MASS galaxies. The sample is representative of bright galaxies, but is biased against late-type, low-luminosity barred spirals. It is not biased against nonbarred galaxies. The distribution is more accurate than previous studies because of the refinement of the gravitational torque method. We have used two-dimensional bulge/disk/bar decomposition to eliminate the impact of bulge deprojection stretch on the calculated torques, and to derive reliable radial scalelengths that can be scaled to vertical scaleheights using the type dependence of derived by de Grijs (1998). We have also used orientation parameters based on isophotal ellipse fits to the blue-light images in the OSUBGS, which will be an improvement over previously published values for many of the galaxies. With these refinements, we find a higher relative frequency of low maximum relative torque galaxies compared to Block et al. (2002). The implications for the amount of accreted matter advocated by Block et al. (2002) remain to be evaluated, but we expect that the revised distribution will favor less accretion once the models account for the same refinements the observations have accounted for. This will be addressed in a future paper.
We have discussed in detail the uncertainties and biases in our distribution of gravitational torques. Because the sample emphasizes high-luminosity systems, corrections for dark matter appear to be small. In the future, further improvements could be made by obtaining two-dimensional velocity fields of the galaxies in question. This would facilitate the derivation of kinematic orientation parameters, and improved deprojections.
We find a significant dependence of the mean maximum gravitational torque on revised Hubble type. The effect persists even when the sample is divided into bar-dominated and spiral-dominated subsamples, and when near-infrared types from Eskridge et al. (2002) are used in place of RC3 types. Both bars and spirals tend to have weaker average relative torques in early-type spirals compared to late-type spirals. The likely cause of this is torque dilution due to the stronger bulges in early-type spirals. Dark matter has only a marginal impact on this effect.
We thank the referee, F. Combes, for valuable comments on our paper and for sending a file with her estimates of for the OSU sample. We also thank L. Whyte for sending her table of values. RB acknowledges the support of NSF Grant AST-0205143 to the University of Alabama. EL and HS acknowledge the support of the Academy of Finland, and EL also from the Magnus Ehrnrooth Foundation. Funding for the OSU Bright Galaxy Survey was provided by grants from the National Science Foundation (grants AST-9217716 and AST-9617006), with additional funding from the Ohio State University. This publication also utilized images from the Two Micron All-Sky Survey, which is a joint project of the University of Massachusetts and the Infrared Processing and Analysis Center of the California Institute of Technology, funded by the National Aeronautics and Space Administration and the National Science Foundation. This research has also made use of the NASA/IPAC Extragalactic Database (NED) which is operated by the Jet Propulsion Laboratory, California Institute of Technology, under contract with the National Aeronautics and Space Administration.
REFERENCES
Abraham, R. G. & Merrifield, M. R. 2000, AJ, 120, 2835
Bell, E. F. & de Jong, R. S. 2001, ApJ, 550, 212
Bournaud, F. & Combes, F. 2002, A&A, 392, 83
Buta, R. & Block, D. L. 2001, ApJ, 550, 243
Buta, R., Block, D. L., & Knapen, J. H. 2003, AJ, in press
Buta, R. & Combes, F. 1996, Fund. Cos. Phys., 17, 95
Block, D. L., Puerari, I., Knapen, J. H., Elmegreen, B. G., Buta, R., Stedman, S., & Elmegreen, D. M. 2001, A&A, 375, 761
Block, D. L., Bournaud, F., Combes, F., Puerari, I., & Buta, R. 2002, A&A, 394, L35
Combes, F. & Sanders, R. H. 1981, A&A, 96, 164
Das, M., Teuben, P. J., Vogel, S. N., Regan, M. W., Sheth, K., Harris, A. I., & Jefferys, W. H. 2003, ApJ, 582, 190
de Grijs, R. 1998, MNRAS, 299, 595
de Vaucouleurs, G. 1959, Handbuch der Physik, 53, 275
de Vaucouleurs, G. et al. 1991, Third Reference Catalog of Bright Galaxies (New York: Springer) (RC3)
Elmegreen, B. G. & Elmegreen, D. M. 1985, ApJ, 288, 438
Eskridge, P., Frogel, J. A., Pogge, R. W., et al. 2000, AJ, 119, 536
Eskridge, P., Frogel, J. A., Pogge, R. W., et al. 2002, ApJS, 143, 73
Gilmore, G. & Reid, N. 1983, MNRAS, 202, 1025
Hohl, F. 1971, ApJ, 168, 343
Kormendy, J. & Norman, C. 1979, ApJ, 233, 539
Kormendy, J. 1993, in Galactic Bulges, IAU Symp. No. 153, H. DeJonghe and H. J. Habing, eds., Kluwer, Dordrecht, p. 209
Kranz, T., Slyz, A., & Rix, H.-W. 2003, ApJ, 586, 143
Laurikainen, E., Salo, H., & Rautiainen, P. 2002, MNRAS, 331, 880
Laurikainen, E. & Salo, H. 2002, MNRAS, 337, 1118
Laurikainen, E., Salo, H., Buta, R., & Vasylyev, S. 2003, in preparation
Lynden-Bell, D. 1979, MNRAS, 187, 101
Martin, P. & Roy, J.-R. 1994, ApJ, 424, 599
McCall, M. L. 1986, PASP, 98, 992
Miller, R. H., Prendergast, K. H., & Quirk, W. J. 1970, ApJ, 161, 903
Miwa, T. & Noguchi, M. 1998, ApJ, 499, 149
Mollenhöff, C. & Heidt, J. 2001, A&A, 368, 16
Noguchi, M. 1996, ApJ, 469, 605
Norman, C. A., Sellwood, J. A., & Hasan, H. 1996, ApJ, 462, 114
Persic, M., Salucci, P., & Stel, F. 1996, MNRAS, 281, 27
Quillen, A. C., Frogel, J. A., & González, R. A. 1994, ApJ, 437, 162 (QFG)
Roberts, W. W., Roberts, M. S., & Shu, F. H. 1975, ApJ, 196, 381
Salo, H., Laurikainen, E., & Buta, R. 2003, in preparation
Sanders, R. H. & Tubbs, A. D. 1980, ApJ, 235, 803
Sandage, A. & Bedke, J. 1994, Carnegie Atlas of Galaxies, Carnegie Inst. of Wash. Publ. No. 638
Schwarz, M. P. 1981, ApJ, 247, 77
Sellwood, J. A. 2000, in Dynamics of Galaxies: From the Early Universe to the Present, F. Combes, G. A. Mamon, & V. Charmandaris, eds., San Francisco, ASP Conf. Ser. 197, p. 3.
Sellwood, J. A. & Moore, E. M. 1999, ApJ, 510, 125
Sellwood, J. A. and Wilkinson, A. 1993, Rep. Prog. Phys. 56, 173
Sérsic, J. L. 1968, Atlas de Galaxias Australes (Cordoba: Obs. Astron. Univ. Nac. Cordoba)
Skrutskie, M. F. et al. 1997, in The Impact of Large-Scale Near-IR Surveys, F. Grazon et al., eds., Dordrecht, Kluwer, p. 25
Tully, R. B. 1988, Nearby Galaxies Catalogue, Cambridge, Cambridge University Press
Whyte, L., Abraham, R. G., Merrifield, M. R., Eskridge, P. B., Frogel, J. A., & Pogge, R. W. 2002, MNRAS, 336, 1281
| Parameter | SA | SAB | SB | SA (T88) | SAB (T88) | SB (T88) |
|---|---|---|---|---|---|---|
| 58 | 57 | 62 | 291 | 364 | 609 | |
| 0.15 | 0.10 | 0.17 | 0.19 | 0.17 | 0.21 | |
| 0.17 | 0.15 | 0.15 | 0.29 | 0.21 | 0.30 | |
| 3.67 | 3.83 | 3.61 | 4.45 | 5.18 | 6.46 | |
| 1.64 | 1.66 | 1.62 | 1.58 | 1.51 | 1.46 | |
| 0.62 (51) | 0.61 (49) | 0.60 (52) | 0.58 (209) | 0.56 (219) | 0.53 (286) | |
| 0.06 (41) | 0.05 (39) | 0.04 (46) | 0.00 (169) | 0.03 (175) | 0.07 (256) | |
| (km s-1) | 1467 | 1322 | 1536 | 1564 | 1622 | 1543 |
| (Mpc) | 21.0 | 19.0 | 20.8 | 22.3 | 23.6 | 21.6 |
| 20.37 | 20.21 | 20.22 | 19.8 | 19.5 | 18.7 | |
| (kpc) | 26.7 | 25.5 | 25.4 | 24.3 | 22.9 | 18.5 |
| 0.1100.065 | 0.2210.122 | 0.3310.147 | ….. | ….. | ….. |
| 0.025 | 10 | 0.056 |
| 0.075 | 32 | 0.178 |
| 0.125 | 29 | 0.161 |
| 0.175 | 27 | 0.150 |
| 0.225 | 17 | 0.094 |
| 0.275 | 16 | 0.089 |
| 0.325 | 14 | 0.078 |
| 0.375 | 12 | 0.067 |
| 0.425 | 10 | 0.056 |
| 0.475 | 2 | 0.011 |
| 0.525 | 6 | 0.033 |
| 0.575 | 0 | 0.000 |
| 0.625 | 2 | 0.011 |
| 0.675 | 3 | 0.017 |
| ave. dev.(i5) | ave. dev.(pa4) | ave. dev.() | |||
|---|---|---|---|---|---|
| 24.0 | 0.237 | 0.010 | 0.009 | 0.032 | 39 |
| 40.5 | 0.237 | 0.019 | 0.010 | 0.027 | 83 |
| 58.5 | 0.190 | 0.038 | 0.020 | 0.021 | 58 |
| Sample | |||||
|---|---|---|---|---|---|
| SA | 58 | 0.1150.015 | 0.080 | 0.1040.009 | 0.046 |
| SAB | 57 | 0.2450.026 | 0.141 | 0.1960.018 | 0.094 |
| SB | 62 | 0.3250.027 | 0.148 | 0.3360.027 | 0.148 |
| full | 180 | 0.2330.016 | 0.151 | 0.2110.015 | 0.143 |
| Stage | (RC3) | mean error | |||
|---|---|---|---|---|---|
| S0/a | 0 | 0.195 | 0.131 | 0.038 | 12 |
| Sa | 1 | 0.125 | 0.108 | 0.028 | 15 |
| Sab | 2 | 0.155 | 0.124 | 0.030 | 17 |
| Sb | 3 | 0.205 | 0.129 | 0.023 | 32 |
| Sbc | 4 | 0.242 | 0.140 | 0.022 | 39 |
| Sc | 5 | 0.246 | 0.155 | 0.025 | 38 |
| Scd | 6 | 0.321 | 0.180 | 0.050 | 13 |
| Sd | 7 | 0.224 | 0.137 | 0.056 | 6 |
| Sdm | 8 | 0.331 | 0.258 | 0.149 | 3 |
| Sm | 9 | 0.328 | 0.066 | 0.038 | 3 |
| S0/a-Sb | 0-3 | 0.177 | 0.126 | 0.014 | 76 |
| Sbc-Sm | 4-9 | 0.258 | 0.153 | 0.015 | 102 |
| SA0/a-SAb | 0-3 | 0.068 | 0.038 | 0.008 | 24 |
| SAbc-SAm | 4-9 | 0.139 | 0.064 | 0.011 | 34 |
| SAB0/a-SABb | 0-3 | 0.145 | 0.073 | 0.017 | 19 |
| SABbc-SABm | 4-9 | 0.260 | 0.124 | 0.020 | 38 |
| SB0/a-SBb | 0-3 | 0.274 | 0.118 | 0.021 | 33 |
| SBbc-SBm | 4-9 | 0.395 | 0.152 | 0.028 | 29 |
| Stage or Family | mean error | |||
|---|---|---|---|---|
| S0 | 0.103 | 0.070 | 0.022 | 10 |
| S0/a | 0.147 | 0.095 | 0.024 | 15 |
| Sa | 0.191 | 0.124 | 0.025 | 24 |
| Sab | 0.238 | 0.121 | 0.029 | 18 |
| Sb | 0.220 | 0.143 | 0.027 | 28 |
| Sbc | 0.269 | 0.168 | 0.037 | 20 |
| Sc | 0.284 | 0.152 | 0.044 | 12 |
| Scd | 0.320 | 0.200 | 0.067 | 9 |
| Sd | 0.361 | 0.177 | 0.056 | 10 |
| Sdm | 0.318 | 0.111 | 0.045 | 6 |
| Sm | 0.297 | 0.063 | 0.032 | 4 |
| S0-Sb | 0.159 | 0.110 | 0.016 | 49 |
| Sbc-Sm | 0.265 | 0.158 | 0.016 | 97 |
| S | 0.116 | 0.082 | 0.014 | 32 |
| SAB | 0.174 | 0.112 | 0.022 | 26 |
| SB | 0.290 | 0.147 | 0.015 | 98 |