vdberg@merate.mi.astro.it, tagliaferri@merate.mi.astro.it, belloni@merate.mi.astro.it 22institutetext: Astronomical Institute, Utrecht University, P.O.Box 80 000, 3508 TA Utrecht, The Netherlands; F.W.M.Verbunt@astro.uu.nl
A Chandra observation of the old open cluster M 67 ††thanks: Tables 1 and 4 are only available in electronic form via http://www.edpsciences.org
We present the results of a 47-ks Chandra-ACIS observation of the old open cluster M 67. We detected 25 proper-motion cluster members (including ten new sources) and 12 sources (all new) that we suspect to be members from their locations close to the main sequence (1–1.7). Of the detected members, 23 are binaries. Among the new sources that are members and probable members are four spectroscopic binaries with 12 d, two contact binaries and two periodic photometric variables with 8.4 d. Their X-rays are likely the result of coronal activity enhanced by tidally locked rapid rotation. The X-rays of the new source S 997, a blue straggler in a wide eccentric orbit, are puzzling. Spectral fits show that the X-rays of the brightest sources S 1063 (a binary with a sub-subgiant), S 1082 (a triple blue straggler with a close binary) and S 1040 (a circular binary of a giant and a cool white dwarf), are consistent with coronal emission. We detected a new bright source that must have brightened at least about ten times since the time of the ROSAT observations. It is not clear whether its faint blue optical counterpart belongs to M 67. We discuss the possibility that this source is a low-mass X-ray binary in quiescence, which would be the first of its kind in an open cluster. In addition to cluster members, we detected about 100 background sources, many of which we identify with faint objects in the ESO Imaging Survey.
Key Words.:
stars: activity – binaries: general – stars: blue stragglers – open clusters and associations: individual: M 67 – X-rays: binaries1 Introduction
The X-rays of late-type stars are believed to result from a magnetic dynamo driven by convection and rotation. As single stars spin down as they age, their X-ray emission is expected to decrease accordingly. Observations of young (600 Myr) open clusters indeed show a decline of the average X-ray luminosity with age (Randich 1997). Consequently, X-ray observations of old (1 Gyr) open clusters are especially suited to look for special stars among the cluster members, and above all to look for interacting binaries. The efficiency to detect binaries in old open clusters with X-ray observations is illustrated by the results of ROSAT observations of IC 4651, NGC 6940, NGC 752, M 67 and NGC 188 (Belloni & Tagliaferri 1997, 1998; Belloni & Verbunt 1996; Belloni et al. 1993, 1998). In these clusters, more than half of the X-ray sources with a cluster member as optical counterpart, are identified with a binary of some sort. Mainly they are active binaries in which tidal interaction forces the stars into rotation that is synchronized to the orbit, thereby maintaining rapid rotation even at high ages. Typical X-ray luminosities of late-type active binaries in the ROSAT 0.1–2.4 keV band are 1028–1032 erg s-1, where the lowest luminosities are in general found for active main-sequence stars (BY Dra systems) and the highest for active giants and subgiants (RS CVn binaries; Dempsey et al. 1993a, 1997). In this paper, we refer to both types as RS CVn systems. The probability to detect the brightest systems in young clusters – with higher main-sequence turnoff masses – is smaller as more massive (sub)giants evolve more rapidly. Among the counterparts in old open clusters are also binary blue stragglers and a single, rapidly rotating FK Com giant (believed to be the product of a merged binary). Until now, ROSAT also detected one cataclysmic variable (discovered in the optical) and one hot white dwarf, but due to their optical faintness and the magnitude limits of optical studies, such sources are much more difficult to identify.
Thus, in principle, observing old open clusters in X-rays is a way to study the properties of their binary populations, characterized by the clusters’ properties like age and richness. Reversely, the number and properties of the binaries in a cluster are important for the dynamical evolution of a cluster (Hut et al. 1992). X-ray observations can be useful to point out close-binary candidates among stars that are difficult to include in systematic radial-velocity searches for binaries, for example among stars on the faint part of the main sequence.
In practice, the number of old open clusters that is not too distant or too reddened to be observed in X-rays, and for which the necessary information exists to complement the X-ray data (like proper-motion, radial-velocity and photometric data), is rather limited. One of the few suitable clusters for an X-ray study is M 67, a 4 Gyr-old cluster that has been investigated in detail in the optical. M 67 is a rich cluster, is relatively nearby (820 pc) and nearly unreddened (), with a metallicity close to solar (Sarajedini et al. 1999). Proper-motion studies to establish cluster membership have been done by e.g. Sanders (1977), Girard et al. (1989) and Zhao et al. (1993); in this paper we use membership information from Girard et al. (1989) that reaches down to . ROSAT-PSPC observations of M 67 are presented by Belloni et al. (1993, 1998). The faintest source detected in the combined ROSAT images has an X-ray flux of about 9 10-15 erg cm-2 s-1 (0.1-2.4 keV), which corresponds to a luminosity of 7 1029 erg s-1 at a distance of 820 pc. Here, we present the results of a recent Chandra observation of M 67 with a limiting flux about 40 times lower. With the increased sensitivity of this observation compared to those of the ROSAT observations, we can detect fainter sources, but single cluster stars remain out of reach. Moreover, Chandra’s subarcsecond positional accuracy avoids confusion when looking for optical counterparts in the crowded field of the cluster. We describe the data reduction and source detection in Sect. 2, the crossidentification with optical and ROSAT sources in Sect. 3, and the spectral and variability analyses in Sect. 4. Sect. 5 discusses individual systems in more detail.
2 Observation and data reduction
2.1 Observation
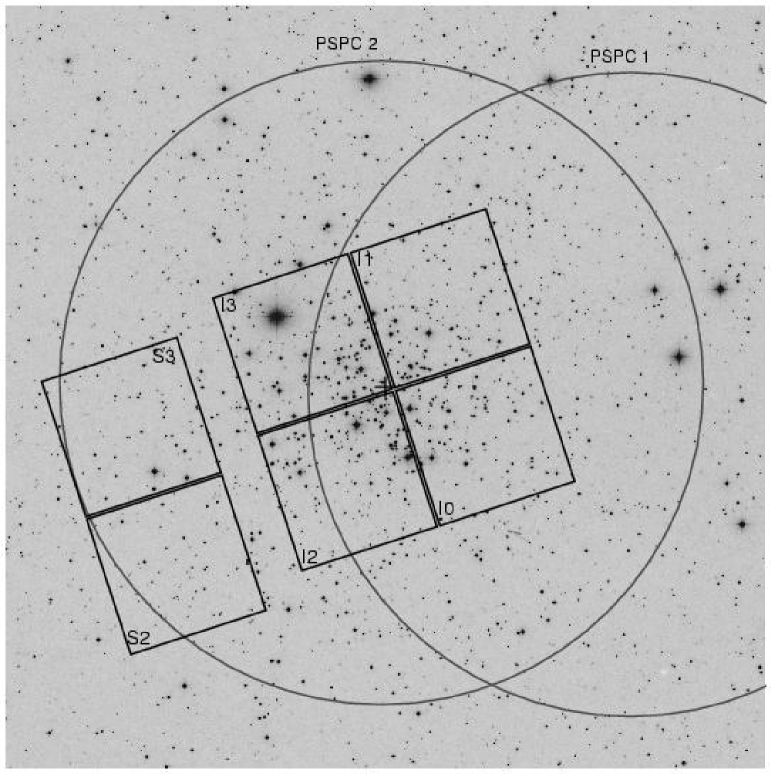
The central field of M 67 was observed from May 31, 11:19 to June 1, 00:47 2001 UTC for 46.8 ks in timed exposure mode using faint telemetry format (ObsId 1873) with the Chandra Advanced CCD Imaging Spectrometer (ACIS, see The Chandra Proposers’ Observatory Guide for the instrument description). The integration time of individual frames was 3.2 s. Each ACIS detector has a field of view of , while one pixel projects to on the sky. The telescope aimpoint was at 8:51:23.1, 11:49:32.7 (J 2000) on CCD I 3, such that the four ACIS-I detectors covered the cluster centre; two additional ACIS-S CCDs (S 2 and S 3) imaged part of the eastern regions of the cluster. See Fig. 1 for the configuration of the detectors on the sky. The field covered by ACIS is fully included in both ROSAT-PSPC images of the cluster.
2.2 Data reduction
Data reduction was done with the routines of the CIAO 2.2 software package following the threads on the CIAO webpages111see http://asc.harvard.edu/ciao/. First, the level-1 events file was processed with the task acis_process_events to make the following corrections: application of a new calibration file (geom.par, released in version 2.9 of the Calibration Database); removal of pixel randomization to improve the point spread function (randomly spreading event-positions within one pixel is part of standard data processing and is done to remove artificial patterns caused by the satellite dither; in the image of M 67, the pattern is blurred automatically because the exposure time spans many dither-cycles) and application of Pulse Height Amplitude randomization (blurring of the energy values assigned to events to avoid that a source’s spectrum shows discrete peaks). We refer to the CIAO threads for a more detailed description of these steps. A level-2 events file was then generated in which only events with grades 0, 2, 3, 4 and 6, and a status of 0 are preserved; “flaring pixels”, contaminated by cosmic-ray events, are filtered out in this step. An additional filter is applied that only preserves data taken during good time intervals. Finally, a correction is applied to the aspect solution provided by the standard data processing.
Three images were created by splitting the observation in a soft (0.32 keV), hard (27 keV) and total (0.37 keV) energy band. The images were cleaned to remove time intervals with background countrates that deviate more than from the mean value. As the CCDs have different characteristics, the cleaning was done for each chip separately. This leads to a reduction of the exposure time of %. Next, an exposure map was computed for each CCD in each energy band that represents the effective exposure of each position on the detector by taking into account spatial variations of the instrument’s effective area and the dither motion of the telescope.
2.3 Source detection
We used the wavdetect routine to detect sources in the unbinned images. For ACIS-I, the detection was done on scales (wavelet radii) ranging from 1 to 11.3 pixels, where scales are increased by factors of . For ACIS-S, that lies further from the aimpoint resulting in a larger point spread function, we used scales from 8 to 45.3 pixels. A small part of S 2 is excluded from the detection as, judging from the prominent square pattern, it appears to contain a bad pixel. The significance threshold for detection was set to a 10-6 probability per pixel for a spurious detection, corresponding to 1 false detection per ACIS CCD of pixels2. For some sources, wavdetect finds a very low number of background-corrected counts (21); we do not reject these sources as wavdetect is primarily designed for source detection and is known to underestimate the source counts in some cases (Freeman et al. 2002). We computed vignetting-corrected countrates by normalizing a source’s exposure to the exposure near the aimpoint.
The resulting source lists of the different energy bands were crosscorrelated by sky coordinates to create one master list, in which sources are indicated with the prefix ’CX’. We adopt an error on the position that is the quadratic sum of the 1- wavdetect errors, and a contribution that depends on the number of detected counts (following information on the Chandra webpages, we add 05 for sources with 20 counts or less, and 02 for sources with 100 counts or less and more than 20 counts). Sources are considered to be a matching pair when their positions agree within these errors. A first crosscorrelation results in a total of 193 sources. However, after inspecting this list, we find that several sources are separated by only 005–31. When increasing the wavdetect errors to 2 and 3 , and repeating the crosscorrelation, we find 20 and 8 extra matches with respect to the 1 and 2 cases, respectively. There remain two cases on ACIS-I in which sources lie close together and that we will treat as matches: a hard-band source with 12 counts that lies 09 from a total/soft-band pair (our final source CX 10), and a soft-band source with 4 counts that lies 14 from a total-band source (our final source CX 114). We note that CX 10 and CX 114 could also be blends of two different sources. There are five cases on ACIS-S, more than 12′ from the aimpoint, for which two sources of different energy bands are too far apart to be a match, but whose source regions (i.e. the region with three times the size of the standard deviation of the spatial distribution of source counts) for the most part overlap. As their separations are small relative to the sizes of the source regions, and as the uncertainty in Chandra positions may be underestimated for large off-axis angles, we still consider these detections as corresponding to the same X-ray source (CX 18, CX 34, CX 35, CX 44, CX 54). Our final master list contains 158 sources. Table 1 lists the properties of the sources, sorted on number of counts in the total band as derived by wavdetect. In the following, we use positions derived from the total-band image.
We now add some notes on individual sources. The source region of CX 54 includes the bad region on CCD S 2 that was excluded from the detection. We have not removed this source from our list, as a ROSAT source lies in the source region of the Chandra source. We stress that the properties of CX 54 are likely not well represented by the numbers given in Table 1. The source regions of CX 32 (detected in all three bands) and CX 45 (detected in soft and total band) overlap; possibly wavdetect separated what looks like the extended emission of the same source (the optical counterpart is an active galaxy, see Sect. 3.1) in two. Also the source regions of CX 71 (detected in total and soft band) and CX 149 (detected in hard band only) overlap; for this pair we only know that the optical counterpart is faint and blue (see Sect. 3.1).
To get an idea about the spurious detections in our list, we repeated the detection with the threshold set to a 10-7 probability per pixel for a spurious detection. The 26 sources that are not detected in this run of wavdetect but that are found with the threshold set to 10-6, are marked with an asterisk (∗) in Table 1.
| CX | counts | ctr | X | opt | ||||||
|---|---|---|---|---|---|---|---|---|---|---|
| (′) | (h,m,s) | (∘,′,″) | (c ks-1) | (″) | ||||||
| 1 | 3.19 | 8 51 13.373(2) | 11 51 40.23(2) | 892(30) | 20.5 | T | 0.450.03 | 8 | S 1063 | 0.27 |
| 2 | 3.78 | 8 51 38.456(1) | 11 49 06.28(3) | 872(30) | 21.5 | T | 0.360.03 | E 510 | 0.13 | |
| 3 | 3.93 | 8 51 20.798(2) | 11 53 26.40(3) | 619(25) | 14.3 | T | 0.370.04 | 4 | S 1082 | 0.23 |
| 4 | 7.23 | 8 50 57.104(8) | 11 46 07.57(8) | 513(24) | 14.5 | T | 0.650.04 | 15c | faint | 0.1 |
∗ Source is detected with the significance threshold set to
but not with the threshold set to
∗∗ All
positions are corrected for a systematic offset with respect to the
EIS optical positions which is 023 and 020. The errors on the positions that we
give here are the 1- wavdetect errors including the
corrections for small counts numbers. They are often much smaller than
the uncertainty in the absolute positions, i.e. than the uncertainty
in the offset values (03).
3 Crossidentification with optical and ROSAT sources
3.1 Optical identification
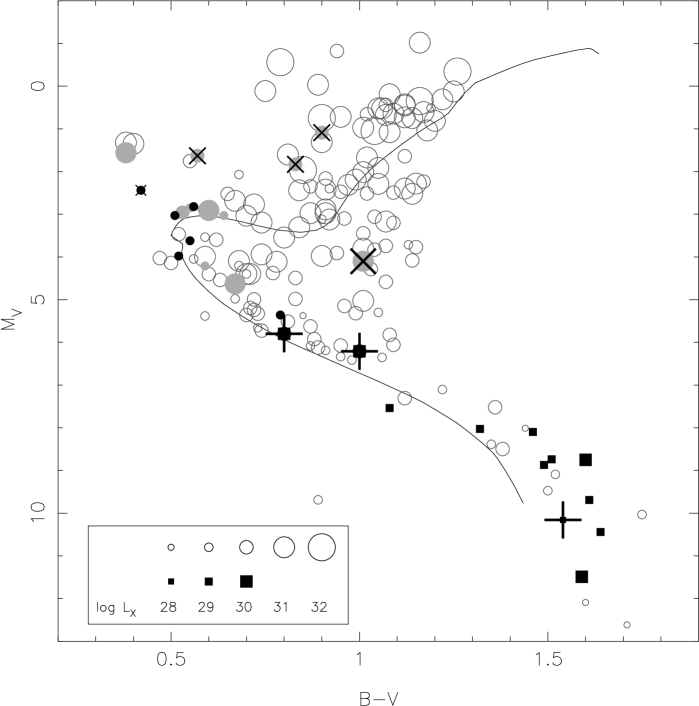
To look for optical counterparts of the Chandra sources, we crosscorrelated our source list against several optical catalogues. Our main reference for objects with is the catalogue from the ESO Imaging Survey (EIS, Momany et al. 2001). Before crosscorrelating the X-ray and optical lists, we had to correct for any systematic offset between the X-ray and the optical positions, which we have done iteratively. We started by overplotting the X-ray sources on the EIS image and thus identified by eye optical counterparts for the brightest sources. From the positions of twelve stars that were already considered to be X-ray sources from ROSAT and optical follow-up observations, we computed median offsets for right ascension and declination. After correcting the X-ray positions for these offsets, we correlated the X-ray and optical lists. When an X-ray and optical position match within the errors, the optical source is accepted as a counterpart. For the X-ray sources, we adopted the same errors (with the 1- wavdetect contributions) used to correlate the source lists of the three energy bands. We used the maximum internal error on the EIS position (1″, see Fig. 3 of Momany et al. (2001)) as the error on the optical positions. With the new, larger set of counterparts, we calculated a new offset between the X-ray and optical positions and again correlated the lists after applying the updated correction. This was repeated until no new counterparts are found. In this way, we have found 56 EIS optical counterparts. The positions in Table 1 are corrected for the final offsets: 023035 and 020033. The precision of the X-ray positions is limited by the uncertainty in these offsets. For ACIS-S sources, we possibly underestimated the positional errors, and therefore we repeated the crosscorrelation using 2- and 3- wavdetect errors. Since in five cases we associated soft- and total-band sources with a relatively large separation (see Sect. 2.3), the crosscorrelation was done for each energy band separately in order not to miss possible counterparts. We found four (three) extra counterparts with 2- (3-) errors. To look for extra counterparts, e.g. stars that are too bright to be included in the EIS list, we repeated the above steps with the catalogues of Montgomery et al. (1993), Girard et al. (1989), and Fan et al. (1996). We thus found five more counterparts. For each identification, the distance between the X-ray source and optical counterpart is given in Table 1, in which the notes indicate whether the counterpart was found using larger errors or the additional catalogues. Tables 2 and 3 summarize the properties of the counterparts, while Fig. 2 shows their positions in the M 67 colour-magnitude diagram. We use the photometry from EIS for stars with and from Montgomery et al. (1993) for the remaining stars, as the EIS magnitudes of bright stars can be affected by saturation effects.
All identifications were checked by eye. The errors on the X-ray positions are so small that we either find zero or one possible counterpart. A known QSO lies between CX 32 and CX 45, where their source regions overlap (see Sect. 2.3); we tentatively associate this QSO with both X-ray sources. Similarly, we tentatively match the faint blue counterpart of CX 71 with the nearby source CX 149 (see Sect. 2.3.) We indicated eight more optical sources as possible counterparts for X-ray sources on ACIS-I; they lie outside the errorboxes, but inside the X-ray source regions and only 1″–4″ from the X-ray sources. Possible counterparts are indicated in italics in Tables 2 and 3. Finally, we found fifteen possible counterparts by examining the EIS -image to look for faint optical sources that are not included in either catalogue. Their estimated positions are given in Table 4.

| CX | X | S | – | / | rem. | |||
| 1 | 8 | 1063 | 13.79 | 1.05 | 1.3 1031 | 18.40 | 0.21 | 1, SG |
| 3 | 4 | 1082 | 11.25 | 0.42 | 8.5 1030 | 1.07a | 2, BS | |
| 5 | 11 | 1019 | 14.32 | 0.71 | 6.0 1030 | 1.36 | 0 | 3 |
| 6 | 10 | 1040 | 11.52 | 0.87 | 3.3 1030 | 42.83 | 0 | 4, YS |
| 9 | 13 | 999 | 12.60 | 0.78 | 3.7 1030 | 10.06 | 0 | 4 |
| 10 | 7 | 1077 S | 12.60 | 0.64 | 3.9 1030 | 1.36a | 0.10 | 3 |
| 16 | 40 | 1282 | 13.33 | 0.56 | 1.5 1030 | 0.36 | 5, WU | |
| 19 | 45 | 1036 | 12.78 | 0.49 | 1.2 1030 | 0.44 | 8, WU | |
| 23 | 757 | 13.59 | 0.62 | 8.5 1029 | 0.36 | 9, WU | ||
| 24 | 37 | 1072 | 11.32 | 0.61 | 7.6 1029 | 1495 | 0.32 | 4, YS |
| 36 | 53 | 1234 S | 12.65 | 0.57 | 6.8 1029 | 4.36a | 4 | |
| 47 | 52 | 1237 | 10.78 | 0.94 | 5.5 1029 | 698 | 0.11 | 4, YS |
| 48 | 38 | 1070 | 13.90 | 0.63 | 3.1 1029 | 2.66 | 0 | 6 |
| 49 | 50 | 1242 | 12.72 | 0.68 | 2.9 1029 | 31.78 | 0.66 | 4 |
| 67 | 1203 | 14.44 | 0.77 | 3.6 1029 | bin. | |||
| 72 | 773 | 13.31 | 0.59 | 1.6 1029 | 5.7 | 3 | ||
| 78 | 1009 | 13.67 | 0.56 | 3.0 1029 | 5.95 | 0 | 6 | |
| 81 | 996 | 15.05 | 0.83 | 1.2 1029 | 6.7 | 3 | ||
| 88 | 41 | 1045 | 12.54 | 0.59 | 9.2 1028 | 7.65 | 0 | 4 |
| 94 | 1281 | 13.72 | 0.55 | 1.6 1029 | ||||
| 95 | 997 | 12.13 | 0.46 | 1.2 1029 | 4913 | 0.34 | 7, BS | |
| 104 | 41 | 1050 | 14.41 | 0.61 | 1.1 1029 | var | 3 | |
| 111 | 46 | 1024 S | 12.72 | 0.55 | 8.0 1028 | 7.16 | 0 | 4 |
| 155 | 1272 | 12.51 | 0.60 | 4.2 1028 | 11.02 | 0.26 | 4 | |
| 157 | 986 | 12.73 | 0.55 | 2.2 1028 | 10.34 | 0 | 4 | |
| 7 | 47 | 1601 | 14.44 | 0.80 | 0.48 | |||
| 15 | 17 | 972 | 15.49 | 0.84 | 0.27 | 1.17 | 0 | 3 |
| 17 | 42 | 1042 | 15.68 | 0.86 | 0. | |||
| 68 | 44 | 2214 S | 14.82 | 0.72 | 0. | |||
| 109 | 1466 | 10.60 | 0.34 | 0.21 | ||||
| 118 | 1013 | 11.55 | 0.41 | 0. |
refers to the inner orbit of a (possible) triple system.
1=Mathieu et al. (2003), 2=Goranskij et al. (1992),
3=preliminary solution (D. Latham, priv. comm.), 4=Mathieu et
al. (1990), 5=Kurochkin (1960), 6=Latham et al. (1992), 7= Latham &
Milone (1996), 8=Gilliland et al. (1991), 9=Stassun et al. (2002)
| CX | X | E | – | remarks | |
|---|---|---|---|---|---|
| 54 | 56? | 207 | 16.85 | 1.81 | near bad CCD-region |
| 58 | 763 | 15.90 | 1.04 | 9, =3.58 d; bin. | |
| 61 | 742 | 15.90 | 1.07 | 8, =0.27 d; WU | |
| 62 | 683 | 18.44 | 1.64 | ||
| 73 | 2650 | 21.18 | 1.63 | ||
| 76 | 1720 | 17.72 | 1.36 | 9, phot. variable, bin. | |
| 77 | 394 | 19.38 | 1.65 | bin. | |
| 80 | 2228 | 17.23 | 1.12 | ||
| 82 | 1208 | 18.56 | 1.53 | ||
| 117 | 542 | 20.13 | 1.68 | ||
| 129 | 556 | 17.79 | 1.50 | ||
| 141 | – | 19.85 | 1.58 | 8, =8.4 d; F 3925 | |
| 153 | 1178 | 18.43 | 1.55 | bin. | |
| 2 | 510 | 20.88 | 0.15 | ||
| 12 | 2024 | 22.50 | 0.12 | ||
| 13 | 14? | 2153 C | 21.21 | 0.36 | LB 6322 |
| 14 | 34 | 2823 C | 21.99 | 0.81 | |
| 20 | 43 | 2757 C | 20.98 | –0.055 | LB 6378, QSO |
| 21 | 49 | 2183 C | 21.86 | 0.27 | |
| 22 | 2756 | 22.12 | 1.20 | ||
| 26 | 55 | 2018 N | 21.52 | 0.15 | |
| 28 | 2297 | 22.37 | 1.21 | ||
| 30 | 210 | 20.05 | 0.54 | ||
| 31 | 48 | 2190 N | 22.38 | 0.34 | |
| 32/45 | 39 | 1268 | 20.07 | 0.23 | LB 3597, QSO |
| 33 | 600 | 20.74 | 0.18 | LB 6374 | |
| 34 | 2722 | 22.08 | 0.099 | ||
| 35 | 1929 | 21.92 | 0.85 | ||
| 37 | 3674 | 22.83 | – | ||
| 50 | 1939 | 21.14 | 0.36 | ||
| 53 | 24 | 362 C | 20.27 | 0.35 | LB 6316 |
| 55 | 2684 | 21.55 | 0.21 | LB 6364 | |
| 56 | 2050 | 22.14 | 0.021 | ||
| 57 | 16 | 2164 | 21.75 | 0.16 | 8, =2.1 h; CV |
| 64 | 2306 | 21.45 | 0.33 | ||
| 65 | 2307 | 22.60 | 0.82 | ||
| 70 | 2208 | 22.79 | 0.034 | ||
| 71 | 2807 | 21.42 | 0.58 | see also CX 149 | |
| 79 | 2310 | 21.82 | 0.22 | ||
| 86 | 2135 | 21.99 | 0.24 | ||
| 89 | 38 | 2270 | 21.91 | 0.51 | |
| 100 | 3668 | 22.81 | – | ||
| 127 | 3701 | 21.71 | – |
(continued on the right)
| CX | X | E | – | remarks | |
|---|---|---|---|---|---|
| 139 | – | 19.33b | – | F 4345 | |
| 149 | 2807 | 21.42 | 0.58 | see also CX 71 | |
| 152 | – | 18.45 | 1.02 | F 2776, LB 3596; QSO | |
| 158 | 3534 | 20.09 | – |
bmagnitude at 6075 Å.
3.2 Identification with ROSAT sources
Of the 59 ROSAT sources detected by Belloni et al. (1998), 24 lie outside the ACIS field of view. In what follows, we indicate ROSAT sources with an ’X’. Of the 35 sources in the ACIS field, 26 have one Chandra counterpart in or just outside ( 03) their 90% error circles, while for five we find two counterparts: X 38 (CX 48, CX 89), X 39 (CX 32, CX45), X 46 (CX 111, CX 112), X 53 (CX 36, CX 120; both near the border of the error circle), and X 41 (CX 88, and CX 104 just outside the error circle). Three possible identifications are X 56/CX 54, X 14/CX 13 and X 15/CX 4 for which the Chandra sources lie 2–4″ outside the ROSAT error circles. These (tentative) crossidentifications are included in Tables 1–4. The closest Chandra source to the remaining ROSAT source X 54 is CX 56, at a distance of 259 or 2.5 times the ROSAT error radius; we do not consider it a counterpart.
As Chandra’s spatial resolution is many times better than ROSAT’s, we can check if the optical identifications suggested by Belloni et al. (1998) still hold. In four cases we find a new counterpart (the deep EIS list was only recently published), in four cases we can distinguish between several suggested counterparts, and in five cases we find a different counterpart (see Tables 2–4). We exclude the identification of CX 11/X 51 with star 6441 from Montgomery et al. (1993) and of CX 44/X 58 with the probable non-member S 1414; we find no alternative counterparts. The number of corrected ROSAT identifications is in agreement with the estimated number of chance coincidences in Belloni et al. (1998).
3.3 Spurious identifications
We now estimate the probability that an X-ray source and an optical EIS-source are crossidentified by chance. This probability depends on the area (error box) around the X-ray source within which we search for counterparts, and on the surface density of optical sources. Since both the average errors on the X-ray positions () and the stellar surface density vary with distance from the aimpoint at the cluster centre, we make an estimate for ACIS-I (=044) and ACIS-S (=11) separately. We use a box with sides equal to twice the quadratic sum of and the error on the optical positions (1″), to compute the search area around an X-ray source. The number of EIS-sources inside ACIS-I and ACIS-S is 1264 and 472222Although the field where Chandra detected sources is contained within the EIS image, the S 2 and S 3 CCDs are not fully covered by the EIS image. Therefore, the number of 472 that we use here, is twice the number of optical sources within S 2, for which only 0.5′2 are outside the EIS field of view., respectively. Therefore, the probability that a randomly placed box includes an EIS-source is (2 11)2 for ACIS-I, and (2 15)2 for ACIS-S. We detected 140 X-ray sources on ACIS-I; thus we compute that for 140 trials, the probability to identify an X-ray source with 0, 1 or 2 EIS-sources by chance is 43, 36 and 15 %, respectively. The corresponding numbers for ACIS-S (18 sources) are 86, 13 and 0.9 %. In a similar way, we compute the probability for spurious identifications with proper-motion cluster members, and with proper-motion members that are known binaries. On ACIS-I, 230 stars have a membership probability %, while there are 48 cluster binaries (see Latham et al. (1992), Latham & Milone (1996), van den Berg et al. (2001), four contact binaries from Gilliland et al. (1991) and Stassun et al. (2002), and seven binaries with unpublished orbits (D. Latham, priv. comm.)). On ACIS-S, there are 14 stars with %, while there are no known binaries. The results are summarized in Table 5. From these numbers we conclude that probably all identifications with cluster binaries (see Table 2) are correct.
We also estimate the probability for a chance identification of a Chandra source with a ROSAT source. Using the average 90 % error radius of the ROSAT sources inside ACIS (116), we find that for one trial this probability is and on ACIS-I and ACIS-S, respectively. The probabilities for one or two chance superpositions on ACIS-I are relatively large (Table 5), so some of our 34 identifications are likely to be false.
| ACIS-I | ACIS-S | |||||
|---|---|---|---|---|---|---|
| 0 | 1 | 2 | 0 | 1 | 2 | |
| EIS | 0.43 | 0.36 | 0.15 | 0.86 | 0.13 | 9.4 10-3 |
| members | 0.86 | 0.13 | 0.010 | 0.996 | 4.4 10-3 | 9.4 10-6 |
| binaries | 0.97 | 0.031 | 4.9 10-4 | – | – | – |
| ROSAT | 0.17 | 0.30 | 0.27 | 0.91 | 0.082 | 3.5 10-3 |
4 Analyses
4.1 Spectral fits
To obtain more information about the nature of the X-rays, we have fitted the spectra of the ten brightest sources with more than 250 counts in the total energy band. We used the CIAO script psextract to create spectra from the level-2 events files, and to construct instrument response files. Data are grouped in bins containing at least 25 counts. The auxiliary response files are corrected for the continuous degradation since launch of the ACIS quantum efficiency at mainly low energies. This is done with the acisabs-model by Chartas & Getman (2002) for the time-dependent absorption due to molecular contaminants on ACIS. The spectral fitting is done with Sherpa, CIAO’s package for modeling and fitting data. Except for CX 7 on S 3 (a back-side illuminated CCD with a higher background countrate than the front-illuminated CCDs), the contribution from the background was ignored. Energies below 0.35 keV were excluded from the fits because of the large uncertainty in the ACIS gain at these energies.
4.1.1 Late-type stars
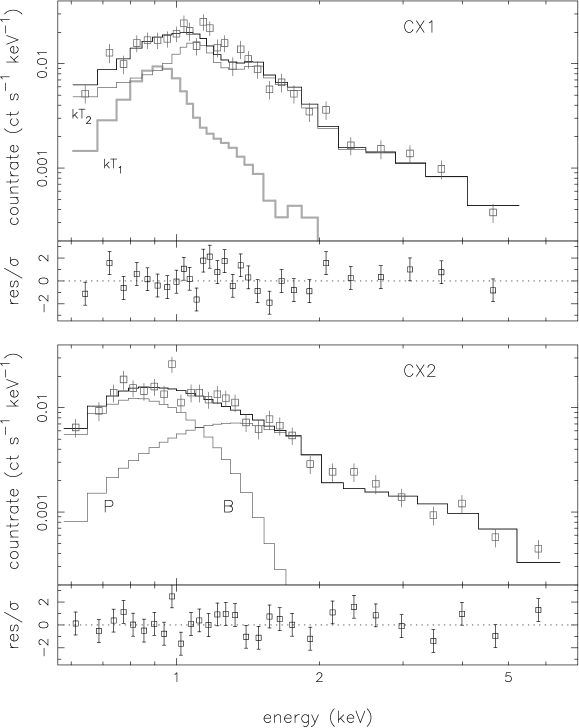
The counterparts of CX 1, CX 3, CX 5, CX 6, CX 7, CX 9 and CX 10 are late-type stars. All are cluster members and binaries, except CX 7 (S 1601) that has not been investigated for binarity and to which Girard et al. (1989) assigned a low probability for cluster membership ( %, see Table 2), although we note that Sanders (1977) found % for this star. We fitted the spectra of these sources with the xsmekal-model for emission by an optically thin gas in collisional equilibrium (Mewe et al. 1995), often used for the coronal X-ray emission of active late-type stars (see e.g. Dempsey et al. 1993b). We use the xswabs-model for photo-electric absorption to take into account extinction by neutral hydrogen. The reddening of M 67 () is converted into a neutral hydrogen column density cm-2 following Predehl & Schmitt (1995); is kept fixed in the fitting. For CX 7, the possible non-member, this is an upper limit. The total galactic extinction in the direction of M 67 is equal to the extinction of M 67; therefore, only when CX 7 is a foreground star, it can have an that is different (viz. lower) than the one adopted. For all sources, fits with one-temperature (1T) solar-abundance models gave results with the reduced chi-square . For the brightest sources CX 1 and CX 3, we tried to fit two-temperature (2T) models with solar abundance, and 1T models with variable abundance. While the former give acceptable fits () with a significant (99 %) improvement relative to the 1T solar-abundance models, the latter do not (). For consistency with the brighter sources, we also fitted the fainter sources with 2T solar-abundance models. Table 6 summarizes the results; for CX 7 the fit for is also included. The last-but-one column of the table gives a countrate-to-flux conversion factor that illustrates the intrinsic differences between the spectral models; it is computed by dividing the unabsorbed flux by the countrate (see Table 1). The top frame of Fig. 3 shows the best fit to CX 1.
We add a few remarks on the spectrum of CX 1 which is the binary S 1063 with an anomalous position in the M 67 colour-magnitude diagram, 1 mag below the giant branch (see Mathieu et al. (2003) for a detailed discussion). Mathieu et al. note that the colours of CX 1/S 1063 suggest that its reddening is about 5 times higher than the total reddening in the direction of M 67, in other words cm-2. We have looked for indications for such enhanced, intrinsic reddening in the spectrum of CX 1 by doing a fit in which the value of is allowed to float. We find that our data cannot sufficiently constrain ( cm-2; see Table 6 for the complete results) to draw any conclusions. As the countrate of CX 1 is variable (see Sect. 4.3 and Fig. 5), we also investigate the possibility of spectral changes by simultaneously fitting the spectra of the first nine and the last four hours. Fits for which the temperatures are fixed but for which can vary between the start and end of the observation, give bad results (, 24 degrees of freedom (d.o.f)). Fits for which is fixed to the M 67 value but for which can vary, give better results (, 24 d.o.f.; keV, keV, keV). In the remainder we use the results of the 2T fit of the single spectrum, with fixed to the value of M 67.
4.1.2 CX 2, CX 4 and CX 8
For CX 2, we only know that the optical counterpart is faint and blue. For CX 4 and CX 8 we found faint optical sources near the X-ray positions in the EIS image. We tried to fit the spectra of these sources with a power-law, a blackbody, and a 1T-MeKaL model, all multiplied with a variable . The power-law and 1T models gave the best results, but the temperatures in the latter models are not well constrained and are higher than expected for stellar coronal sources. The spectra of CX 2 and CX 4 show excess soft counts with respect to the fits, which could be modeled by adding a blackbody to the power-law and 1T components, or (for CX 2) by fitting a 2T model. An F-test indicates that the improvements with respect to the single-component models are more than 99 % significant for CX 2, and 97 % significant for CX 4. The normalizations of the blackbody-components for CX 4 are very uncertain. See Table 6 for a summary of the best fits, and the bottom frame of Fig. 3 for the power-law plus blackbody fit to CX 2.
| CX | mod | / | /dof | ||||||||
| 1 | 2T | 0.79 | 3.4 | 0.10 | – | – | – | – | 1.59 | 7.7 | 1.32/25 |
| 2T | 0.7 | 3.2 | 0.11 | – | – | – | 0.5 | 1.65 | 8.0 | 1.35/24 | |
| 3 | 2T | 0.86 | 3.2 | 0.19 | – | – | – | – | 1.06 | 7.4 | 0.74/17 |
| 5 | 2T | 0.86 | 2.8 | 0.25 | – | – | – | – | 0.75 | 7.4 | 0.48/10 |
| 6 | 2T | 0.6 | 1.7 | 0.52 | – | – | – | – | 0.41 | 6.4 | 0.77/5 |
| 7 | 2T | 0.25 | 1.09 | 0.39 | – | – | – | – | 0.32 | 4.7 | 0.71/10 |
| 2T | 0.81 | 2.3 | 0.43 | – | – | – | 0 | 0.35 | 5.1 | 0.69/10 | |
| 9 | 2T | 0.8 | 2.2 | 0.34 | – | – | – | – | 0.46 | 7.0 | 1.39/4 |
| 10 | 2T | 0.56 | 2.9 | 0.53 | – | – | – | – | 0.48 | 7.0 | 0.59/4 |
| 2 | B+P | – | – | – | 0.12 | 0.4 | 1.8 | 3 | 6.70 | 31 | 1.15/25 |
| 2T | 0.53 | 8 | 0.10 | – | – | – | 1.88 | 8.8 | 1.34/25 | ||
| 1T+B | 9 | – | – | 0.13 | 0.11 | – | 3 | 4.30 | 20 | 1.20/25 | |
| 4 | B+P | – | – | – | 0.11 | 3.8 | 1.7 | 10 | 33.3 | 230 | 0.97/15 |
| 1T+B | 7 | – | – | 0.11 | 2.4 | – | 10 | 25.2 | 174 | 1.04/15 | |
| 8 | P | – | – | – | – | – | 1.6 | 4 | 1.12 | 16 | 0.40/7 |
| 1T | 10 | – | – | – | – | – | 3 | 1.06 | 15 | 0.39/7 |
4.2 Hardness ratios and luminosities
For sources without enough counts for a spectral fit, we can obtain spectral information by comparing the number of counts in different energy bands. To this end, we compute a hardness ratio , with and the counts between 0.5–1 and 1–7 keV, respectively, inside the source regions of the detections in the total band. Sources with soft spectra have , while for hard sources . The counts are corrected for vignetting with exposure maps, and for background. For sources without counts between 0.5–1 keV, . If , is included in Table 1. Fig. 4 shows versus countrate in the total band. Arrows at indicate sources only detected in the soft band (0.3–2 keV); as this band partially includes the energy band used to estimate , we can still compute for these two sources. Known (non-)members of M 67, and stars near the faint main sequence are mostly found on the “soft” side of the diagram, while the active galaxies, the cataclysmic variable and sources with faint blue or without counterparts tend to be harder. To give some idea of what hardness ratios should be expected for different spectra, we compute for: power laws (often used to describe the emission of active galaxies, typically the photon index ); thermal bremsstrahlung and soft blackbodies (for the spectra of stellar X-ray sources like cataclysmic variables); MeKaL models (for coronal emission of active stars). We assume cm-2; for the power law, we also show the effect of enhanced reddening by internal extinction.
For the brightest M 67 members, unabsorbed X-ray luminosities (0.3–7 keV) are computed with the countrate-to-flux conversion factors of Table 6. We find that depends on : erg cm-2 s-1 per ct s-1. This result is based on the spectral fits for the coronal sources in M 67 (except CX 10); as these sources are relatively hard, extrapolation to softer spectra may give systematic errors. CX 10 deviates from this fit, possibly because it is a blend of two sources (see Sect. 2.3). For members for which we did not perform spectral fits with we use this relation to compute ; if , we use the average of members to compute a typical ( erg cm-2 s-1 per ct s-1). We assume a distance to M 67 of 820 pc; the results are included in Table 2.

4.3 X-ray variability
With the CIAO-task lightcurve, we created light curves in the soft, hard and total band to look for brightness variations of the X-ray sources within this 13-hour Chandra observation. Counts were binned into 1-hour time intervals. The background countrate is determined for each CCD separately from a region on the chip where no sources are detected. The resulting light curves are tested for variability using a -test. CX 1 (S 1063) and CX 3 (S 1082) are thus found to be variable: the probabilities that their countrates are constant, are 0.4 % in all energy bands. The light curves of the probable non-members CX 15 (S 972) and CX 17 (S 1042) have probabilities 4 % to be constant, in the total band. Their light curves are shown in Fig. 5; for comparison we also show the lightcurves of the bright non-variables CX 2 and CX 4. During the rise in countrate of CX 3, there appears to be a small increase in spectral hardness. averaged over the first nine hours is , while over the last four hours it is . The hardening of CX 1 is only marginally significant ( over the first nine hours while for the last four hours), while for CX 15 the hardness ratios at the one bright point and averaged over the rest of the observation are compatible ( and , respectively). The light curve of CX 17 shows no significant spectral changes.
The variations in the light curves of CX 3 and CX 15, and the spectral hardening observed for at least CX 3, resemble the behaviour of a flare. In RS CVn binaries, flares are frequently observed. The possible flares in CX 3 and CX 15 are poorly sampled; for CX 3, the rise time is 1–2 h, while the decay time could be 2 h or more. These values are not uncommon for RS CVns. Also the peak luminosities, and erg s-1 (versus “quiescent” luminosities of 5 1030 and 2 1030 erg s-1) of CX 3 and CX 15, respectively, are typical, see e.g. Franciosini et al. (2003).
The spectral fits of Sect. 4.1 suggest that the variability of CX 1 is caused by a rise in temperature. This is as expected for coronal sources for which a flux increase usually corresponds to an increase in temperature of the coronal plasma. It is not likely that a variation in causes the variability. In a point source, less absorption tends to soften the spectrum and, if anything, the spectrum of CX 1 at higher countrates is harder. It could be that the countrate/spectral variability of CX 1 is caused by a flare; flare rise times longer than the time span of this observation have been observed in RS CVn systems (Osten & Brown 1999). CX 1 also shows optical brightness variations that appear to be quasi-periodic on a period near 23 d (van den Berg et al., in prep.; van den Berg et al. 2002) that are however not yet understood. The observed full amplitude mag, which corresponds to a flux increase in of a factor 1.2. The variation observed in this Chandra observation is larger, viz. a factor 4 difference between the start and end of the observation. Since the optical variability is not periodic, and since no simultaneous optical and X-ray data are available, it is not possible to phase the X-ray and optical variations. CX 1 was also found to be variable between the two ROSAT observations by a factor 1.7 (Belloni et al. 1998).

5 Results
We now discuss individual X-ray sources in more detail. In Sect. 5.1, we estimate the number of background objects among our sources. Sect. 5.2 deals with sources already detected by ROSAT, while new sources are discussed in Sect. 5.3.
5.1 Background sources
We use the distribution of X-ray background sources as derived from the Chandra Deep Field South (Campana et al. 2001; Moretti et al. 2002) to estimate that, between 0.5–2 keV, we expect to detect 40 extragalactic sources within 8′ of the ACIS aimpoint (A. Moretti, priv. comm.). In the corresponding field, we actually detect 97 sources between 0.3–2 keV: 28 members and non-members, 9 sources near the lower main sequence, 24 faint blue sources, and 36 sources without counterparts in any of the catalogues searched. We expect that most background objects are in the last two groups; in fact, 3 faint blue sources are active galaxies and some faint counterparts of Table 4 look extended. Fig. 4 shows that most sources in these groups have relatively hard spectra as expected for active galaxies, although we cannot exclude that some are spectrally hard galactic sources. Similarly, the ratios of their X-ray and optical fluxes are consistent with those of active galaxies, white dwarfs or cataclysmic variables, and very active K or M dwarfs (see Fig. 6).

5.2 Known X-ray sources
Here we discuss known X-ray sources for which we can provide new information. Of the 25 cluster members detected by Belloni et al. (1998), sixteen were re-detected, and five were outside the ACIS field (S 628, S 364, S 1112, S 1113, and the hot white dwarf that was located between CCDs I 0 and I 2). In addition, CX 21/X 49, CX 20/X 43, CX 68/X 44 and CX 111/X 46, that were identified with the wide binary S 760, the single members S 1270 and S 775, and the member S 1027, are now identified with a faint blue source, with a galaxy, with the non-member S 2214 and with the member S 1024, respectively.
5.2.1 RS CVn binaries
All active circular binaries with d, and the active eccentric binary S 1242 (van den Berg et al. 1999), were re-detected by Chandra. Belloni et al. (1998) suggested that these sources are similar to the RS CVn binaries, and that their X-rays result from rapid rotation induced by strong tidal forces. Preliminary orbital periods of 1 d were recently derived for S 1019 (CX 5) and S 1077 (CX 10), which suggests they are also RS CVn binaries (D. Latham, priv. comm.). The spectral fits for S 999, S 1019 and S 1077 give temperatures similar to those typically found for field RS CVns using ROSAT (0.1–2.4 keV) data, viz. a hot and cool component of and 0.3 keV (Dempsey et al. 1993b). The low-energy cutoff of our data (0.35 keV) may explain the temperature difference of the cool components. We find a new counterpart for X 46/CX 111, viz. S 1024 with =7.2 d; the former counterpart was S 1027. S 1024 is a circular double-lined spectroscopic binary composed of two nearly identical stars of and that could both contribute to the X-rays (Mathieu et al. 1990).
5.2.2 Peculiar X-ray sources
Belloni et al. (1998) detected several bright members for which the X-ray emission is not well understood, viz. the blue and yellow stragglers S 1040 (a giant and a cool white dwarf), S 1072 and S 1237 with orbits that are too wide for strong tidal interaction; the blue straggler S 1082; and the eccentric binary S 1063 with a sub-subgiant that lies 1 mag below the giant branch.
With the results of Sects. 4.1 and 4.3 we can say more on the X-rays of three systems. The close binary that was recently spectroscopically identified in S 1082 (van den Berg et al. 2001) could be an RS CVn system and thus be the source of the X-ray emission. The X-ray spectrum, and the variability in the light curve, are indeed consistent with coronal activity. The spectra of S 1040 and S 1063, for which chromospheric activity features were found by van den Berg et al. (1999), can be fitted by coronal models as well. However, the nature of the variability of S 1063 remains unclear.
5.2.3 Non-members and possible members
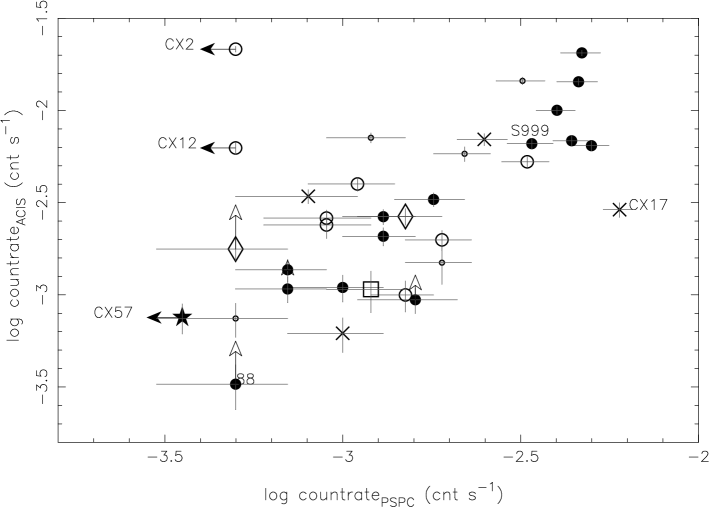
The probable non-members S 972 (CX 15), S 1042 (CX 17) and S 1601 (CX 7) were re-detected. Belloni et al. (1998) considered the brighter of two possible counterparts for X 44/CX 48 (the single member S 775) as the most probable counterpart. We now find that the other star, S 2214, is the X-ray source. Probably, these late-type stars are coronal sources: the spectrum of S 1601 can be well fitted with a MeKaL model, and the hardness ratios of the other three are consistent with coronal emission. S 972 was recently found to have d (D. Latham priv. comm.), and is thus an RS CVn system. The light curves of S 972 and S 1042 show indications of variability (see Sect. 4.3), possibly due to flares. S 1042 was also found to be variable by Belloni et al. (1998). Fig. 7, that compares PSPC (0.4–2.4 keV) and ACIS (0.3–7 keV) countrates of sources detected by both instruments, suggests that it also changed brightness between the present and the ROSAT observations.
5.2.4 The cataclysmic variable EU Cnc
The cataclysmic variable EU Cnc (CX 57) was detected by ROSAT only below 0.4 keV. From Fig. 7 (in which CX 57 is plotted below the PSPC detection limit at (countrate) = for clarity), we indeed estimate that its Chandra countrate corresponds to an expected PSPC countrate between 0.4–2.4 keV near the detection limit. We find a relatively high hardness ratio. The combination of a hard and soft spectral component is often seen in cataclysmic variables where the white dwarf has a high magnetic field (i.e. polars), as is probably the case in EU Cnc; the hard X-rays are believed to come from shocks in the accretion stream while the soft X-rays come from the heated surface of the white dwarf (for references, see Kuulkers et al. 2003). We refer to Belloni et al. (1998) for more details on EU Cnc. Assuming a thermal-bremstrahlung model, we estimate that erg s-1 (0.3–7 keV).
5.3 New X-ray sources
Of the 25 proper-motion cluster members detected by Chandra, ten are new sources that are discussed in Sects. 5.3.1 to 5.3.4. We discuss sources that we suspect to be close active binaries in M 67 in Sect. 5.3.5, a new bright and variable source in Sect. 5.3.6, and probable non-members in Sect. 5.3.7.
5.3.1 The contact binaries S 757 and ET Cnc
With the detection of S 757 (CX 23) and ET Cnc (CX 61) all four known contact binaries in M 67 are now detected in X-rays. While S 757 is a proper-motion cluster member, no proper motion has been measured for the faint system ET Cnc. If it is located at the distance of M 67, it lies on the -colour-period relation for contact binaries and therefore it probably belongs to the cluster (Rucinski 1998). The X-rays of contact binaries are believed to result from coronal activity around the rapidly rotating stars in the binary. Fig. 8 shows that of the systems in M 67 is comparable to that of other contact binaries of similar colours, i.e. several times lower than the maximum X-ray emission () of active single or detached binary stars (see Stȩpień et al. 2001).

5.3.2 RS CVn binaries
Five new sources are identified with binaries in M 67 with d. The circular orbits of S 1009 (CX 78) and S 986 (CX 157) indicate that tidal interaction is taking place; the X-rays are then expected to be due to rapid synchronous rotation. S 1009 ( d) lies 1 mag below the main-sequence turnoff (Latham et al. 1992). S 986 ( d) is also a spectroscopic binary near the turnoff (Mathieu et al. 1990), that shows eclipses (Sandquist & Shetrone 2003). The secondary hardly contributes to the optical flux, but Sandquist & Shetrone (2003) recently discovered a third component in the spectrum; it is not clear whether this star is physically bound to the binary. Their decomposition puts the primary to the blue of the turnoff, which makes it a possible blue straggler. S 1272 (CX 155) is an eccentric binary () with a primary that just left the main sequence (Mathieu et al. 1990). Possibly, tidal interaction started when the primary began to expand, and since synchronization is achieved before circularization, the primary could already be spun up (the pseudo-synchronous rotation period is 7.9 d (Hut 1981)). S 996 (CX 91) and S 773 (CX 72) have preliminary orbital periods of 6.7 and 5.7 d, respectively, (D. Latham, priv. comm.) which suggest they are RS CVn binaries, too. As S 996 was considered as a possible counterpart of X 16 (CX 57/EU Cnc), Pasquini & Belloni (1998) took low-resolution optical spectra of this star, but no activity features were found.
While our active binaries show a spectral hardening with increasing brightness (Fig. 4), X-ray sources in the Pleiades (a 100 Myr open cluster) show an inverse trend. In the Pleiades, this effect is mainly due to the early spectral types of the X-ray brightest members, whose soft X-rays may be different in nature (Daniel et al. 2002). If we disregard these early-type sources, no strong dependence of countrate and hardness ratio is seen in the Pleiades.
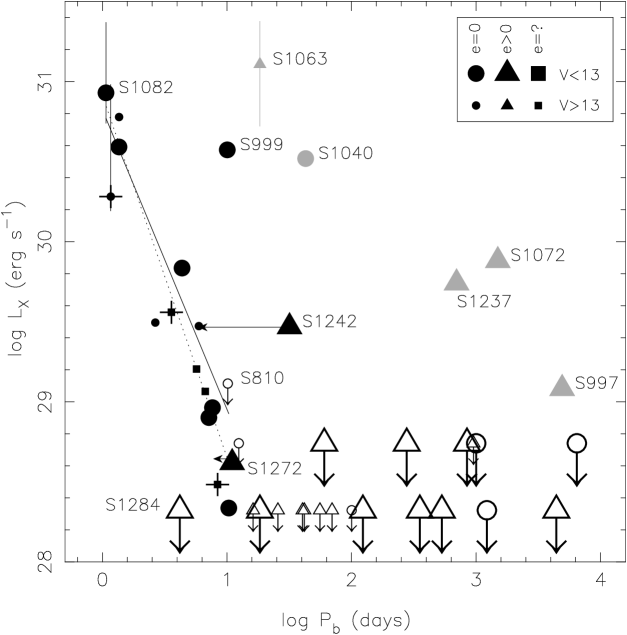
Fig. 9 shows the X-ray luminosities of all binaries in M 67 versus orbital period; arrows indicate the pseudo-synchronous rotation periods of S 1242 and S 1272 (note that the object near the arrowhead of S 1242 is S 1009). When studying activity-rotation relations, is often normalized to the bolometric luminosity. Since in some of our binaries and triples more than one star contribute to the X-ray and/or optical flux, we make no attempt to do this to avoid introducing errors. However, in Fig. 9 we do indicate whether a system is brighter or fainter than the main-sequence turnoff around .
Unlike Dempsey et al. (1993a, 1997) and Pallavicini et al. (1981) who found no correlation between and of active binaries using Einstein and ROSAT All Sky Survey data, respectively, our data suggest a decrease of with increasing for periods 12 d for which we expect that the rotation period equals the orbital period333A linear fit including the confirmed M 67 members but excluding the peculiar systems of Sects. 5.2.2 and 5.3.3, and assuming =50 %, gives and a correlation coefficient of –0.75; for S 1242 and S 1272, we assumed pseudo-synchronous rotation. If we exclude S 999 and use the quiescent of S 1082, we find and a correlation coefficient of –0.95. We note that this relation is similar to the relation found for single late-type stars by Pallavicini et al. (1981).. The difference may be due to the fact that our sample is homogeneous in age: old enough that all binaries out to 12 d are synchronous, and that no stars are rotating rapidly without tidal interaction. Dempsey et al. (1993a, 1997) emphasize that their sample of almost 200 active binaries, taken from the Catalogue of Active Binaries (Strassmeier et al. 1993), is not necessarily homogeneous but instead also contains systems that may not be true RS CVns.
We note that S 999 is considerably above the observed general trend, being 100 times brighter than S 986, which has similar photometric and orbital properties. Since Fig. 7 suggests no large variation in the countrate of S 999, a flare may not explain the relatively high luminosity.
5.3.3 The eccentric long-period blue straggler S 997
S 997 (CX 95) is a blue straggler in an eccentric orbit of 4913 d. The primary has K and km s-1 (Latham & Milone 1996; Shetrone & Sandquist 2000). In normal late-type stars the combination of X-ray activity and such a high is not unusual, but other M 67 blue stragglers with similar and km s-1 (S 975, S 1195) are not detected in X-rays. The eccentric orbit suggests that no strong tidal interaction is taking place; moreover, the orbit is too wide for rapid synchronous rotation of a possible late-type secondary. Like for the other detected blue and yellow stragglers with wide eccentric orbits (S 1072, S 1237), we do not understand the X-rays of S 997. Possibly, like S 1082, it contains a close binary that so far went undetected because it is faint or has spectral lines that are broadened by rotation.
5.3.4 Other members
S 1281 (CX 94) shows no radial-velocity variations in six observations spanning 3923 days (D. Latham, priv. comm.). This star is marked as a possible blue straggler by Sandquist (2003). S 1050 (CX 104) shows radial-velocity variations that suggest an orbital period longer than 12 d (D. Latham, priv. comm.). If both stars are indeed single or long-period binaries, their X-rays are still unexplained.
S 1203 (CX 67) has never been investigated for binarity. It lies somewhat above the main sequence, and could be a photometric binary (Montgomery et al. 1993).
5.3.5 Sources near the main sequence
The optical counterparts of twelve new sources lie near the lower end of the M 67 main sequence. These sources likely belong to M 67; large contamination from foreground or background stars is not expected since M 67 has a high galactic latitude (). The hardness ratios of many are compatible with coronal emission (see Fig. 4). Fig. 10, which is an extended version of Fig. 4 in Belloni et al. (1998), shows that if these sources are cluster members, their X-ray luminosities are comparable to those of field active binaries with late-type main-sequence primaries. The counterparts are too faint to be included in proper-motion or radial-velocity studies, but for some we have additional photometric information. CX 58 is a star on the binary sequence, for which Stassun et al. (2002) derive a photometric period of d (their star 2703). CX 141 is EY Cnc with d (Gilliland et al. 1991). We suggest that these stars are active binaries in which spots on the surface of the active star cause the brightness variations. In that picture, the photometric period is the rotation period, which for synchronous rotation equals the orbital period. Other stars that Montgomery et al. (1993) note to be on the binary sequence are CX 76, CX 77 and CX 153. CX 76 shows brightness variations, but no period was found (Stassun et al. 2002, their star 3348).
5.3.6 The bright new source CX 2/E 510
CX 2 is a new bright source with a faint () blue optical counterpart, source 510 in the EIS list. It is not clear whether E 510 belongs to M 67, or is instead a background star or galaxy. From Fig. 7 we estimate that Chandra sources with a countrate comparable to that of CX 2 would have been easily detected by ROSAT. We conclude that CX 2 must have brightened at least an order of magnitude since the time when the ROSAT observations were taken (1991, 1993). The spectrum of CX 2 has a hard and soft component; the is higher than the value for M 67 and is therefore likely to be intrinsic. Like EU Cnc (CX 57) it could be a magnetic cataclysmic variable. If CX 2 belongs to M 67, we find erg s-1 (0.3–7 keV) which is inside the observed range for cataclysmic variables. However, we find a blackbody temperature (120 eV) that is on the high side for polars, that have typical soft components of 30–100 eV. The ratio of the typical size of the X-ray emission area and the distance, as derived from the normalization of the blackbody, is 6.0 10-17, which for the distance of M 67 is quite small ( km) for a white dwarf. To check if CX 2 could be a binary in M 67 with a neutron star or a black hole, we compare its X-ray luminosity with those of low-mass X-ray binaries in quiescence. These sources are believed to emit X-rays due to thermal emission from the cooling neutron star surface and/or due to low-level accretion from a low-mass secondary. Garcia et al. (2001) give normalized to the Eddington luminosity , for both neutron-star and black-hole systems. For CX 2, we find assuming CX 2 contains a 1.4 neutron star, and assuming a 7 black hole; the upper limits from the ROSAT detection are ten times lower. Comparison with Fig. 1 from Garcia et al. (2001) shows that these luminosity ranges are in agreement with systems containing a black hole, while all neutron-star systems but one (the milli-second pulsar SAX J1808-365) are brighter. The X-ray spectra of quiescent black-hole low-mass X-ray binaries can be well fitted by power laws with (Kong et al. 2002), but excess soft emission as we find for CX 2 is not reported in the (mostly faint with counts) Chandra spectra fitted by Kong et al. (2002). If CX 2 lies beyond M 67, increases accordingly allowing the possibility of a neutron-star system. Note that, in either case, the luminosity variation between the ROSAT and Chandra observations also needs to be explained. Clearly, more information is needed to establish the nature of this system.
We note that we detected CX 2 in archival XMM-Newton observations taken on 2001 October 21, almost five months after our Chandra observation. Preliminary analysis of the EPIC-pn spectrum (200 source counts) shows that its flux has decreased to about 75% of the flux level during the Chandra observations. Here we assumed the parameters of the best-fit spectrum in Table 6.
Another possible variable source with a faint counterpart is CX 12, that has a hard spectrum (see Fig. 7).
5.3.7 Probable non-members
CX 109 and CX 118 are the probable non-members S 1466 and S 1013, respectively, whose photometry places them among the blue stragglers of M 67. A deviant proper motion could be due to a close encounter that created a blue straggler, as suggested for S 1466 by Landsman et al. 1998. If they are foreground dwarfs, 1–2 1028 erg s-1; if they are background giants, 2–4 erg s-1. This is inside the observed range for early-F dwarfs/giants (Schmitt 1997; Maggio et al. 1990). Neither star has been investigated for binarity. S 1466 was also detected in ultraviolet by Landsman et al. (1998); its 1520 Å– colour suggests it is an A 8 star (W. Landsman, priv. comm.), only slightly hotter than the F 0-type derived from its .
6 Summary and conclusions
We detected 25 cluster members, including ten new sources. Most of these members are binaries, which is not unexpected as old single stars are faint in X-rays. Almost all binaries with 12 d in the ACIS field of view are detected (Fig. 9); their X-ray luminosities decrease with increasing orbital period. For detached binaries with main-sequence or subgiant primaries, this period corresponds to the period where the transition from circularized to eccentric orbits occurs in M 67 ( d, Latham et al. 1992). The detection of most binaries with is therefore consistent with the explanation of their X-rays: the activity is enhanced by rapid synchronous rotation. Two binaries with are not detected. For S 810 (=10.2 d) this could be due to the high upper limit for . S 1284 (=4.2 d) is a binary of a late-A blue straggler while the lower limit on the secondary mass is compatible with a white dwarf and a late-type dwarf (Milone & Latham 1992). The eccentric orbit () indicates that strong tidal interaction is not taking place.
Surprisingly, we detected one cluster member, S 1281, that shows no radial-velocity variations. Also the detection of the systems with d, in which strong tidal interaction is not expected, remains a mystery. Our spectral fits indicate that the X-rays of the sub-subgiant S 1063 and the giant plus white dwarf S 1040, are coronal.
The twelve X-ray sources near the main sequence are candidates for being close binaries, but their membership and binary status should be established by spectroscopy. We also detected a group of sources with optically faint blue counterparts, including a new bright source that must have brightened at least ten times since the time of the ROSAT observations. While we expect that most of them are background sources, some could be interacting binaries in M 67.
Acknowledgements.
We thank D. Latham for sharing unpublished results of the M 67 radial-velocity study carried out by D. Latham, A. Milone, and R.D. Mathieu. We also wish to thank A. Moretti for assistance with the data reduction and the discussion of Sect. 5.1; and J. Homan for discussions on Sect. 5.3.6 and for the analysis of XMM-Newton data. MvdB acknowledges financial support from the Italian Space Agency and MIUR.References
- Belloni & Tagliaferri (1997) Belloni, T. & Tagliaferri, G. 1997, A&A, 326, 608
- Belloni & Tagliaferri (1998) —. 1998, A&A, 335, 517
- Belloni & Verbunt (1996) Belloni, T. & Verbunt, F. 1996, A&A, 305, 806
- Belloni et al. (1998) Belloni, T., Verbunt, F., & Mathieu, R. D. 1998, A&A, 339, 431
- Belloni et al. (1993) Belloni, T., Verbunt, F., & Schmitt, J. H. M. M. 1993, A&A, 269, 175
- Campana et al. (2001) Campana, S., Moretti, A., Lazzati, D., & Tagliaferri, G. 2001, ApJ, 560, L19
- Chartas & Getman (2002) Chartas, G. & Getman, K. 2002, http:// www.astro.psu.edu/users/chartas/xcontdir/xcont.html
- Daniel et al. (2002) Daniel, K. J., Linsky, J. L., & Gagné, M. 2002, ApJ, 578, 486
- Dempsey et al. (1993a) Dempsey, R. C., Linsky, J. L., Fleming, T. A., & Schmitt, J. H. M. M. 1993a, ApJS, 86, 599
- Dempsey et al. (1997) —. 1997, ApJ, 478, 358
- Dempsey et al. (1993b) Dempsey, R. C., Linsky, J. L., Schmitt, J. H. M. M., & Fleming, T. A. 1993b, ApJ, 413, 333
- Fan et al. (1996) Fan, X., Burstein, D., Chen, J.-S., et al. 1996, AJ, 112, 628
- Franciosini et al. (2003) Franciosini, E., Pallavicini, R., & Tagliaferri, G. 2003, A&A, 399, 279
- Freeman et al. (2002) Freeman, P. E., Kashyap, V., Rosner, R., & Lamb, D. Q. 2002, ApJS, 138, 185
- Garcia et al. (2001) Garcia, M. R., McClintock, J. E., Narayan, R., et al. 2001, ApJ, 553, L47
- Gilliland et al. (1991) Gilliland, R. L., Brown, T. M., Duncan, D. K., et al. 1991, AJ, 101, 541
- Girard et al. (1989) Girard, T. M., Grundy, W. M., López, C. E., & van Altena, W. F. 1989, AJ, 98, 227
- Goranskij et al. (1992) Goranskij, V. P., Kusakin, A. V., Mironov, A. V., Moshkaljov, V. G., & Pastukhova, E. N. 1992, Astron. Astrophys. Trans., 2, 201
- Hut (1981) Hut, P. 1981, A&A, 99, 126
- Hut et al. (1992) Hut, P., McMillan, S., Goodman, J., et al. 1992, PASP, 104, 981
- Kong et al. (2002) Kong, A. K. H., McClintock, J. E., Garcia, M. R., Murray, S. S., & Barret, D. 2002, ApJ, 570, 277
- Krautter et al. (1999) Krautter, J., Zickgraf, F.-J., Appenzeller, I., et al. 1999, A&A, 350, 743
- Kurochkin (1960) Kurochkin, N. E. 1960, Astron. Circular USSR, 212, 9
- Kuulkers et al. (2003) Kuulkers, E., Norton, A., Schwope, A., & Warner, B. 2003, Compact stellar X-Ray Sources, to appear in: X-rays from Cataclysmic Variables, ed. W H G Lewin & M van der Klis (Cambridge University Press), (astro-ph/0302351)
- Landsman et al. (1998) Landsman, W., Bohlin, R. C., Neff, S. G., et al. 1998, AJ, 116, 789
- Latham et al. (1992) Latham, D. W., Mathieu, R. D., Milone, A. A. E., & Davis, R. J. 1992, in Binaries as tracers of stellar formation, ed. A. Duquennoy & M. Mayor (Cambridge: Cambridge University Press), 132
- Latham & Milone (1996) Latham, D. W. & Milone, A. A. E. 1996, in The origins, evolution, and destinies of binary stars in clusters (ASP Conf. Ser. 90), ed. E. Milone & J.-C. Mermilliod, 385
- Luyten (1961) Luyten, W. J. 1961, in The Observatory, Univ. Minnesota, Minneapolis,1953, 23, 1
- Luyten (1963) Luyten, W. J. 1963, in The Observatory, Univ. Minnesota, Minneapolis, 1953, 32, 1
- Maggio et al. (1990) Maggio, A., Vaiana, G. S., Haisch, B. M., et al. 1990, ApJ, 348, 253
- Mathieu et al. (1990) Mathieu, R. D., Latham, D. W., & Griffin, R. F. 1990, AJ, 100, 1859
- Mathieu et al. (2003) Mathieu, R. D., van den Berg, M., Torres, G., et al. 2003, AJ, 125, 246
- Mewe et al. (1995) Mewe, R., Kaastra, J. S., & Liedahl, D. A. 1995, Legacy, 6, 16
- Milone & Latham (1992) Milone, A. A. E. & Latham, D. W. 1992, in Evolutionary processes in interacting binary stars, ed. Y. Kondo, R. F. Sistero, & R. S. Polidan (Kluwer Academic Publishers), 475
- Momany et al. (2001) Momany, Y., Vandame, B., Zaggia, S., et al. 2001, A&A, 379, 436
- Montgomery et al. (1993) Montgomery, K. A., Marschall, L. A., & Janes, K. A. 1993, AJ, 106, 181
- Moretti et al. (2002) Moretti, A., Lazzati, D., Campana, S., & Tagliaferri, G. 2002, ApJ, 570, 502
- Osten & Brown (1999) Osten, R. A. & Brown, A. 1999, ApJ, 515, 746
- Pallavicini et al. (1981) Pallavicini, R., Golub, L., Rosner, R., et al. 1981, ApJ, 248, 279
- Pasquini & Belloni (1998) Pasquini, L. & Belloni, T. 1998, A&A, 336, 902
- Pols et al. (1998) Pols, O. R., Schröder, K.-P., Hurley, J. R., Tout, C. A., & Eggleton, P. P. 1998, MNRAS, 298, 525
- Predehl & Schmitt (1995) Predehl, P. & Schmitt, J. H. M. M. 1995, A&A, 293, 889
- Randich (1997) Randich, S. 1997, in Cool stars in clusters and associations: magnetic activity and age indicators, ed. G. Micela, R. Pallavicini, & S. Sciortino, Vol. 68, 971
- Rucinski (1998) Rucinski, S. M. 1998, AJ, 116, 2998
- Sanders (1977) Sanders, W. L. 1977, A&AS, 27, 89
- Sandquist (2003) Sandquist, E. L. 2003, MNRAS, in press (astro-ph/0308547)
- Sandquist & Shetrone (2003) Sandquist, E. L. & Shetrone, M. D. 2003, AJ, in press (astro-ph/0308362)
- Sarajedini et al. (1999) Sarajedini, A., von Hippel, T., Kozhurina-Platais, V., & Demarque, P. 1999, AJ, 118, 2894
- Schmitt (1997) Schmitt, J. H. M. M. 1997, A&A, 318, 215
- Shetrone & Sandquist (2000) Shetrone, M. D. & Sandquist, E. L. 2000, AJ, 120, 1913
- Stassun et al. (2002) Stassun, K. G., van den Berg, M., Mathieu, R. D., & Verbunt, F. 2002, A&A, 382, 899
- Stȩpień et al. (2001) Stȩpień, K., Schmitt, J. H. M. M., & Voges, W. 2001, A&A, 370, 157
- Strassmeier et al. (1993) Strassmeier, K. G., Hall, D. S., Fekel, F. C., & Scheck, M. 1993, A&AS, 100, 173
- van den Berg et al. (2001) van den Berg, M., Orosz, J., Verbunt, F., & Stassun, K. 2001, A&A, 375, 375
- van den Berg et al. (2002) van den Berg, M., Stassun, K., & Verbunt, F. 2002, A&A, 888, 382
- van den Berg et al. (1999) van den Berg, M., Verbunt, F., & Mathieu, R. D. 1999, A&A, 347, 866
- Zhao et al. (1993) Zhao, J. L., Tian, K. P., Pan, R. S., He, Y. P., & Shi, H. M. 1993, A&AS, 100, 243
| CX | counts | ctr | X | opt | ||||||
|---|---|---|---|---|---|---|---|---|---|---|
| (′) | (h,m,s) | (∘,′,″) | (c ks-1) | (″) | ||||||
| 1 | 3.19 | 8 51 13.373(2) | 11 51 40.23(2) | 892(30) | 20.5 | T | 0.450.03 | 8 | S 1063 | 0.27 |
| 2 | 3.78 | 8 51 38.456(1) | 11 49 06.28(3) | 872(30) | 21.5 | T | 0.360.03 | E 510 | 0.13 | |
| 3 | 3.93 | 8 51 20.798(2) | 11 53 26.40(3) | 619(25) | 14.3 | T | 0.370.04 | 4 | S 1082 | 0.23 |
| 4 | 7.23 | 8 50 57.104(8) | 11 46 07.57(8) | 513(24) | 14.5 | T | 0.650.04 | 15c | faint | 0.1 |
| 5 | 1.10 | 8 51 23.303(1) | 11 48 26.92(2) | 446(21) | 10.0 | T | 0.310.05 | 11 | S 1019 | 0.22 |
| 6 | 0.32 | 8 51 23.794(2) | 11 49 49.56(3) | 286(17) | 6.4 | T | 0.130.07 | 10 | S 1040d | 0.07 |
| 7 | 13.20 | 8 52 16.88(3) | 11 48 32.1(5) | 282(21) | 7.0 | S | 0.200.09 | 47 | S 1601 | 0.61 |
| 8 | 5.95 | 8 51 27.129(7) | 11 55 24.97(9) | 279(17) | 7.1 | T | 0.840.04 | 32 | faint | 0.5 |
| 9 | 2.72 | 8 51 18.715(3) | 11 47 02.96(3) | 272(17) | 6.6 | T | 0.290.06 | 13 | S 999 | 0.10 |
| 10 | 5.22 | 8 51 07.217(5) | 11 53 02.22(6) | 250(16) | 6.9 | S | 0.030.07 | 7 | S 1077 | 0.59 |
| 11 | 12.78 | 8 52 13.78(4) | 11 46 26.0(6) | 231(21) | 5.8 | S | 0.290.10 | 51 | ||
| 12 | 8.18 | 8 51 28.40(1) | 11 41 28.2(2) | 225(16) | 6.3 | T | 0.630.06 | E 2024 | 0.51 | |
| 13 | 5.62 | 8 51 03.818(8) | 11 46 30.15(9) | 218(15) | 5.3 | T | 0.380.07 | 14c | E 2153 | 0.35 |
| 14 | 7.46 | 8 51 04.69(1) | 11 55 29.7(1) | 148(13) | 4.0 | T | 0.730.07 | 34 | E 2823 | 0.16 |
| 15 | 5.22 | 8 51 17.758(9) | 11 44 29.5(1) | 141(12) | 3.4 | T | 0.250.09 | 17 | S 972 | 0.27 |
| 16 | 3.88 | 8 51 37.888(4) | 11 50 57.31(6) | 140(12) | 3.3 | S | 0.050.10 | 40 | S 1282 | 0.21 |
| 17 | 3.72 | 8 51 08.006(4) | 11 49 56.29(5) | 125(11) | 2.9 | S | 0.170.10 | 42 | S 1042 | 0.53 |
| 18 | 15.74 | 8 52 25.11(5) | 11 45 21(1) | 122(18) | 3.3 | T | 0.100.24 | |||
| 19 | 1.24 | 8 51 28.170(3) | 11 49 27.76(4) | 116(11) | 2.7 | T | 0.100.11 | 45 | S 1036 | 0.20 |
| 20 | 6.59 | 8 51 49.99(1) | 11 49 52.9(2) | 106(11) | 2.7 | T | 0.660.09 | 43 | E 2757 | 0.40 |
| 21 | 7.66 | 8 50 52.72(2) | 11 47 43.7(2) | 103(11) | 2.6 | T | 0.450.10 | 49 | E 2183 | 0.66 |
| 22 | 5.65 | 8 51 46.16(1) | 11 49 50.3(3) | 92(10) | 2.3 | T | 0.560.10 | E 2756 | 0.64 | |
| 23 | 5.74 | 8 51 04.86(2) | 11 45 56.9(2) | 82(9) | 2.0 | S | 0.130.13 | S 757 | 0.23 | |
| 24 | 3.11 | 8 51 21.78(1) | 11 52 38.2(2) | 81(9) | 2.1 | S | 0.300.13 | 37 | S 1072d | 0.11 |
| 25 | 15.08 | 8 52 22.59(5) | 11 45 37.3(9) | 80(14) | 2.2 | T | 0.530.13 | |||
| 26 | 13.62 | 8 52 07.37(6) | 11 41 18(1) | 79(12) | 2.4 | S | 0.340.17 | 55 | E 2018g | 3.27 |
| 27 | 1.31 | 8 51 22.82(1) | 11 48 14.2(2) | 79(9) | 1.8 | T | 0.730.10 | |||
| 28 | 3.99 | 8 51 24.81(1) | 11 53 31.3(2) | 75(9) | 1.7 | T | 0.840.09 | E 2297 | 0.23 | |
| 29 | 2.19 | 8 51 30.58(1) | 11 50 44.8(1) | 71(8) | 1.6 | T | 0.660.12 | |||
| 30 | 17.87 | 8 52 27.72(7) | 11 41 14(1) | 66(14) | 2.2 | S | 0.800.15 | E 210f | 2.76 | |
| 31 | 3.44 | 8 51 35.70(1) | 11 48 00.9(2) | 66(8) | 2.0 | T | 0.830.10 | 48 | E 2190 | 0.23 |
| 32 | 6.32 | 8 50 58.74(2) | 11 51 38.8(3) | 62(8) | 1.8 | T | 0.700.10 | 39 | E 1268h | 1.97 |
| 33 | 6.27 | 8 51 46.61(2) | 11 52 02.9(3) | 62(8) | 1.5 | T | 0.470.14 | E 600 | 0.21 | |
| 34 | 11.78 | 8 52 10.41(5) | 11 47 21.0(6) | 58(10) | 1.4 | S | 0.370.20 | E 2722f | 1.56 | |
| 35 | 14.59 | 8 51 53.18(6) | 11 36 56.8(9) | 56(10) | 1.9 | T | 0.750.12 | E 1929f | 2.22 | |
| 36 | 4.21 | 8 51 31.29(1) | 11 45 51.0(2) | 53(7) | 1.4 | S | 0.090.17 | 53 | S 1234 | 0.37 |
| 37 | 4.60 | 8 51 27.38(2) | 11 45 04.3(3) | 49(7) | 1.2 | S | 0.460.17 | E 3674 | 0.32 | |
| ∗38 | 17.76 | 8 52 22.09(8) | 11 39 12(1) | 49(13) | 1.7 | T | 0.760.22 | |||
| 39 | 3.66 | 8 51 08.95(2) | 11 50 43.5(2) | 48(7) | 1.1 | T | 0.960.09 | faint (extended) | 0.4 | |
| 40 | 5.76 | 8 51 36.20(2) | 11 44 46.0(3) | 47(7) | 1.2 | T | 0.740.13 | |||
| 41 | 2.01 | 8 51 28.90(1) | 11 48 07.4(2) | 47(7) | 1.2 | T | 0.800.13 | |||
| 42 | 5.41 | 8 51 30.30(2) | 11 54 39.7(3) | 47(7) | 1.1 | T | 0.630.15 | |||
| 43 | 8.09 | 8 51 55.81(2) | 11 50 44.5(4) | 47(7) | 1.2 | T | 0.650.15 | faint (extended) | 0.7 | |
| 44 | 16.16 | 8 52 05.80(6) | 11 37 13(1) | 46(11) | 1.5 | T | 0.310.26 | 58 | ||
| 45 | 6.26 | 8 50 58.97(2) | 11 51 37.4(3) | 45(7) | 1.3 | T | 0.670.11 | 39 | E 1268h | 1.86 |
| 46 | 7.30 | 8 50 53.29(2) | 11 49 43.5(4) | 42(7) | 1.1 | T | 0.550.16 | fainte | 1.2 | |
| 47 | 7.48 | 8 51 50.28(2) | 11 46 07.6(4) | 42(7) | 1.1 | S | 0.100.17 | 52 | S 1237d | 0.91 |
| 48 | 2.76 | 8 51 19.72(1) | 11 52 10.9(2) | 42(6) | 0.94 | S | 0.400.19 | 38 | S 1070 | 0.05 |
| 49 | 4.36 | 8 51 36.06(2) | 11 46 33.6(2) | 41(6) | 1.1 | S | 0.570.18 | 50 | S 1242 | 0.45 |
| 50 | 19.69 | 8 52 27.01(8) | 11 37 35(1) | 39(11) | 1.4 | S | 0.760.24 | E 1939g | 4.57 |
| CX | counts | ctr | X | opt | ||||||
|---|---|---|---|---|---|---|---|---|---|---|
| (′) | (h,m,s) | (∘,′,″) | (c ks-1) | (″) | ||||||
| 51 | 11.21 | 8 52 08.47(4) | 11 47 59.2(8) | 38(9) | 0.99 | T | 0.860.15 | |||
| 52 | 2.92 | 8 51 11.73(2) | 11 50 25.8(2) | 38(6) | 0.89 | T | 0.900.13 | |||
| 53 | 7.73 | 8 50 56.50(3) | 11 45 23.3(4) | 36(7) | 1.0 | T | 0.240.20 | 24 | E 362h | 2.27 |
| b54 | 15.51 | 8 52 16.86(8) | 11 41 21(1) | 35(9) | 1.1 | S | 0.030.24 | 56c | E 207f | 2.05 |
| 55 | 6.62 | 8 51 33.80(2) | 11 43 27.8(4) | 32(6) | 0.83 | S | 0.350.21 | E 2684 | 0.88 | |
| 56 | 8.47 | 8 51 04.60(4) | 11 42 23.7(5) | 31(6) | 0.81 | T | 0.480.24 | E 2050 | 0.47 | |
| 57 | 2.78 | 8 51 27.21(1) | 11 46 57.3(2) | 30(5) | 0.75 | T | 0.410.22 | 16 | E 2164 | 0.05 |
| 58 | 10.02 | 8 50 55.00(5) | 11 56 50.1(6) | 29(6) | 0.91 | S | 0.210.27 | E 763 | 0.44 | |
| 59 | 7.08 | 8 50 57.55(4) | 11 52 51.5(4) | 28(6) | 0.74 | T | 0.650.19 | 36 | ||
| 60 | 6.45 | 8 51 44.50(3) | 11 45 47.0(4) | 28(6) | 0.78 | T | 1.00 | |||
| 61 | 6.73 | 8 51 26.77(3) | 11 56 13.1(4) | 27(6) | 0.70 | S | 0.270.25 | E 742 | 0.83 | |
| 62 | 6.30 | 8 51 06.31(2) | 11 54 19.4(3) | 27(5) | 0.69 | S | 0.170.25 | E 683h | 1.47 | |
| 63 | 8.26 | 8 51 25.36(4) | 11 57 47.5(4) | 26(6) | 0.68 | T | 0.620.23 | faint | 0.6 | |
| 64 | 4.41 | 8 51 18.81(2) | 11 53 49.9(2) | 25(5) | 0.59 | T | 0.620.23 | E 2306 | 0.09 | |
| 65 | 4.43 | 8 51 20.86(2) | 11 53 56.4(3) | 24(5) | 0.56 | T | 0.840.21 | E 2307 | 0.19 | |
| 66 | 7.89 | 8 51 35.22(3) | 11 56 51.7(7) | 24(6) | 0.60 | T | 0.510.27 | |||
| 67 | 10.27 | 8 51 35.59(5) | 11 39 44.8(5) | 24(6) | 0.70 | S | 0.130.26 | S 1203h | 2.44 | |
| 68 | 5.28 | 8 51 01.55(2) | 11 49 27.5(2) | 24(5) | 0.62 | T | 0.790.25 | 44 | S 2214 | 0.80 |
| 69 | 3.40 | 8 51 09.39(2) | 11 49 02.1(2) | 24(5) | 0.54 | T | 0.280.26 | faint | 0.8 | |
| 70 | 5.17 | 8 51 44.05(2) | 11 48 49.7(3) | 23(5) | 0.56 | S | 0.610.24 | E 2208 | 0.81 | |
| 71 | 6.02 | 8 51 38.45(2) | 11 54 15.2(3) | 22(5) | 0.53 | S | 0.470.23 | E 2807 | 0.88 | |
| 72 | 5.16 | 8 51 02.12(4) | 11 49 01.3(6) | 20(5) | 0.50 | S | 0.430.33 | S 773 | 0.63 | |
| 73 | 10.73 | 8 51 43.13(6) | 11 40 00.1(8) | 19(5) | 0.57 | T | 0.770.27 | E 2650h | 3.71 | |
| 74 | 2.00 | 8 51 15.85(3) | 11 48 37.2(5) | 19(4) | 0.42 | T | 0.150.32 | faint | 0.2 | |
| 75 | 6.48 | 8 50 56.89(4) | 11 50 26.4(6) | 19(5) | 0.46 | T | 0.600.25 | |||
| 76 | 1.84 | 8 51 17.08(3) | 11 48 27.1(5) | 18(4) | 0.40 | S | 0.050.34 | E 1720 | 0.13 | |
| 77 | 4.25 | 8 51 32.67(4) | 11 45 59.9(5) | 18(4) | 0.42 | S | 0.060.34 | E 394 | 0.30 | |
| 78 | 1.89 | 8 51 19.21(3) | 11 47 54.9(5) | 16(4) | 0.74 | S | 0.190.37 | S 1009 | 0.08 | |
| 79 | 4.78 | 8 51 17.09(4) | 11 54 05.7(6) | 15(4) | 0.38 | T | 0.600.35 | E 2310 | 0.25 | |
| 80 | 12.16 | 8 52 12.80(6) | 11 49 49.6(9) | 15(6) | 0.36 | S | 0.110.40 | E 2228g | 2.74 | |
| 81 | 3.01 | 8 51 28.37(3) | 11 46 49.8(5) | 15(4) | 0.34 | T | 0.380.40 | S 996 | 0.10 | |
| 82 | 3.71 | 8 51 11.42(4) | 11 47 11.2(5) | 14(4) | 0.34 | T | 0.090.37 | E 1208 | 0.45 | |
| 83 | 4.54 | 8 51 05.41(4) | 11 48 10.7(5) | 14(4) | 0.34 | H | 1.00 | |||
| 84 | 4.52 | 8 51 40.80(3) | 11 48 13.5(5) | 14(4) | 0.35 | T | 0.880.29 | |||
| 85 | 6.68 | 8 51 09.77(5) | 11 43 43.5(8) | 14(4) | 0.35 | T | 0.790.34 | |||
| 86 | 7.15 | 8 50 58.72(5) | 11 45 36.7(7) | 14(4) | 0.36 | T | 0.920.31 | E 2135h | 2.74 | |
| 87 | 8.56 | 8 51 08.73(6) | 11 57 21.0(8) | 14(4) | 0.35 | T | 0.860.31 | |||
| 88 | 1.14 | 8 51 19.05(4) | 11 50 05.7(5) | 14(4) | 0.33 | S | 0.550.39 | 41 | S 1045 | 0.27 |
| 89 | 2.63 | 8 51 21.67(4) | 11 52 09.0(5) | 14(4) | 0.34 | T | 0.430.37 | 38 | E 2270 | 0.52 |
| 90 | 6.98 | 8 51 19.94(5) | 11 56 29.3(7) | 13(4) | 0.34 | T | 0.920.33 | |||
| 91 | 5.77 | 8 51 41.60(4) | 11 53 08.2(6) | 13(4) | 0.32 | T | 0.610.35 | |||
| 92 | 1.61 | 8 51 25.04(3) | 11 48 00.8(5) | 13(4) | 0.31 | T | 0.850.33 | |||
| ∗93 | 9.50 | 8 51 02.73(6) | 11 57 38.4(8) | 13(4) | 0.33 | T | 0.710.38 | |||
| 94 | 3.05 | 8 51 34.27(3) | 11 50 55.1(5) | 13(4) | 0.29 | T | 0.260.35 | S 1281 | 0.48 | |
| 95 | 2.65 | 8 51 19.94(3) | 11 47 00.8(5) | 12(3) | 0.27 | S | S 997 | 0.35 | ||
| 96 | 3.07 | 8 51 26.98(3) | 11 46 38.0(5) | 12(3) | 0.27 | T | ||||
| 97 | 4.96 | 8 51 35.79(4) | 11 53 24.9(5) | 11(3) | 0.28 | T | 0.670.39 | |||
| 98 | 4.94 | 8 51 11.06(4) | 11 45 35.3(5) | 11(3) | 0.26 | T | faint (extended) | 0.8 | ||
| 99 | 7.57 | 8 50 52.25(5) | 11 49 03.0(6) | 11(4) | 0.30 | T | 0.700.40 | |||
| 100 | 8.36 | 8 51 50.37(6) | 11 44 31.1(9) | 11(4) | 0.64 | T | E 3668 | 1.04 | ||
| 101 | 1.63 | 8 51 18.72(3) | 11 50 46.4(5) | 11(3) | 0.25 | T | ||||
| 102 | 3.56 | 8 51 28.42(3) | 11 52 52.1(5) | 11(3) | 0.25 | T | faint (extended) | 2.9 | ||
| 103 | 4.89 | 8 51 14.27(4) | 11 53 55.1(5) | 10(3) | 0.25 | T | 0.830.40 | |||
| 104 | 1.42 | 8 51 18.29(3) | 11 50 19.7(5) | 10(3) | 0.23 | S | 41 | S 1050 | 0.21 | |
| ∗105 | 8.77 | 8 51 46.20(4) | 11 42 50.2(8) | 10(4) | 0.26 | T | ||||
| 106 | 6.03 | 8 51 07.09(4) | 11 54 07.6(6) | 10(3) | 0.24 | T | ||||
| 107 | 5.34 | 8 51 29.91(4) | 11 44 28.3(6) | 9(3) | 0.25 | T | 0.830.40 | |||
| 108 | 5.67 | 8 51 25.99(4) | 11 43 55.4(6) | 9(3) | 0.23 | T | ||||
| 109 | 8.29 | 8 51 56.10(5) | 11 51 27.5(7) | 9(3) | 0.24 | S | S 1466 | 1.36 |
| CX | counts | ctr | X | opt | ||||||
|---|---|---|---|---|---|---|---|---|---|---|
| (′) | (h,m,s) | (∘,′,″) | (c ks-1) | (″) | ||||||
| 110 | 2.30 | 8 51 23.23(4) | 11 47 14.8(5) | 9(3) | 0.27 | T | ||||
| 111 | 0.72 | 8 51 22.95(3) | 11 48 50.0(5) | 8(3) | 0.18 | S | 46 | S 1024 | 0.32 | |
| 112 | 0.61 | 8 51 23.12(3) | 11 48 56.2(5) | 8(3) | 0.18 | H | 46 | |||
| 113 | 2.43 | 8 51 16.58(4) | 11 51 22.4(5) | 8(3) | 0.17 | T | ||||
| 114 | 3.75 | 8 51 20.79(4) | 11 45 50.4(5) | 8(3) | 0.21 | T | ||||
| 115 | 4.93 | 8 51 08.16(4) | 11 52 50.8(5) | 8(3) | 0.18 | T | ||||
| ∗116 | 7.26 | 8 51 52.03(5) | 11 51 10.6(6) | 7(3) | 0.19 | T | ||||
| 117 | 2.30 | 8 51 31.59(4) | 11 50 32.6(5) | 7(3) | 0.16 | S | E 542 | 0.13 | ||
| 118 | 3.98 | 8 51 07.85(4) | 11 48 09.8(5) | 7(3) | 0.16 | T | S 1013 | 0.27 | ||
| 119 | 3.79 | 8 51 28.45(4) | 11 53 06.6(5) | 7(3) | 0.16 | T | ||||
| 120 | 4.37 | 8 51 31.83(4) | 11 45 44.4(6) | 7(3) | 0.18 | T | 53 | faint | 0.6 | |
| 121 | 6.96 | 8 51 29.56(6) | 11 56 19.5(7) | 7(3) | 0.32 | S | ||||
| ∗122 | 8.43 | 8 50 49.04(5) | 11 48 16.5(7) | 7(3) | 0.18 | T | ||||
| ∗123 | 5.18 | 8 51 41.38(4) | 11 46 56.1(7) | 6(3) | 0.17 | T | ||||
| ∗124 | 8.61 | 8 51 53.94(4) | 11 53 42.2(6) | 6(3) | 0.16 | T | faint | 2.3 | ||
| ∗125 | 6.34 | 8 51 48.27(5) | 11 51 02.8(7) | 6(3) | 0.14 | T | ||||
| 126 | 4.23 | 8 51 25.92(4) | 11 53 43.3(5) | 6(2) | 0.24 | T | ||||
| 127 | 2.61 | 8 51 29.29(4) | 11 47 25.0(5) | 6(2) | 0.13 | S | E 3701 | 0.49 | ||
| 128 | 5.40 | 8 51 01.15(3) | 11 50 02.4(7) | 5(2) | 0.13 | T | ||||
| 129 | 5.13 | 8 51 43.09(4) | 11 51 05.4(7) | 5(2) | 0.14 | T | E 556h | 3.27 | ||
| ∗130 | 7.67 | 8 50 51.76(4) | 11 49 21.1(7) | 5(2) | 0.14 | T | ||||
| ∗131 | 1.14 | 8 51 24.30(4) | 11 50 39.1(5) | 5(2) | 0.11 | T | ||||
| 132 | 4.13 | 8 51 11.57(4) | 11 46 32.5(5) | 5(2) | 0.11 | T | ||||
| ∗133 | 3.57 | 8 51 37.38(4) | 11 50 17.0(5) | 5(2) | 0.11 | T | ||||
| 134 | 5.06 | 8 51 09.09(4) | 11 53 16.1(5) | 4(2) | 0.10 | T | ||||
| 135 | 6.86 | 8 51 35.73(4) | 11 43 25.7(5) | 4(2) | 0.11 | T | ||||
| ∗136 | 6.77 | 8 50 55.66(6) | 11 48 40.5(7) | 4(2) | 0.10 | H | faint | 0.2 | ||
| ∗137 | 3.77 | 8 51 15.83(4) | 11 46 13.7(5) | 4(2) | 0.26 | T | ||||
| ∗138 | 2.93 | 8 51 11.24(4) | 11 49 09.1(5) | 4(2) | 0.09 | T | ||||
| ∗139 | 6.69 | 8 51 50.33(5) | 11 48 55.9(7) | 4(2) | 0.09 | T | F 4345d | 0.61 | ||
| 140 | 5.52 | 8 51 03.11(4) | 11 46 59.5(5) | 4(2) | 0.08 | H | ||||
| 141 | 3.11 | 8 51 35.19(3) | 11 50 31.8(5) | 3(2) | 0.07 | S | F 3925d | 0.59 | ||
| ∗142 | 1.78 | 8 51 15.89(3) | 11 49 23.3(5) | 3(2) | 0.06 | T | ||||
| 143 | 1.93 | 8 51 24.93(3) | 11 47 40.5(5) | 3(2) | 0.07 | T | ||||
| 144 | 2.68 | 8 51 23.17(4) | 11 46 52.3(5) | 3(2) | 0.07 | T | ||||
| ∗145 | 3.14 | 8 51 12.88(4) | 11 47 39.5(5) | 3(2) | 0.07 | T | faint | 1.0 | ||
| 146 | 15.94 | 8 52 28.02(6) | 11 50 55(1) | 40(10)a | 0.87 | S | 0.640.19 | |||
| ∗147 | 13.88 | 8 52 18.22(7) | 11 46 15(1) | 27(8)a | 0.54 | S | faint | 3.8 | ||
| ∗148 | 15.99 | 8 52 20.97(9) | 11 42 07(1) | 25(7)a | 0.87 | H | 1.00 | |||
| ∗149 | 5.99 | 8 51 38.52(4) | 11 54 12.3(6) | 3(2)a | 0.06 | H | E 2807h | 2.33 | ||
| ∗150 | 11.75 | 8 52 01.09(9) | 11 42 22(1) | 10(4)a | 0.26 | S | 0.590.28 | |||
| ∗151 | 7.70 | 8 51 49.82(4) | 11 45 28.9(8) | 5(2)a | 0.11 | S | ||||
| ∗152 | 6.39 | 8 50 57.46(4) | 11 50 45.1(7) | 4(2)a | 0.11 | S | F 2776h | 1.97 | ||
| ∗153 | 4.79 | 8 51 23.51(4) | 11 44 45.7(5) | 4(2)a | 0.10 | S | E 1178 | 0.74 | ||
| 154 | 4.64 | 8 51 04.24(4) | 11 49 07.4(5) | 4(2)a | 0.10 | S | ||||
| 155 | 4.74 | 8 51 42.45(4) | 11 49 54.3(6) | 4(2)a | 0.09 | S | S 1272h | 2.05 | ||
| ∗156 | 2.49 | 8 51 32.13(3) | 11 50 42.3(5) | 3(2)a | 0.07 | S | ||||
| 157 | 3.85 | 8 51 18.01(3) | 11 45 54.1(5) | 2(1)a | 0.04 | S | S 986 | 0.35 | ||
| ∗158 | 3.16 | 8 51 35.37(3) | 11 48 32.8(5) | 2(1)a | 0.04 | S | E 3534 | 1.03 |
∗ Source is detected with the significance threshold set to
but not with the threshold set to
∗∗ All
positions are corrected for a systematic offset with respect to the
EIS optical positions which is 023 and 020. The errors on the positions that we
give here are the 1- wavdetect errors including the
corrections for small counts numbers. They are often much smaller than
the uncertainty in the absolute positions, i.e. than the uncertainty
in the offset values (03).
Notes on individual sources:
a For sources CX 148 and CX 149, and for CX 146, CX 147 and CX 150–158, that were only detected in the hard and soft band respectively, the count(rate)s refer to the hard and soft band.
b CX 54: properties may be affected by bad pixel region.
c CX 4, CX 13, CX54: identification with ROSAT source is uncertain.
d CX 6, CX 24, CX 47, CX 139, CX 141: the optical counterparts are not included in the EIS catalogue, or (for S 1237) the EIS position is clearly offset from the centre of the optical source. For these sources, is the distance between the optical position from Fan et al., and the X-ray position (corrected for the systematic offset with respect to the Fan et al. catalogue: 011035, 023029).
e CX 46: besides the faint counterpart, two optical sources lie inside the source region but further away from the X-ray source: E 1243 at 42, and S 778 at 37.
f CX 30, CX 34, CX 35, CX 54: ACIS-S sources; optical counterpart only found when we use 2- wavdetect errors. For CX 30 and CX 35 the counterpart is only found for the total-band source. For CX 34 and CX 54 the counterpart is only found for the soft source; therefore, refers to the distance between the optical source and the soft source.
g CX 26, CX 50, CX 80: ACIS-S sources; optical counterpart only found when we use 3- wavdetect errors. For CX 50 and CX 80 the counterpart is only found for the soft source, therefore, refers to the distance between the optical source and the soft source.
h CX 32, CX 45, CX 53, CX 62, CX 67, CX 73, CX 86, CX 129, CX 149, CX 152, CX 155: optical counterpart lies outside errorbox but inside the source region (we only indicate cases for which ″).
| CX | X | |||
|---|---|---|---|---|
| (h,m,s) | (∘,′,″) | |||
| 4 | 15? | 8 50 57.10 | 11 46 07.7 | N |
| 8 | 32 | 8 51 27.12 | 11 55 24.5 | N |
| 39 | 8 51 08.94 | 11 50 43.8 | ||
| 43 | 8 51 55.77 | 11 50 44.8 | ||
| 46 | 8 50 53.37 | 11 49 43.9 | ||
| 63 | 8 51 25.39 | 11 57 47.1 | ||
| 69 | 8 51 09.43 | 11 49 01.6 | ||
| 74 | 8 51 15.86 | 11 48 37.2 | ||
| 98 | 8 51 11.09 | 11 45 35.9 | ||
| 102 | 8 51 28.60 | 11 52 53.3 | ||
| 120 | 53 | 8 51 31.82 | 11 45 43.8 | |
| 124 | 8 51 53.80 | 11 53 41.2 | ||
| 136 | 8 50 55.67 | 11 48 40.5 | ||
| 145 | 8 51 12.90 | 11 47 40.4 | ||
| 147 | 8 52 18.10 | 11 46 18.7 |