The impact of shocks on the chemistry of molecular clouds
This paper presents a detailed study of the chemistry in the outflow associated with the low-mass protostar NGC 1333-IRAS2A down to 3″ (650 AU) scales. Millimeter-wavelength aperture-synthesis observations from the Owens Valley and Berkeley-Illinois-Maryland-Association interferometers and (sub)millimeter single-dish observations from the Onsala Space Observatory 20 m telescope and Caltech Submillimeter Observatory are presented. The interaction of the highly collimated protostellar outflow with a molecular condensation 15000 AU from the central protostar is clearly traced by molecular species such as HCN, SiO, SO, CS, and CH3OH. Especially SiO traces a narrow high velocity component at the interface between the outflow and the molecular condensation. Multi-transition single-dish observations are used to distinguish the chemistry of the shock from that of the molecular condensation and to address the physical conditions therein. Statistical equilibrium calculations reveal temperatures of 20 and 70 K for the quiescent and shocked components, respectively, and densities near . The line-profiles of low- and high-excitation lines are remarkably similar, indicating that the physical properties are quite homogeneous within each component. Significant abundance enhancements of two to four orders of magnitude are found in the shocked region for molecules such as CH3OH, SiO and the sulfur-bearing molecules. HCO+ is seen only in the aftermath of the shock consistent with models where it is destroyed through release of H2O from grain mantles in the shock. N2H+ shows narrow lines, not affected by the outflow but rather probing the ambient cloud. The overall molecular inventory is compared to other outflow regions and protostellar environments. Differences in abundances of HCN, H2CO and CS are seen between different outflow regions and are suggested to be related to differences in the atomic carbon abundance. Compared to the warm inner parts of protostellar envelopes, higher abundances of in particular CH3OH and SiO are found in the outflows, which may be related to density differences between the regions.
Key Words.:
individual objects: NGC 1333-IRAS2, stars: formation, ISM: jets and outflows, ISM: abundances1 Introduction
One of the manifestations of a newly formed low-mass protostar is the presence of a highly collimated and energetic outflow or jet. A natural consequence of the propagation of such high velocity outflows through the protostellar envelope and the ambient molecular medium are shockfronts (Reipurth & Raga, 1999). Shocks both heat and compress the gas and also trigger chemical reactions in the gas-phase, leading to a different chemistry than observed otherwise. Shock processing of dust grains may lead to the injection of atoms and molecules back into the gas, which further distinguishes the chemistry in the shocked region from that of a quiescent protostellar environment (e.g., Tielens, 1999). This paper presents a study of the physics and chemistry of the outflow associated with a well-known class 0 young stellar object NGC~1333-IRAS2 using high-resolution millimeter wavelength interferometer and multi-transition single-dish observations. The NGC~1333-IRAS2 outflow provides a unique opportunity to study the effects of outflows on ambient molecular clouds, as the main shock is well separated from the central protostar and shows a relatively simple morphology. The combination of single-dish and interferometry observations makes it possible to discuss the physical and chemical properties of the outflowing gas and to address the spatial differentiation of the chemistry in the outflow region resolved by the interferometer observations.
Studies of molecular abundances in regions of high outflow activity provide insight into the dependence of the chemical reaction networks on temperature and density. Furthermore it is important to recognize the effect of outflow-triggered chemistry in the inner protostellar envelope, to disentangle it from emission from a circumstellar disk or to address the effect of passive heating by the central protostar. In the central part of the protostellar envelope, thermal evaporation of dust grain mantles can lead to a distinct chemistry as is seen in the case of low-mass protostars (e.g IRAS 16293-2422, Ceccarelli et al., 2000a, b; Schöier et al., 2002; Cazaux et al., 2003).
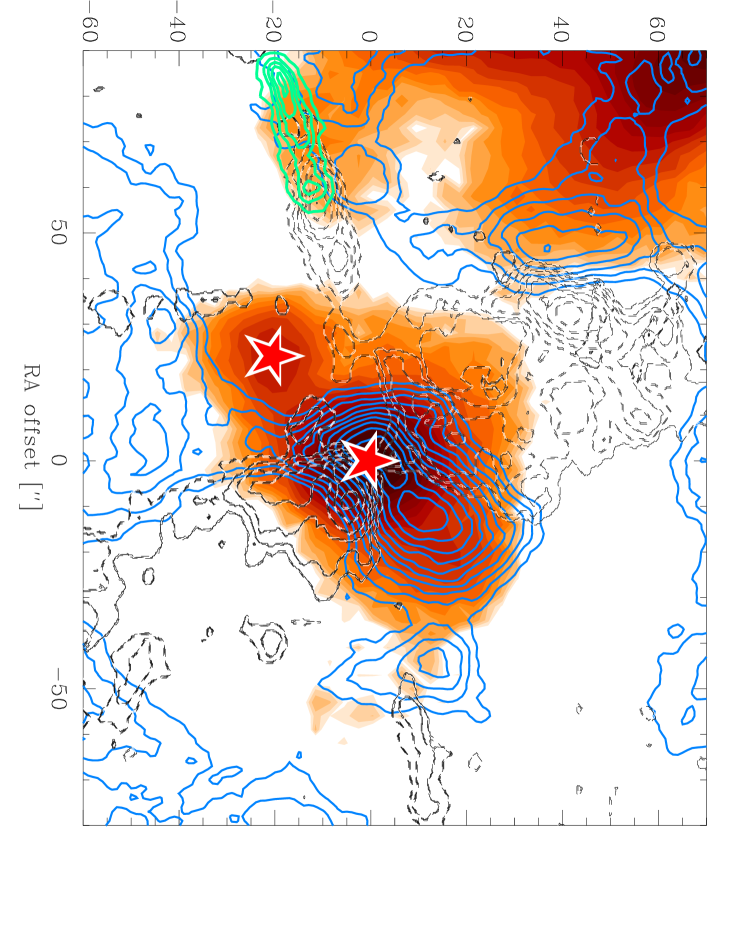
NGC~1333-IRAS2 (also known as IRAS~03258+3104; hereafter simply IRAS2) is located in the NGC~1333 molecular cloud, harboring several class 0 and I objects, first identified through IRAS maps by Jennings et al. (1987). Continuum observations reveal that IRAS2 is a binary source with two components, IRAS2A and 2B, separated by 6500 AU (30″) (Sandell et al., 1994; Blake, 1996; Looney et al., 2000). IRAS2A is responsible for a highly collimated east-west outflow giving rise to a strong shock 15000 AU from the central continuum source (Fig. 1). A strong CO outflow in the north-south direction has also been observed (Liseau et al., 1988; Engargiola & Plambeck, 1999), which originates within a few arcseconds from IRAS2A (Jørgensen et al., 2003a).
Langer et al. (1996) mapped the entire NGC~1333 region in CS and identified two peaks in CS emission toward the IRAS2 outflow. They suggested that these are associated with red-shifted (eastern) and blue-shifted (western) bow shock components of the outflow. Sandell et al. (1994) reported bright CH3OH emission toward the red-shifted (eastern) outflow lobe and correspondingly a high CH3OH abundance, possibly enhanced by the shock. The more detailed structure of the CH3OH emission from the IRAS2A east-west outflow was discussed by Bachiller et al. (1998), who mapped the outflow positions at 3″ using the IRAM interferometer and 30 m single-dish telescope. Bachiller et al. derived the physical conditions in the shock interaction zone from LVG calculations and obtained a density of cm-3 and temperature of K.
Bachiller et al. also found that the observed methanol emission translates to a large enhancement of CH3OH by a factor in the IRAS2A outflow. CH3OH is thought to be released directly from the dust grain mantles and is often seen to be associated with protostellar outflows (e.g., Bachiller et al., 1995). Other often-used tracers of shocks associated with protostellar outflows are Si-bearing species, in particular SiO (e.g., Martin-Pintado et al., 1992; Codella et al., 1999; Garay et al., 2002). High abundances of these species may mark a clear distinction of shocked gas from unprocessed gas in the envelopes around low-mass protostars (Bachiller & Pérez Gutiérrez, 1997; Garay et al., 1998; Bachiller et al., 2001).
In this paper we present a study of the detailed chemistry of the shock associated with the IRAS2A outflow based on observations of a wide range of molecular lines at ″ resolution from the Owens Valley Radio Observatory (OVRO) and Berkeley Maryland Illinois Association (BIMA) millimeter interferometers, together with millimeter and submillimeter single dish observations from the Onsala 20 m telescope (OSO) and the Caltech Submillimeter Observatory 10.4 m telescope (CSO). Parts of the OVRO observations have previously been presented by Blake (1996). Sect. 2 describes the observations and reductions. The maps from the interferometry observations are presented and discussed in Sect. 3.1, while the single dish observations are treated in Sect. 3.2. The physical and chemical properties of the shock region are analyzed using statistical equilibrium calculations as described in Sect. 4 and molecular abundances are derived. Sect. 5 discusses the inferred chemistry and compares it to other well-studied outflow regions, to other types of star-forming environments and to available models for the chemistry in outflow regions. The main findings are summarized in Sect. 6. A companion paper (Jørgensen et al., 2003a) presents details of a millimeter-wavelength interferometer study of the environment surrounding the central protostellar system.
2 Overview of observations
The position of the shock in the eastern lobe of the outflow associated with IRAS2A (; ) was observed with the Millimeter Array of the Owens Valley Radio Observatory (OVRO)111The Owens Valley Millimeter Array is operated by the California Institute of Technology under funding from the US National Science Foundation (grant no. AST-9981546). between October 5, 1994 and January 1, 1995 in the six-antenna L- and H-configurations. Tracks were obtained in two frequency settings at 86 and 97 GHz, and each track observed in alternatingly two fields: the bow shock at the end of the eastern outflow discussed in this paper and the position of the central protostellar source (Jørgensen et al., 2003a). The observed tracks cover projected baselines of 3.1–70 k at 86 GHz and the lines observed are listed in Table 1. The lines were recorded in spectral bands with widths of 32 MHz ( km s-1). H13CO+ and CS were observed in 128 spectral channels, the remaining line setups included 64 spectral channels. The complex gain variations were calibrated by observing the nearby quasars 0234+285 and 3C84 approximately every 20 minutes. Fluxes were calibrated by observations of Uranus and Neptune. The rms noise levels are 0.05 Jy beam-1 in the 250 kHz channels with a synthesized beam size of ″. Calibration and flagging of visibilities with clearly deviating amplitudes and/or phases was performed with the MMA reduction package (Scoville et al., 1993).
The millimeter interferometer of the Berkeley-Illinois-Maryland Association (BIMA)222The BIMA array is operated by the Universities of California (Berkeley), Illinois, and Maryland, with support from the National Science Foundation (grants AST-9981308, AST-9981363 and AST-9981289). observed the IRAS2A outflow position between March 4 and April 15, 2003. The array B- and C-configurations provided projected baselines of 2.7–71 k. The lines of HCO+ 1–0, HCN 1–0, N2H+ 1–0, and C34S 2–1 were recorded in 256-channel spectral bands with a total width of 6.25 MHz ( km s-1). The complex gain of the interferometer was calibrated by observing the bright quasars 3C84 (4.2 Jy) and 0237+288 (2.3 Jy) approximately every 20 minutes. The absolute flux scale was bootstrapped from observations of Uranus. The rms noise levels are 0.2 Jy beam-1 in the 24 kHz channels, with a synthesized beam size of FWHM ( for the C34S and N2H+ observations). The data were calibrated with routines from the MIRIAD software package (Sault et al., 1995).
In addition to the interferometry data, a number of molecular lines were observed toward the position of the red-shifted shock using the Caltech Submillimeter Observatory 10.4 m (CSO)333The Caltech Submillimeter Observatory 10.4 m is operated by Caltech under a contract from the National Science Foundation (grant no. AST-9980846). and Onsala Space Observatory 20 m (OSO)444The Onsala 20 m telescope is operated by the Swedish National Facility for Radio Astronomy, Onsala Space Observatory at Chalmers University of Technology. telescopes. The pointing was checked regularly and found to be accurate to a few arcseconds. The typical beam sizes are 45″–33″ for the OSO 20 m (86–115 GHz) and 26″–20″ for the CSO (217–356 GHz) observations. The data were calibrated using the standard chopper wheel method. The spectra were reduced in a standard way by subtracting baselines and by dividing by the main-beam efficiencies as given on the web pages for the two telescopes. ranges from 0.6 to 0.43 for frequencies of 86 to 115 GHz for the OSO 20 m and 0.67 to 0.62 for frequencies of 217 to 356 GHz for the CSO. An overview of all the observed lines (single-dish and interferometer) is given in Table 1.
| Line | Rest freq. | Observed with | |
|---|---|---|---|
| CO | 230.5380 | CSO | |
| 345.7960 | CSO | ||
| C18O | 329.3305 | CSO | |
| CH3OH | 97.5828 | OVRO | |
| 338.7222 | CSO | ||
| CS | 97.9810 | OSO, OVRO | |
| 244.9356 | CSO | ||
| 342.8830 | CSO | ||
| C34S | 96.4129 | BIMA | |
| HCN | a | 88.6318 | OSO, BIMA |
| 354.5055 | CSO | ||
| HCO+ | 89.1885 | OSO, BIMA | |
| 356.7343 | CSO | ||
| H13CO+ | 86.7543 | OSO, OVRO | |
| H2CO | 351.7686 | CSO | |
| 362.7359 | CSO | ||
| N2H+ | a | 93.1737 | OSO, BIMA |
| SiO | 86.8470 | OSO, OVRO | |
| 217.1049 | CSO | ||
| 347.3306 | CSO | ||
| SO | 86.0940 | OVRO | |
| 99.2999 | OSO | ||
| 346.5285 | CSO | ||
| SO2 | 97.7024 | OVRO |
aHyperfine splitting - multiple lines observed in one setting. The coordinates for the single-dish observations are , , i.e., corresponding to offset of (79″,-17″) in the maps presented in this paper.
3 Data
3.1 Interferometry
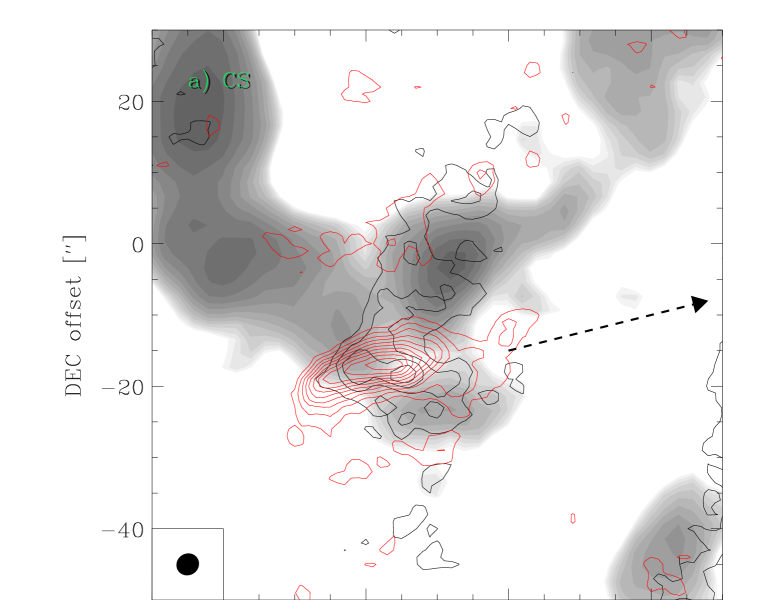
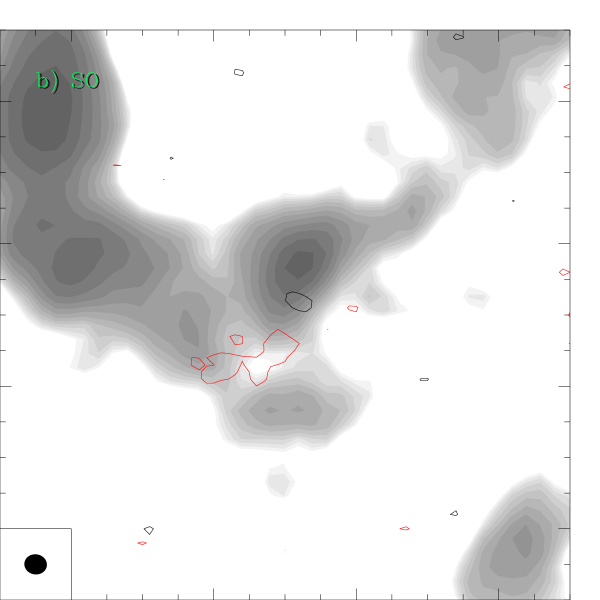
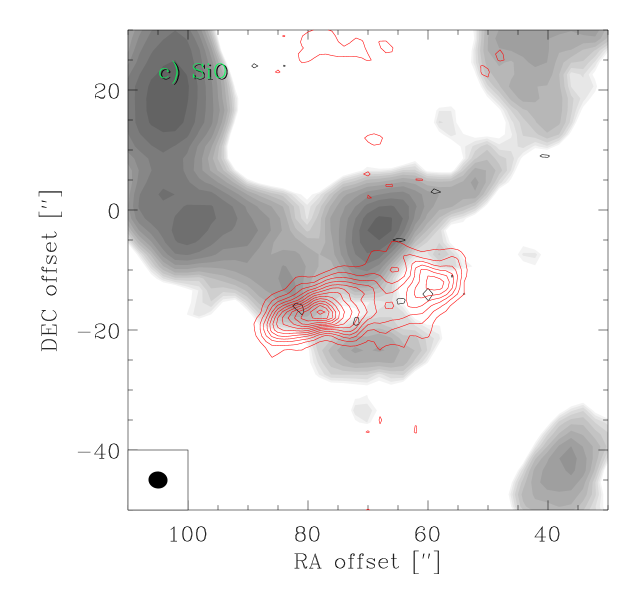
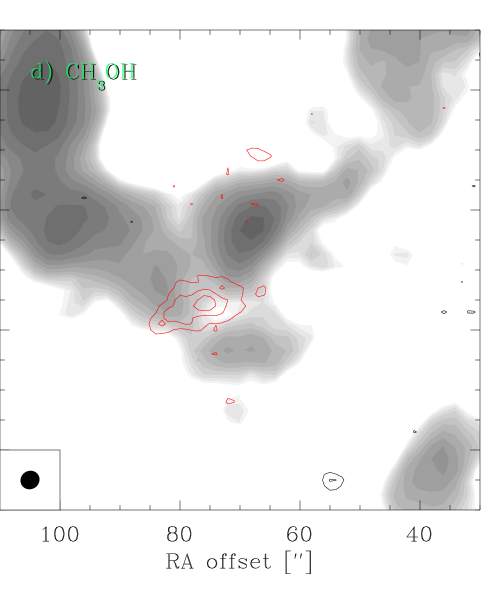
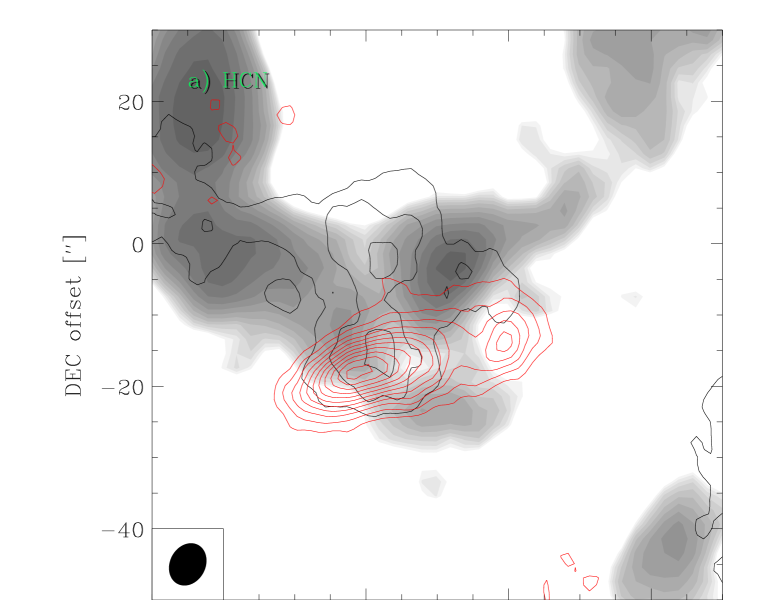
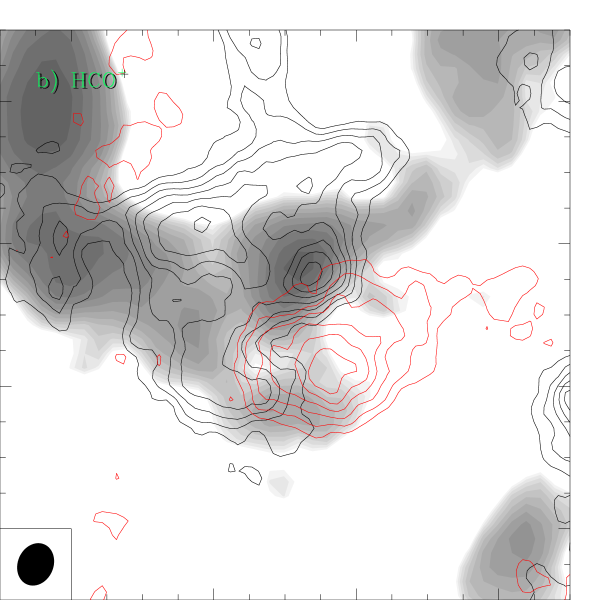
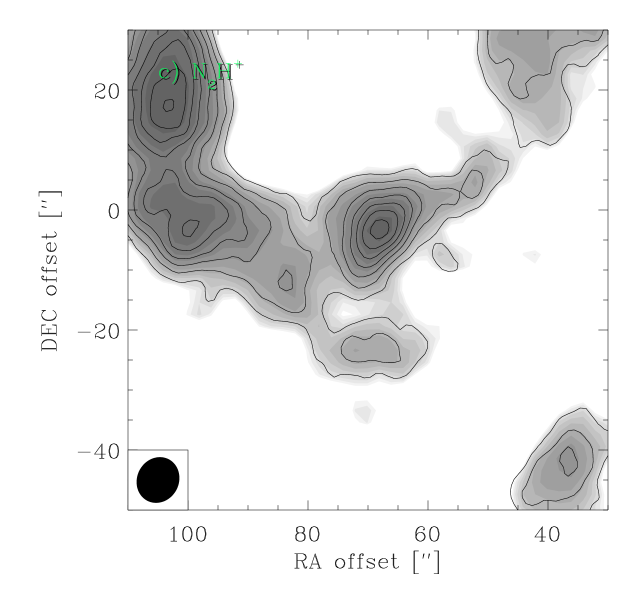
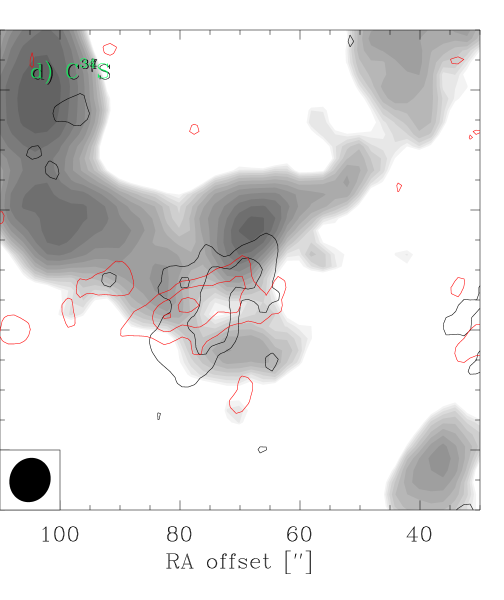
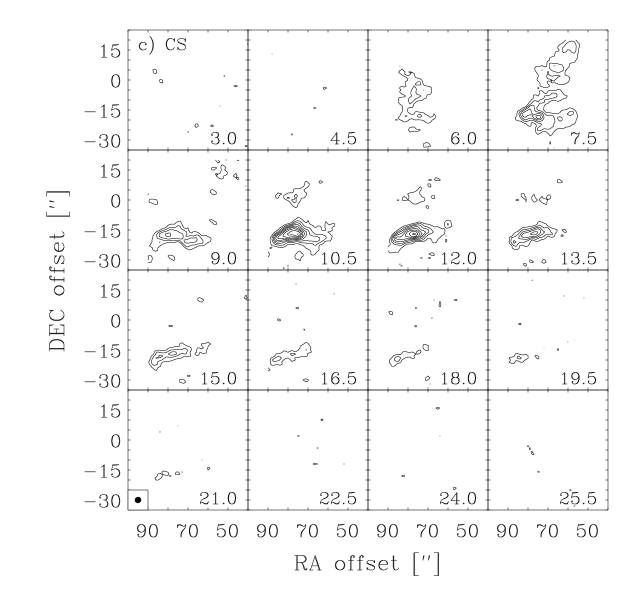
Fig. 2-3 show moment maps for the lines observed at OVRO (CS, SO, SiO and CH3OH) and BIMA (i.e., HCO+, HCN, N2H+ and C34S). In all maps the coordinates are given as offsets relative to the position of the central protostar, IRAS2A: , . Emission of SO2 and H13CO+ was not detected in the interferometer maps toward the outflow position.
Most of the observed lines show indications of material affected by the outflow with clear line wings spreading out to 10-15 km s-1 from the systemic velocity of 7 km s-1. One exception is N2H+ which shows narrow hyperfine components of approximately 1 km s-1 width (FWHM). Of the observed lines, SiO, CS and HCN show emission stretching furthest from the systemic velocity (out to 20 km s-1) while the remaining species show somewhat narrower profiles (wings stretching out to 10 km s-1 relative to the systemic velocity), with HCO+ showing most material closest to the cloud systemic velocity. SiO is not seen at low velocities as is also the case for CH3OH and SO.
In general the molecules observed at BIMA most clearly trace the extended low velocity material. This may in part be due to the different coverage of the two arrays, with the BIMA observations recovering more of the extended emission, but the species observed at OVRO may also be those that are predominantly enhanced by the outflow generated shock.
The N2H+ emission traces a ridge of material with a number of “cores” stretching from the north-east of the map toward the center and back again to the north-west. A dominant core is seen close to the center (offsets of (67″,-3″)) which is also picked up by the HCO+ maps. South of this core a “”-shaped extension is seen in both HCO+ and N2H+. The low velocity CS emission picks up only this feature. A similar component was also seen in the CH3OH emission mapped by Bachiller et al. (1998) but is not evident in the CH3OH observations presented here, possibly due to lower sensitivity.
The high-velocity material is generally much less extended than the low-velocity material. The HCN, SiO and CS trace a narrow component stretching 30-40″ along the outflow propagation and 5-10″ in the direction perpendicular to this. The narrow component points directly to the “”-shaped feature in the low velocity emission material. The HCN emission is slightly more extended than that of the two other species, again likely due to the different coverage of the observations from the two arrays. SO and CH3OH show a slightly weaker structure along the same narrow component.
The emission of CH3OH and SO is located downstream (west) of the outflow propagation direction compared to, e.g., the peak of SiO. Even farther downstream around offset (59″,-13″), HCN, CS and SiO show another strong feature where the N2H+ emission “pinches” the outflow. The HCO+ wing emission is seen only at this position and is found to be more extended, filling out the region void of N2H+. In fact the HCO+ emission can be traced all the way back to the central protostar as is also the case for CO (Fig. 1). It is striking how the HCO+ and, e.g., HCN wing emission trace significantly different components, implying a clear chemical differentiation.
Position-velocity diagrams for CS and SiO are presented in Fig. 5. Note the symmetry around the X-axis in these diagrams with low-velocity emission constituting a broad component of weak emission. For both species, the high velocity component is more pronounced toward the working surface of the outflow.


3.2 Single-dish
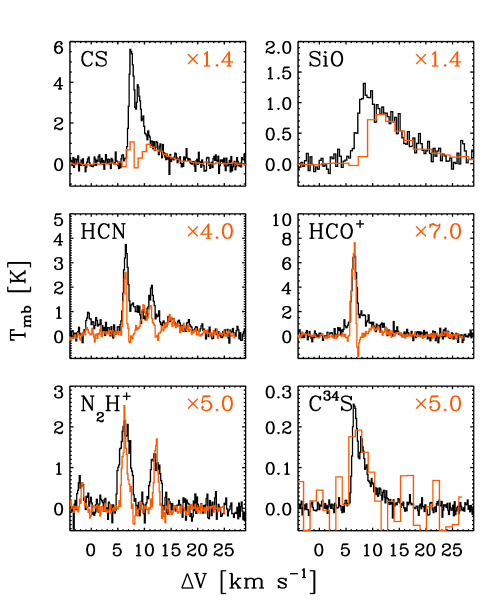
The observed single-dish spectra are presented in Fig. 6. In agreement with the interferometry maps, the N2H+ hyperfine lines show Gaussian profiles with no sign of outflow wings. The same applies for the C18O 3–2 observations. The 3 mm lines of HCO+, HCN, CS and SO show a “two component” line profile with a narrow peaked profile close to the systemic velocity of the cloud along with a clear red wing extension. SiO on the other hand does not show the narrow component but has a more or less abrupt increase slightly above the cloud rest velocity with a close to linear decline in strength toward the higher (red-shifted) velocities. For the CSO (0.8–1.4 mm) lines a similar trend is seen (except for C18O 3–2). For the CO 2–1 and 3–2 transitions two strong dips are seen at the cloud rest velocity and in the blue part of the spectrum likely due to self-absorption and possible switching onto non-source CO emission. This, however, does not affect the wing emission in the spectrum, which stretches out to km s-1 (20–25 km s-1 relative to the cloud rest velocity).

In Fig. 7 spectra for individual molecules are compared. The two component separation into a core and wing profile seems to be unique for each molecule: the widths of the core part of the lines (where observable in more than one transition) and the dependence of line strength with velocity in the wings, in particular the terminal velocities inferred for each molecule, are both independent of the observed transition. This gives a clear indication that two distinct components with different excitation conditions and chemical properties are observed and that the different molecules probe distinct parts of each of these components, within which the excitation properties do not vary significantly.
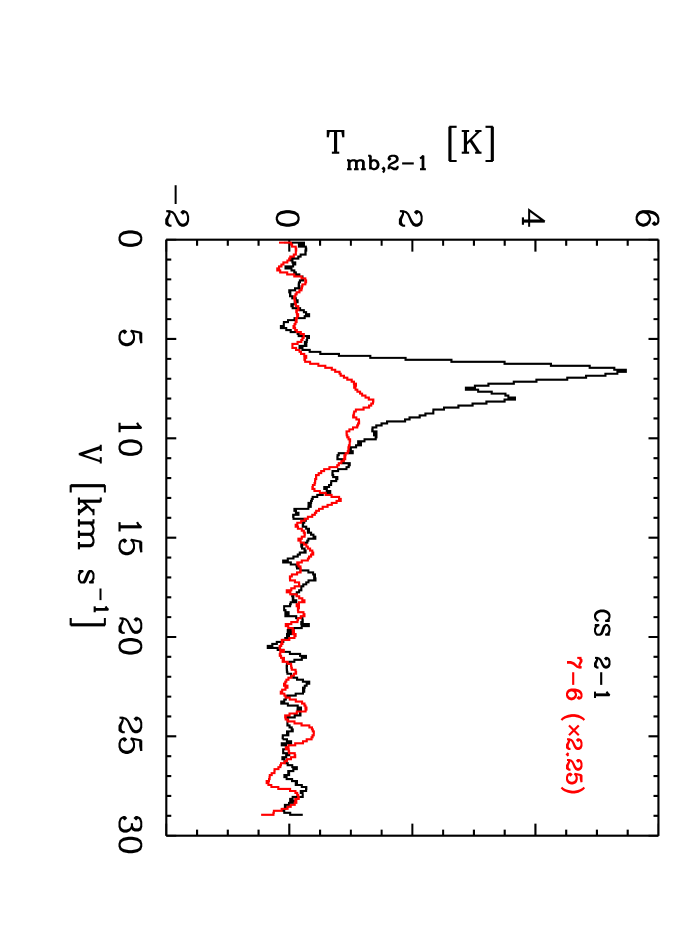
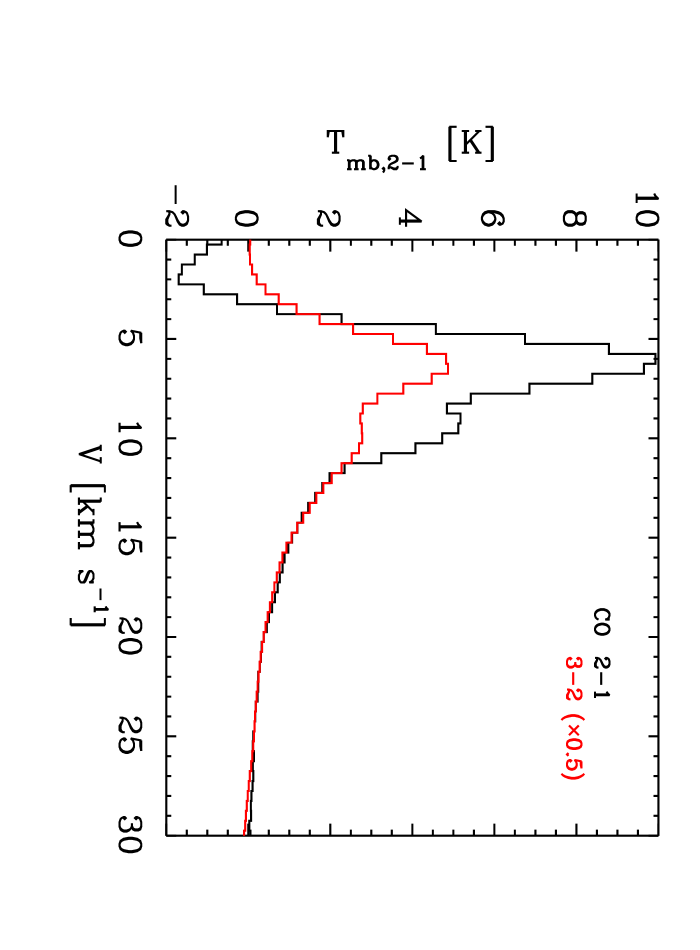
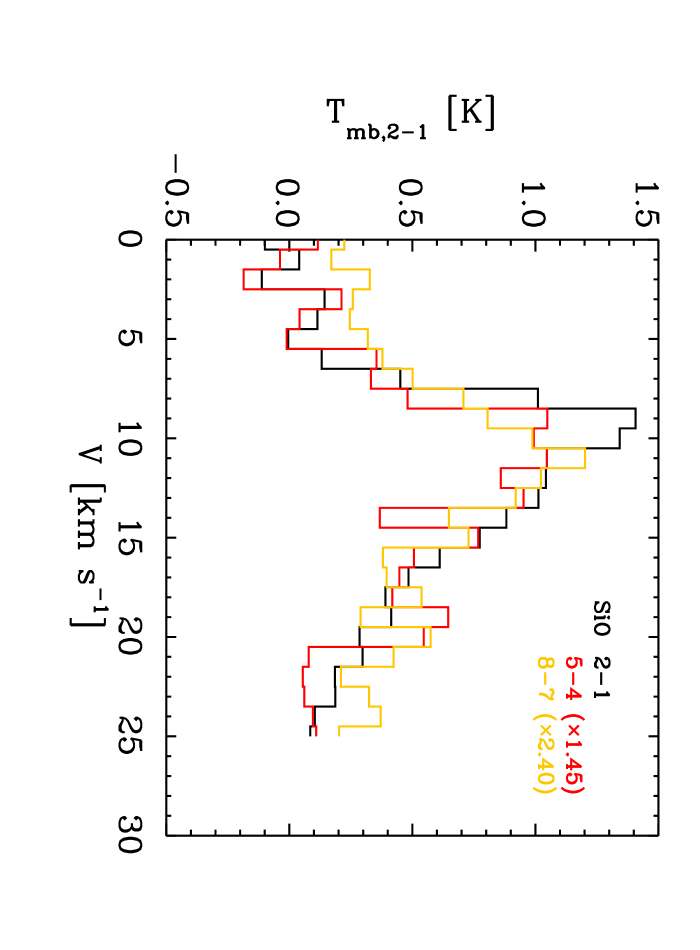
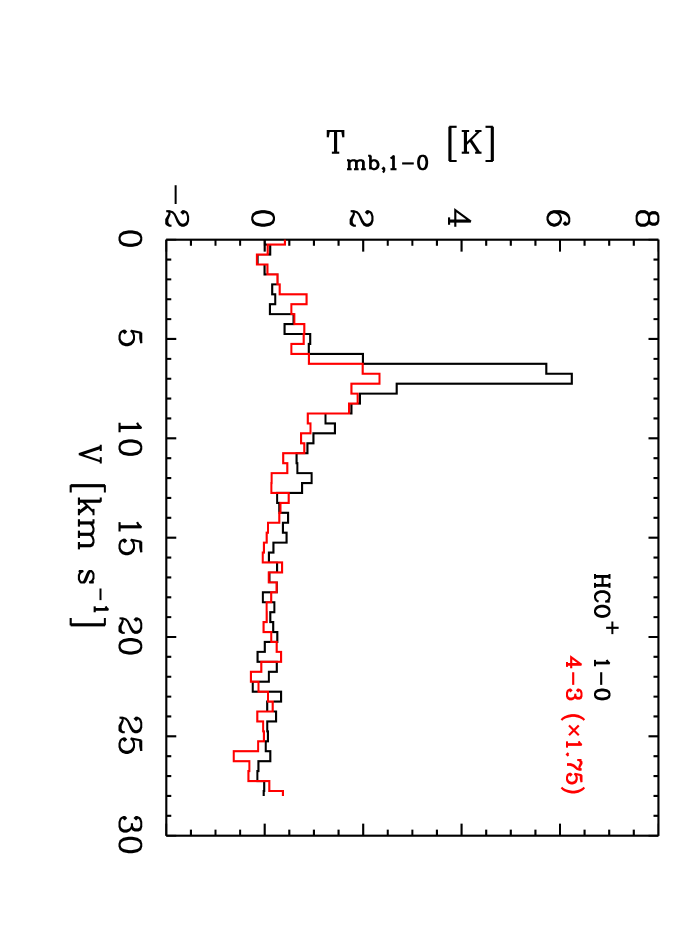
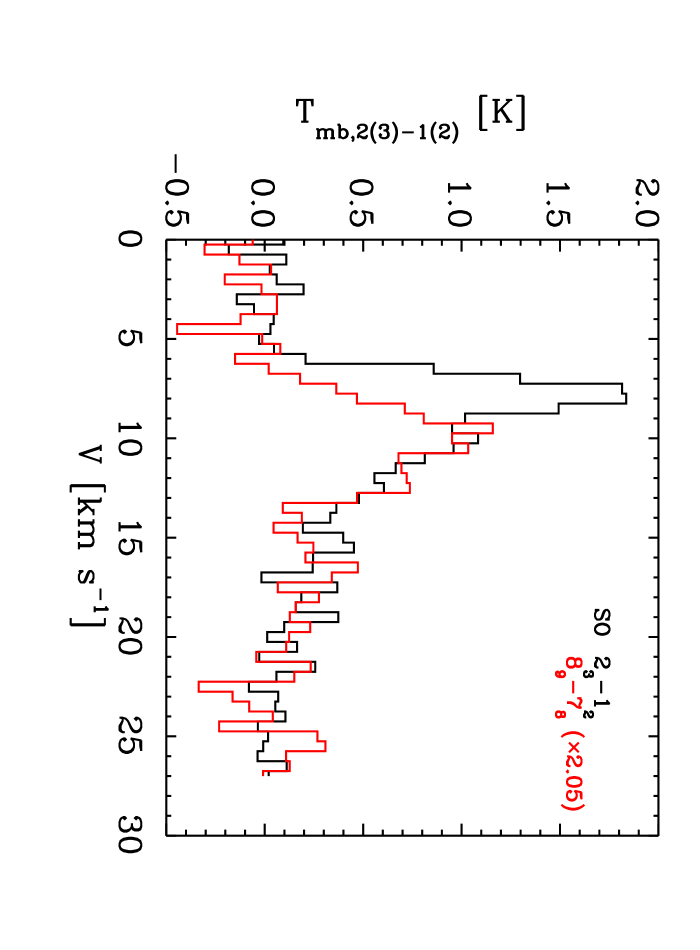
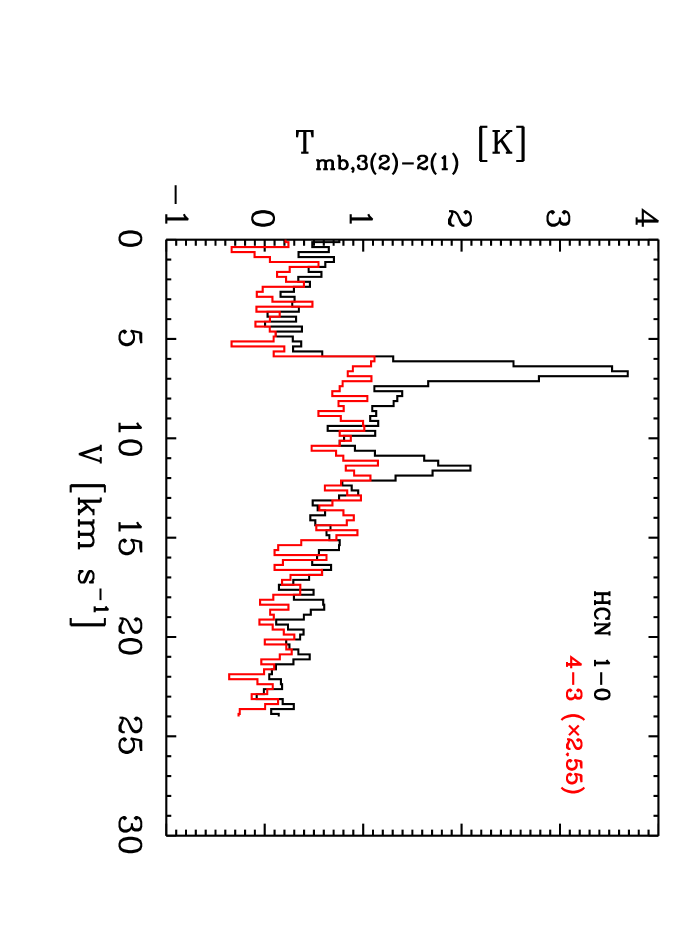
As for the interferometry data, the terminal velocities seem to indicate different dynamical components of the outflow region. SiO and CO probe material at the highest velocities relative to the cloud rest velocity of 20–25 km s-1, whereas HCO+ has the lowest degree of wing emission extending 10 km s-1 from the rest velocity. The remaining molecules fall somewhere in between. A similar trend was seen in the L1157 outflow by Bachiller et al. (2001), who also found CO and SiO to have significantly higher terminal velocities than HCO+, H2CO, SO and CS. They suggested that this could be related to differences in the formation mechanisms for the various species. Bachiller et al. also argued in favor of rather homogeneous excitation conditions in the L1157 outflow, since maps of various transitions for specific molecules were found to be very similar. In this case the main differences among different molecular species would be the result of the chemistry in the region.
3.3 Qualitative scenario
The morphology of the interferometry maps and the line-profiles of the single-dish observations can be explained in a simple picture as signatures of a highly collimated outflow ramming into a quiescent core or static cloud traced by the clumps of C18O and N2H+ emission. The action of the outflow leads to sputtering of silicon off dust grains to form SiO, which is totally absent in the quiescent core. At the same time the abundances of CH3OH, CS and SO increase, more likely due to evaporation of ice mantle material. A sequence in chemistry can be seen with SiO probing material at the highest velocities followed by CS and SO, thought to be a result of enhanced sulfur gas phase chemistry, and CH3OH, H2CO and HCN, which are likely to be direct results of grain mantle release. The difference in extent of the line wings indicates either that the molecule formation time scales are varying, with SiO being produced most rapidly in the shock, or that the more volatile species such as CH3OH do not survive at the highest velocities in the flow.
That N2H+ is observed only in the quiescent cloud material is explained if the temperature in the material affected by the outflow increases to K. At this temperature CO is released from grain mantles and becomes the dominant destruction channel of N2H+, lowering the abundance of this molecule. Comparison between the morphology of the N2H+ emission and that of other species indicates a clear interaction between the outflowing material and the ambient cloud. Fig. 2-3 show a cavity of N2H+ emission where the shocked gas (e.g., SiO) appears. The two peaks seen in SiO, HCN and CS also seem to be related to an increase in N2H+ emission. A natural question is whether the outflow shapes or is being shaped by the ambient material. Judging from the morphology of the larger scale emission in Fig. 1, it is striking to note the presence of large amounts of dust northeast of the central IRAS2A protostar. The two CO outflows identified by different authors (e.g., Liseau et al., 1988; Engargiola & Plambeck, 1999; Knee & Sandell, 2000) trace the edges of this dust condensation. The two perpendicular outflows seen toward IRAS2 may therefore reflect the conditions in the ambient cloud material rather than the intrinsic properties of the central protostellar system: the CO outflow could simply be deflected around the dense material traced by the N2H+ and continuum emission leading to the quadrupolar morphology. In either case, however, this does not change the interpretation of the shocked material in this paper. High velocity gas ( 20 km s-1 relative to the systemic velocity) is present toward the eastern lobe as it is seen from most of the species observed in this paper and this indicates the presence of the shock.
4 Analysis
4.1 Line intensities
Despite the clear separation between the “quiescent” and “shocked” parts of the line profiles for most molecules, the disentanglement of the emission into a core and wing component is not unique. Each line was decomposed in two parts, with the emission integrated over velocities higher and lower (wing and core components, respectively) than where the profiles in Fig. 7 separate. For C18O and N2H+ Gaussians were fitted to each line giving widths of 1.5–2 km s-1 (FWHM), which compares well to the widths of the core parts of the remaining lines. Table 2 lists the resulting line intensities.
The hyperfine splitting of the HCN 1–0 line gives rise to three components within the same setting. The two weaker transitions are offset and 7 km s-1 relative to the main hyperfine line. Overlap in the line wings therefore makes the interpretation of this line difficult. If the emitting material is in local thermodynamical equilibrium (LTE) and the emission is optically thin, one should expect the hyperfine components to be in a ratio of 1:3:5. In Fig. 8 a comparison between the HCO+ and HCN spectra toward the shock position is shown. The HCN spectrum has been overplotted with a composite of three versions of the HCO+ spectrum shifted according to the frequency shifts of the hyperfine lines and scaled in the relative 1:3:5 proportions - leaving an overall “normalization factor” between the HCN and HCO+ line intensities as the only free parameter. The good agreement is remarkable and indicates that HCO+ and HCN trace the same material, especially at the lower velocities. The intensity of the main hyperfine component of the HCN 1–0 line is thereby found to be 0.5 times the intensity of the HCO+ 1–0 line. It should still be re-emphasized, that the interferometer maps show clear differences for the less extended HCN and HCO+ emission at higher velocities.
| Molecule | Transition | a | b | a | b |
| km s-1 | K km s-1 | km s-1 | K km s-1 | ||
| 12CO | 2–1 | [4,11] | 45 | [11,30] | 13 |
| 3–2 | [4,11] | 50 | [11,30] | 24 | |
| C18O | 3–2 | Gaussian | 1.7 | ||
| CH3OH | 72–62 | [6,9] | 2.0 | [9,21] | 6.4 |
| CS | 2–1 | [5.5,9.5] | 12 | [9.5,16] | 3.9 |
| 7–6 | [5.5,9.5] | 1.6 | [9.5,16] | 1.6 | |
| HCN | 1–0c | [5.5,7.5] | 4.2 | [7.5,15] | 3.3 |
| 4–3 | [5.5,7.5] | 0.72 | [7.5,15] | 0.78 | |
| HCO+ | 1–0 | [5.5,7.5] | 8.4 | [7.5,15] | 6.5 |
| 4–3 | [5.5,7.5] | 2.7 | [7.5,15] | 2.0 | |
| H2CO | [5.5,7.5] | 3.1 | [7.5,15] | 1.5 | |
| SiO | 2–1 | [7,29] | 10.4 | ||
| 5–4 | [7.5,20] | 6.5 | |||
| 8–7 | [7.5,28] | 4.4 | |||
| SO | [5,9] | 4.3 | [9,17] | 4.2 | |
| [5,9] | 0.61 | [9,17] | 2.0 |
Notes: aVelocity interval over which the emission is integrated. bIntegrated line intensity (). cMain hyperfine line; line intensities derived through decomposition with HCO+ line. See description in text.
4.2 Tying interferometry and single-dish observations together
One question to address is whether the single-dish and interferometry observations trace the same material. The similar trends seen in the data from the two types of observations seem to support this, but it is also known that the interferometry observations lack sensitivity to extended structures on larger scales.
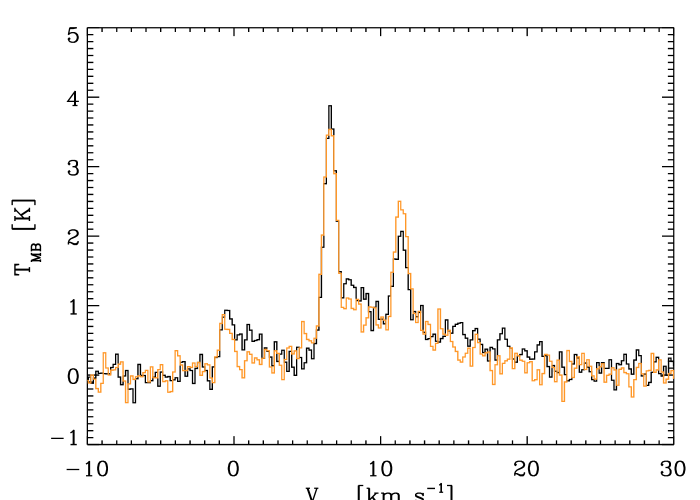
Fig. 9 presents comparisons between the single-dish observations and spectra taken from interferometry data sets, restored with beam sizes appropriate for the Onsala 20 m telescope. The interferometry spectra have been scaled to match the wings of the single-dish spectra. Only a small correction of the order of 30% needs to be applied to match the CS and SiO spectra, which is close to the calibration uncertainty. This confirms that the higher velocity emission is relatively compact (as the maps also suggest for the emission in the transverse direction of the outflow), making it less subject to the incomplete sampling of the interferometer observations.
Closer to the systemic velocity of the cloud ( km s-1) the discrepancy between the single-dish and interferometry spectra increases. The CS interferometry observations pick up only a small fraction of the emission in the “core” part of the single-dish line. The dip seen in the single-dish CS spectra at the rest velocity of the cloud is a result of self-absorption, while for the interferometry observations it is caused by the interferometer resolving out extended emission close to the cloud systemic velocity. The sampling is also responsible for the lack of emission in the SiO interferometry spectra at velocities close to the rest velocity, although it is less significant for this molecule.
For the BIMA observations of HCN and HCO+, emission close to the systemic velocity is still mostly resolved out as indicated by the dips in the interferometer HCN and HCO+ spectra and as seen in the channel maps in Fig. 4. The slightly better coverage from BIMA, however, makes these lines less subject to resolving out at velocities different from the systemic velocity.
Nyquist sampled single-dish maps of the different molecular species would make it possible to combine the interferometer and single-dish data to create maps including the short-spacings. This would settle the issue of the differing coverage of the two arrays. In this paper we only have single pointing observations. The agreement between the single-dish and interferometry spectra in the line wings, however, justifies the discussion of the outflow component based on the morphology in the interferometry maps presented in Sect. 3.1. The agreement also makes it possible to use the interferometer maps to determine the spatial extent of the wing component, and thereby to estimate the beam filling factor for the single-dish observations. The wing part of the SiO and CS interferometry maps give a rough estimate of the extent of the outflow emission in the transverse direction of 5-10″, leading to filling factors ranging from 0.07 to 0.32 for the single-dish beam sizes. For the core component of the lines on the other hand, the interferometer observations are less useful because of the significant fraction of the low-velocity, extended emission that is resolved out. For the following discussion, a filling factor of unity is therefore assumed for the core component of the single-dish data, which seems realistic as the interferometry maps do reveal emission extended over scales larger than 20–30″.
4.3 Statistical equilibrium calculations
In order to derive the physical properties of the emitting gas and the column densities of the various molecules, one-dimensional statistical equilibrium calculations were performed using the 1D radiative transfer code called Radex. Radex uses the escape probability formalism to solve the statistical equilibrium equations for a medium with constant density and temperature (see Jansen et al., 1994; Schöier et al., 2003). For subthermally excited emission this approach is an improvement compared with the rotation diagram method, as demonstrated for interpretations of the CH3OH emission toward the IRAS2A outflow by Bachiller et al. (1998). The statistical equilibrium calculations also treats opacity effects in the correct way, again contrasting the rotation diagram analysis which relies on optically thin emission.
For each molecule, line intensities were calculated for varying column density, density of the main collision partner (H2) and kinetic temperature. The filling factors estimated on the basis of the interferometry observations as discussed above were adopted and the calculated line intensities were compared to the observed ones. Since our main interest is in the relative behavior of the lines some of the uncertainties in the assumptions, e.g., the filling factor of unity for the core component, will cancel out, if the differences between the observed lines are not too large.
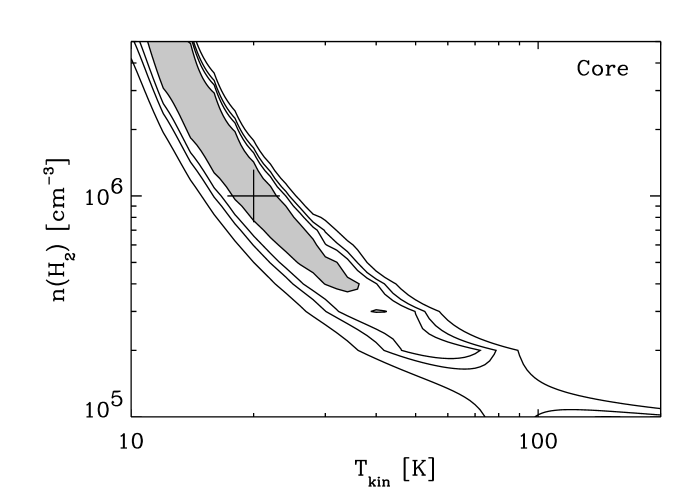
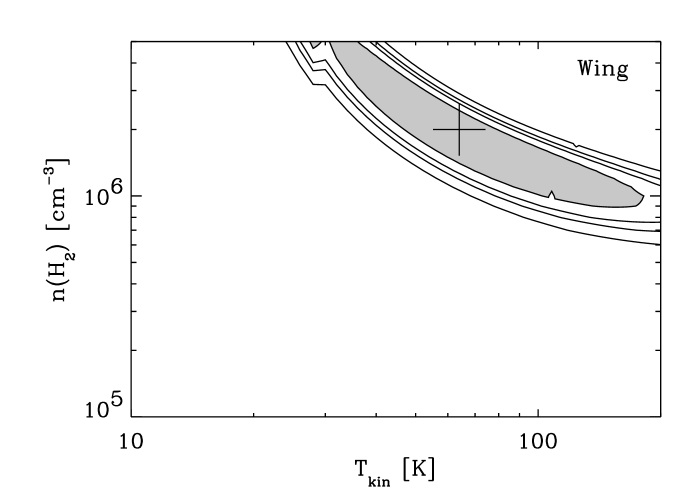
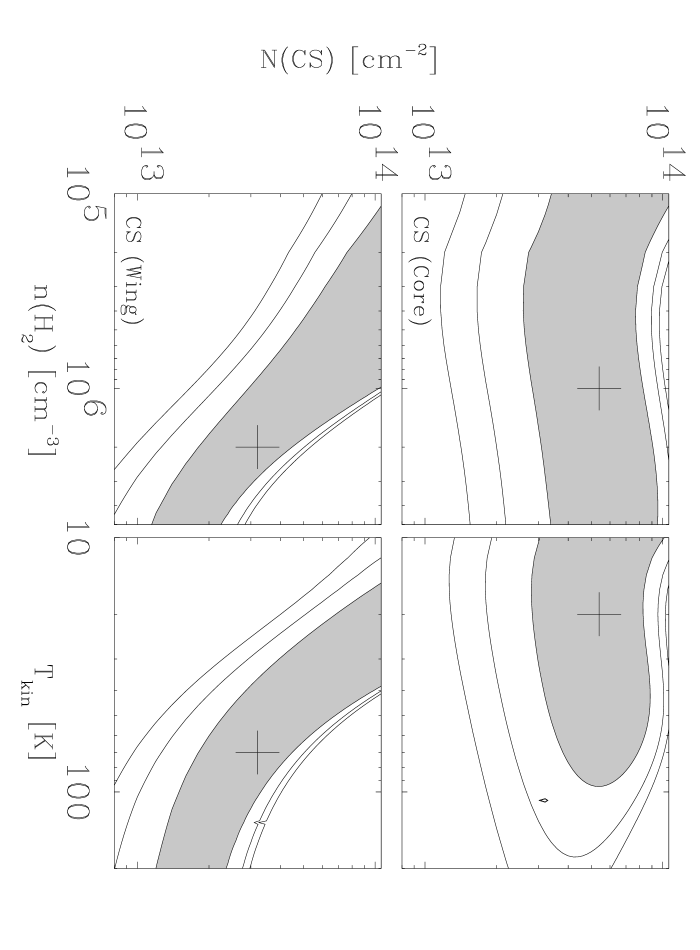
The comparison with the observations was performed by calculating the -statistics for each set of parameters. The uncertainty in the derived line intensities due to the calibration and the disentanglement of the core and wing components was assumed to be 30%. The best fit models for the different species agree quite well in the plane, so all lines are combined into a single estimate to constrain the parameters. This is illustrated in Fig. 10 where the constraints on densities and temperatures have been plotted for given (optimal) values of the column densities for the individual molecules. For the core component an H2 density of cm-3 and temperature of 20 K is found to be consistent with the observations with a reduced of 1.8 for 8 fitted lines. Note that the density and temperature are closely coupled, making individual determinations somewhat ambiguous, as illustrated in the plot, where it is seen that a lower temperature and correspondingly higher density are equally probable. A lower density/higher temperature can also not be completely ruled out. For the wing component a best fit density of 2.0 cm-3 and temperature of 70 K is found with of 3.8 for 13 fitted lines. The temperature is slightly lower than the value quoted by Bachiller et al. (1998), but still within the mutual uncertainties. The derived column densities assuming these temperatures and densities are given in Table 3.
The kinetic temperatures and densities may vary between regions traced by different molecular species. Both the velocity profiles of the various molecules and the structure of their emission in the interferometry maps show dissimilarities, indicating chemical differentiation possibly due to a combination of the shock evolution and variations in the physical conditions. On the other hand as illustrated in Fig. 7, the conditions for lines of a particular molecule are remarkably homogeneous over the entire shock velocity range. It is also found that the derived parameters do not vary much when specific molecules are included or not. The constraints put on our derived temperature and density are in rough agreement with measurements from other shocked regions from molecular outflows (e.g., Bachiller & Pérez Gutiérrez, 1997; Garay et al., 1998). As a first order approximation the two component structure therefore seems to describe the excitation conditions well. Moreover, the derived column densities are well constrained with the assumed temperature and density in this regime, as illustrated in Fig. 11.
| Molecule | a | a |
|---|---|---|
| [cm-2] | [cm-2] | |
| COb | 5.1 | 1.2 |
| CH3OH | 3.4 | 5.8 |
| CS | 5.4 | 3.2 |
| HCN | 1.1 | 5.7 |
| HCO+ | 6.6 | 3.5 |
| H2CO | 8.9 | 1.8 |
| N2H+ | 9.0 | |
| SiO | 1.4 | |
| SO | 6.2 | 1.3 |
Notes: aCalculated for and K (core) and K (wing). bBased on 12CO measurements for the column densities in the wings and C18O measurements for the core (assuming a 16O/18O isotope ratio of 540).
5 Discussion
5.1 Comparison to other protostellar outflows and envelopes
As mentioned in Sect. 1 only a few studies have addressed the chemistry in outflow regions in detail, the most thorough being that of the L1157 outflow (e.g Bachiller & Pérez Gutiérrez, 1997; Bachiller et al., 2001) and the molecular condensation ahead of the HH2 outflows (Girart et al., 2002). These regions differ significantly in their context: the CO maps L1157 show an outflow progressing through the protostellar envelope and extended cloud. This causes a number of bow shocks and condensations of enhanced density and varying chemistry along the outflow axis. The chemistry in HH2 is thought to be induced by irradiation of the molecular condensation through UV flux from the bright Herbig-Haro object. In such regions especially HCO+ and NH3 should be greatly enhanced according to the models of Viti & Williams (1999).
Table 4 lists the abundances found for the two components of the IRAS2A outflow, calculated as simple ratios between the column densities - taking the CO abundance relative to H2 at constant value of . This means that the quoted abundances for the “wing component” are averaged over material with a large range of velocities. As indicated by the maps and the single-dish line profiles the emission from some of the molecules may be more concentrated toward material with lower velocities. In this sense, the quoted abundances are therefore lower limits to the abundances in the regions where these molecules are observed.
Table 4 also compares the derived abundances to those found for the L1157 and BHR71 outflows (Bachiller & Pérez Gutiérrez, 1997; Garay et al., 1998), the molecular condensation ahead of the HH2 object (Girart et al., 2002) and other types of protostellar environments - in particular the IRAS2A protostellar envelope (Jørgensen et al., 2003b), the “hot component” of the IRAS 16293-2422 envelope (Schöier et al., 2002) and the the “C” position of the dark cloud L134N (Dickens et al., 2000). The abundances in the IRAS 16293-2422 envelope were derived through detailed radiative transfer of the dust continuum and molecular line data. The CO, CS and HCN abundances quoted are averages over the entire envelope. Since the abundances in the outer part of the envelope may be lower due to freeze-out (see for example discussion for CO in Jørgensen et al. (2002)), the quoted numbers are likely to be lower limits to the abundances in the inner, warm region of the envelope.
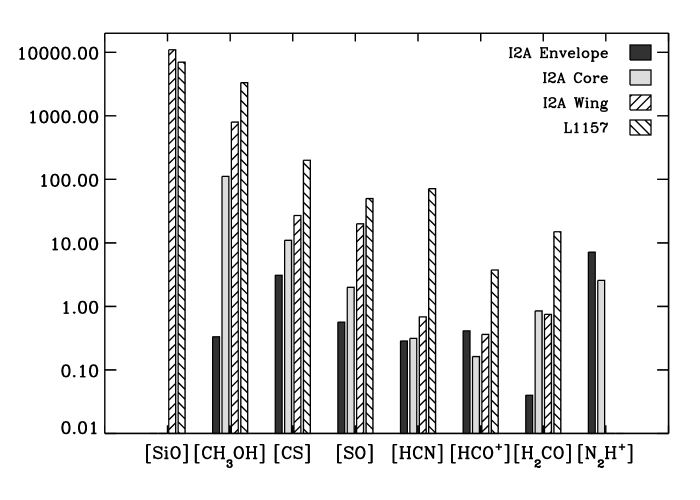
In Fig. 12 the abundances in the two components of the IRAS2A outflow, in the IRAS2A envelope and L1157 outflow are compared. In particular SiO, CH3OH, SO and CS are significantly enhanced by factors 10-104 in the outflow regions compared to the envelope and quiescent dark cloud. The abundances in the IRAS2A wing component and L1157 agree very well for SO and SiO, but the abundances of HCN, H2CO and CS are lower in the IRAS2A outflow by factors of 10-100. The CH3OH abundances are very large for both outflows - between 5 and 10% of that of CO. This is especially significant in comparison with abundances found in the Orion hot core and the low-mass protostar hot core in IRAS 16293-2422. There CH3OH is thought to be enhanced through thermal evaporation off dust grain ice mantles, but its abundance is a factor of 10-100 lower than in the outflow regions. Also the SiO abundances are different between the hot core sources and the outflow regions, whereas the SO abundances are practically identical. For CS and HCN, the abundances have to be significantly higher in the inner regions of IRAS 16293-2422 in order to match the outflow abundances. Compared to the dark cloud, L134N, the CH3OH abundances again stand out as significantly increased, together with CS and SO. HCN and H2CO have similar abundances in the outflow region and the dark cloud whereas HCO+ shows slightly lower abundances in the outflow regions.
| Molecule | IRAS2A corea | IRAS2A winga | L1157b | HH2c | BHR71d | IRAS2A env.e | IR16293f | L134Ng |
|---|---|---|---|---|---|---|---|---|
| CO | =1 | =1 | =1 | =1 | =1 | 2 | 4 | =1 |
| CH3OH | 6.7 | 4.8 | 2 | 2 | 2 | 2 | 3 | 8 |
| CS | 1.1 | 2.7 | 2 | 7 | 6 | 3 | 3 | 1 |
| HCN | 2.2 | 4.8 | 5 | 1 | - | 2 | 1 | 7 |
| HCO+ | 1.3 | 2.9 | 3 | 3 | 9 | 3 | 1 | 8 |
| H2CO | 1.7 | 1.5 | 3 | 2 | - | 8 | 6 | 2 |
| N2H+ | 1.8 | - | - | 5 | 1 | 6 | ||
| SiO | 1.1 | 7 | 7 | 5 | 5 | 1h | ||
| SO | 1.2 | 1.2 | 3 | 8 | - | 3 | 3 | 6 |
Notes: “-” Molecule not observed. “” Molecule observed but not detected.
aCore and wing part of IRAS2A outflow (this paper).
bThe L1157 outflow (Bachiller & Pérez Gutiérrez, 1997)
cThe HH2 molecular condensation (Girart et al., 2002)
dThe BHR71 outflow (Garay et al., 1998)
eThe IRAS2A protostellar envelope (Jørgensen et al., 2002, 2003b)
fThe IRAS 16293-2422 envelope (Schöier et al., 2002). “”
indicate abundances for the warm inner part of the envelope; other
abundances are averages over the entire envelope.
gThe “C” position of the L134N dark cloud (Dickens et al., 2000)
hDerived using upper limits on [SiO]/[HCN] abundance ratio for L134N of 0.0015 from
Ziurys et al. (1989).
5.2 Dynamical time scales
The dynamical time-scale of the east-west outflow can be estimated by assuming that: (1) the terminal velocity of the outflow is equal to the maximal radial velocity of the SiO emission, i.e., 29 km s-1, (2) the rest velocity of the cloud corresponds to the velocity of the narrow non-shocked features ( km s-1), (3) the distance between the tip of the SiO outflow and the continuum position is the full extent of the outflow and (4) the inclination between the plane of the sky and the outflow is small, as its high degree of collimation and extent plus the relatively low observed velocities seem to indicate. With these assumptions one finds a dynamical age:
which is in good agreement with the dynamical timescale of
found by Bachiller et al. (1998) from their CH3OH maps.
The dynamical timescale calculated this way is subject to significant systematic errors. The true extent of the outflow will be , while the terminal velocity of the outflow relates to the observed maximum radial velocity as , modifying the dynamical timescale by a factor . Furthermore the dynamical timescale at best reflects the properties of the outflow at the present moment - changes in the flow velocities throughout the history will similarly change the outflow dynamical timescale. Thus, it is definitely not an unbiased indicator of the age of the driving protostellar source. Still, it agrees well with the timescales derived from comparison between the envelope structure and collapse models (Jørgensen et al., 2003a) and therefore does give an indication of the order of magnitude of the appropriate timescale to be used when discussing the chemical evolution of the shock in the following section.
5.3 Chemical evolution
The above analysis shows that a number of species are significantly enhanced in the outflow region. The various spectral signatures and morphologies in the interferometer maps together with the varying abundances found in the L1157 and IRAS2A outflows indicate different mechanisms regulating the abundances. For the sulfur-bearing species, i.e., CS and SO, the enhancement is thought to occur as a result of enhanced H2S formation as seen in hot cores (Pineau des Forêts et al., 1993; Charnley, 1997). CS and SO show different morphologies in the interferometry maps and different spectral signatures. In particular, CS is present in a narrow high velocity component, while SO only shows up at lower velocities and with more compact emission. In this context the differences and similarities between the abundances found in the L1157 and IRAS2A outflows are also interesting (see Fig. 12): SiO and SO are seen to be quite similar in the L1157 outflow and IRAS2A wing component, while CS, H2CO and HCN are found to be 10 to 100 times more abundant in the L1157 outflow. An explanation could be differences in the abundances of atomic carbon: the production of CS is increased with a higher abundance of atomic carbon, whereas the SO is more closely related to the oxygen abundance (e.g., van Dishoeck & Blake, 1998). In models for gas-phase chemistry, CS, HCN and H2CO are all enhanced with higher abundances of atomic carbon, thus potentially explaining the difference between the IRAS2A and L1157 outflows. The atomic carbon could either be produced in the shock itself or by photodissociation of CO in the pre-shocked gas (e.g., as in the case of IC 443, Keene et al., 1996).
The enhancement of SiO is thought to be caused by atomic silicon sputtering from the surfaces of dust grains and quickly forming SiO in the gas-phase through reactions with OH (e.g., Schilke et al., 1997; Caselli et al., 1997; Pineau des Forêts et al., 1997). CH3OH, H2CO and HCN, in contrast, are most likely enhanced through direct evaporation of ice mantles. Alternative explanations, e.g., gas-phase reactions between CH and H2O forming CH3OH only produce CH3OH abundances of (e.g., Millar et al., 1991), significantly lower than those found in the outflow regions of (this paper, Bachiller et al., 1995; Bachiller & Pérez Gutiérrez, 1997; Bachiller et al., 1998). The spectral signatures of CH3OH compared to SiO indicate that it is formed at lower velocities. Furthermore, it is seen that CH3OH peaks slightly further downstream compared to, e.g., SiO in the interferometer maps. This is clearly illustrated in Fig. 13 where the intensities of SiO, CH3OH and HCO+ are compared along the outflow propagation axis. Garay et al. (2000) analyzed regions of different shock velocities in the outflow associated with NGC 2071 and found that CH3OH was most prominent in regions with low shock velocities ( km s-1). Garay et al. suggested that since molecules such as CH3OH, H2CO and HCN are more volatile, they would only be capable of surviving at much lower shock velocities than would, e.g., SiO. Applied to the IRAS2A outflow this explains both the differences in terminal velocities between SiO on the one hand and HCN, H2CO and CH3OH on the other, but also the different “onsets” along the propagation direction between CH3OH and SiO from the interferometer maps as seen in Fig. 13.

The characteristic core-wing structure of the observed lines is similar to that seen in a SiO survey of protostellar outflows by Codella et al. (1999), who argued that it could be an evolutionary effect with the SiO being produced at high velocities and subsequently slowed down toward lower velocities. They argued that it would take years to slow down an outflow-induced shock, which is similar to the time it would take SiO to be destroyed either through direct accretion onto dust grains (Bergin et al., 1998) or through reactions with OH, forming SiO2 (Pineau des Forêts et al., 1997). If this picture applies to the IRAS2A outflow, it is not surprising that SiO has low abundances in the “core component” - or ambient cloud. Since the SiO destruction timescale is similar to the dissipation timescale for the protostellar shock, SiO is almost completely destroyed in the slow-down phase and will therefore not be seen in the low-velocity/quiescent component. On the other hand, since SiO is created as a direct result of the shock impact (Pineau des Forêts et al., 1997; Schilke et al., 1997), it traces the highest velocities in the outflow, together with CO. The characteristic molecular depletion timescale at densities of cm-3 typical of the outflow region (Sect. 4.3) is on the order of 103 years, comparable to the outflow dynamical timescale, and could therefore explain why, e.g., SiO and CH3OH are not observed over the entire extent of the outflow back to the central protostar.
The differences between the hot core/warm envelope and outflow abundances of, e.g., CH3OH and SiO could be caused by differing time scales related to the densities in the differing regions: the density in the hot inner part of protostellar envelopes is higher by 2-3 orders of magnitude than what is found in the outflow regions. This will lead to more rapid destruction of molecules with “anomalous” abundances, e.g., SiO, either through accretion or reactions with other species and therefore also lower abundances in the envelope regions. Of course the mechanisms for producing the given molecules in the first place are also likely to be dependent on the environment, further complicating the picture.
The depletion timescale for CH3OH may also be taken as an important clock related to the HCO+ abundance. As noted previously, HCO+ stands out compared to the other molecules tracing material only in the aftermath of the shock. In the L1157 outflow, HCO+ was only found to be prominent in the part of the outflow close to the driving source. Through chemical models, Bergin et al. (1998) found that HCO+ should be destroyed after the passage of the shock through reactions with H2O (), but increases later as the water abundance reaches lower levels due to freeze-out. This is in fact seen in interferometer data as illustrated in Fig. 13: the emission of HCO+ and CH3OH is almost anticorrelated, with CH3OH being located closer to the “head” of the outflow and HCO+ showing up in the aftermath of the shock. As higher abundances of both CH3OH and H2O are expected to be results of grain mantle evaporation and the timescales for their freeze-out are similar, the HCO+ and CH3OH enhancements should indeed be anticorrelated as seen in Fig. 13.
N2H+, like HCO+, is expected to be destroyed by reactions with H2O. In contrast to HCO+, however, CO may also be important in destroying N2H+ (e.g., Bergin & Langer, 1997; Charnley, 1997). Observational studies of pre- and protostellar objects (e.g., Bergin et al., 2001; Tafalla et al., 2002; Jørgensen et al., 2003a) suggest that N2H+ is enhanced where CO is depleted. The narrowness of the N2H+ lines and the morphology of the emission in the IRAS2A region indicate that this molecule is indeed only tracing the ambient cloud material where CO may be depleted and not the outflowing material where CO is returned to the gas-phase.
6 Conclusion
A (sub)millimeter study of the shock associated with the NGC1333-IRAS2A outflow has been presented. Both single-dish and interferometry line observations are presented, which allows for a detailed discussion of both the physical and chemical properties in the shocked region and the spatial distribution of emitting species. The main findings are as follows:
-
1.
Interferometer observations of the outflow region reveal a distinct morphology with a narrow high velocity feature in CS, SiO and HCN, while the low velocity part traces the more spatially extended material. HCO+ is seen only in the aftermath of the shock, whereas N2H+ shows very narrow lines and does not seem to be present in the outflowing gas.
-
2.
Statistical equilibrium calculations show that the region can be divided into two distinct components: low velocity material in the ambient, quiescent cloud and high velocity material associated with the outflow. It is found that the conditions in the quiescent material are consistent with a temperature of 20 K and density of , while the shocked gas is warmer with a temperature of 70 K and density of . Within these components, however, the physical conditions are remarkably homogeneous as indicated by the similarities between the lineshapes for different transitions of various molecules and between the wing emission in spectra from interferometry and single-dish observations.
-
3.
The chemistry in the outflow and quiescent regions are significantly different. CH3OH, SiO and the sulfur-bearing species are significantly enhanced in the outflowing gas, whereas HCN, H2CO, HCO+ and N2H+ show abundances more similar to those found in molecular clouds and protostellar envelopes. Compared to the well-studied L1157 outflow the CS, HCN and H2CO abundances are markedly lower. This could be due to differences in the amount of atomic carbon in the shocked or pre-shocked gas. Higher abundances of the shock-tracing molecules (in particular SiO and CH3OH) in outflows compared to the inner warm envelopes may be related to more rapid destruction of these molecules in the envelopes where the densities are higher.
-
4.
A scenario is suggested where the highly collimated protostellar outflow is progressing into a region with a steep density gradient, focusing the shock and giving rise to the narrow morphology observed. This leads to a shock-induced chemistry, which can explain both the morphologies and qualitatively the abundances of the different molecules. In particular, CH3OH is seen to be greatly enhanced reaching an abundance of about 5% of the observed CO abundance in the shocked gas. CH3OH is, however, not observed to as high velocities as seen in SiO, possibly as a consequence of CH3OH being more volatile. Thus together with, e.g., HCN and H2CO, CH3OH is not able to survive at higher velocities.
This work illustrates the large impact of protostellar outflows in shaping the physical and chemical properties of their parental environment. The combination of high-resolution interferometer observations and single-dish spectra makes it possible to address the physical and chemical conditions in the shocked and ambient gas and to investigate the spatial variation and time-scales characteristic for the shock induced chemistry. So-far only a few shocks have been studied in great chemical detail. Similar systematic studies of a large number of different outflows will allow for a more detailed comparison between outflows and shocks of different velocities and energetics and in different environments. Future observations with facilities such as the SMA, CARMA, and ALMA will allow further studies of the variation of physical and chemical conditions in shocks through high resolution, high sensitivity multi-transition molecular line observations. Also high spatial resolution observations of H2O lines with Herschel-HIFI can confirm the anticorrelation between HCO+ and H2O. All such more detailed observational studies will serve as important starting points for more detailed physical and chemical models for shocks in protostellar environments.
Acknowledgements.
We thank the referee for a prompt and well-considered report. The research of JKJ is funded by the Netherlands Research School for Astronomy (NOVA) through a network 2 Ph.D. stipend and research in astrochemistry in Leiden is supported by a Spinoza grant. GAB acknowledges support from the NASA Origins of Solar Systems program. FLS further acknowledges financial support from the Swedish Research Council.References
- Bachiller et al. (1998) Bachiller, R., Codella, C., Colomer, F., Liechti, S., & Walmsley, C. M. 1998, A&A, 335, 266
- Bachiller et al. (1995) Bachiller, R., Liechti, S., Walmsley, C. M., & Colomer, F. 1995, A&A, 295, L51
- Bachiller et al. (2001) Bachiller, R., Pérez Gutiérrez, M., Kumar, M. S. N., & Tafalla, M. 2001, A&A, 372, 899
- Bachiller & Pérez Gutiérrez (1997) Bachiller, R. & Pérez Gutiérrez, M. 1997, ApJ, 487, L93
- Bergin et al. (2001) Bergin, E. A., Ciardi, D. R., Lada, C. J., Alves, J., & Lada, E. A. 2001, ApJ, 557, 209
- Bergin & Langer (1997) Bergin, E. A. & Langer, W. D. 1997, ApJ, 486, 316
- Bergin et al. (1998) Bergin, E. A., Neufeld, D. A., & Melnick, G. J. 1998, ApJ, 499, 777
- Blake (1996) Blake, G. A. 1996, in IAU Symp. 178: Molecules in Astrophysics: Probes & Processes, ed. E.F. van Dishoeck (Kluwer Academic Publishers, Dordrecht)
- Caselli et al. (1997) Caselli, P., Hartquist, T. W., & Havnes, O. 1997, A&A, 322, 296
- Cazaux et al. (2003) Cazaux, S., Tielens, A. G. G. M., Ceccarelli, C., et al. 2003, ApJ, 593, L51
- Ceccarelli et al. (2000a) Ceccarelli, C., Castets, A., Caux, E., et al. 2000a, A&A, 355, 1129
- Ceccarelli et al. (2000b) Ceccarelli, C., Loinard, L., Castets, A., Tielens, A. G. G. M., & Caux, E. 2000b, A&A, 357, L9
- Charnley (1997) Charnley, S. B. 1997, ApJ, 481, 396
- Codella et al. (1999) Codella, C., Bachiller, R., & Reipurth, B. 1999, A&A, 343, 585
- Dickens et al. (2000) Dickens, J. E., Irvine, W. M., Snell, R. L., et al. 2000, ApJ, 542, 870
- Engargiola & Plambeck (1999) Engargiola, G. & Plambeck, R. L. 1999, in The Physics and Chemistry of the Interstellar Medium, Proceedings of the 3rd Cologne-Zermatt Symposium, ed. V. Ossenkopf, J. Stutzki, and G. Winnewisser (GCA-Verlag, Herdecke), 291
- Garay et al. (1998) Garay, G., Köhnenkamp, I., Bourke, T. L., Rodríguez, L. F., & Lehtinen, K. K. 1998, ApJ, 509, 768
- Garay et al. (2002) Garay, G., Mardones, D., Rodríguez, L. F., Caselli, P., & Bourke, T. L. 2002, ApJ, 567, 980
- Garay et al. (2000) Garay, G., Mardones, D., & Rodríguez, L. F. 2000, ApJ, 545, 861
- Girart et al. (2002) Girart, J. M., Viti, S., Williams, D. A., Estalella, R., & Ho, P. T. P. 2002, A&A, 388, 1004
- Jansen et al. (1994) Jansen, D. J., van Dishoeck, E. F., & Black, J. H. 1994, A&A, 282, 605
- Jennings et al. (1987) Jennings, R. E., Cameron, D. H. M., Cudlip, W., & Hirst, C. J. 1987, MNRAS, 226, 461
- Jørgensen et al. (2003a) Jørgensen, J. K., Hogerheijde, M. R., van Dishoeck, E. F., Blake, G. A., & Schöier, F. L. 2003a, A&A, in press.
- Jørgensen et al. (2002) Jørgensen, J. K., Schöier, F. L., & van Dishoeck, E. F. 2002, A&A, 389, 908
- Jørgensen et al. (2003b) Jørgensen, J. K., Schöier, F. L., & van Dishoeck, E. F. 2003b, A&A, submitted
- Keene et al. (1996) Keene, J., Phillips, T. G., & van Dishoeck, E. F. 1996, in IAU Symp. 170: CO: Twenty-Five Years of Millimeter-Wave Spectroscopy, ed. W. B. Latter, S. J. E. Radford, P. R. Jewell, J. G. Mangum, and J. Bally (Kluwer Academic Publishers, Dordrecht), 382
- Knee & Sandell (2000) Knee, L. B. G. & Sandell, G. 2000, A&A, 361, 671
- Langer et al. (1996) Langer, W. D., Castets, A., & Lefloch, B. 1996, ApJ, 471, L111
- Liseau et al. (1988) Liseau, R., Sandell, G., & Knee, L. B. G. 1988, A&A, 192, 153
- Looney et al. (2000) Looney, L. W., Mundy, L. G., & Welch, W. J. 2000, ApJ, 529, 477
- Martin-Pintado et al. (1992) Martin-Pintado, J., Bachiller, R., & Fuente, A. 1992, A&A, 254, 315
- Millar et al. (1991) Millar, T. J., Herbst, E., & Charnley, S. B. 1991, ApJ, 369, 147
- Pineau des Forêts et al. (1997) Pineau des Forêts, G., Flower, D. R., & Chièze, J.-P. 1997, in IAU Symp. 182: Herbig-Haro Flows and the Birth of Stars, ed. B. Reipurth & C. Bertout (Kluwer Academic Publishers, Dordrecht)
- Pineau des Forêts et al. (1993) Pineau des Forêts, G., Roueff, E., Schilke, P., & Flower, D. R. 1993, MNRAS, 262, 915
- Reipurth & Raga (1999) Reipurth, B. & Raga, A. C. 1999, in The Origin of Stars and Planetary Systems, ed. C. J. Lada & N. D. Kylafis (Kluwer Academic Publishers, Dordrecht)
- Sandell et al. (1994) Sandell, G., Knee, L. B. G., Aspin, C., Robson, I. E., & Russell, A. P. G. 1994, A&A, 285, L1
- Sault et al. (1995) Sault, R. J., Teuben, P. J., & Wright, M. C. H. 1995, in Astronomical Data Analysis Software and Systems IV, ed. R.A. Shaw, H.E. Payne and J.J.E. Hayes, PASP Conf Series 77, 433
- Schilke et al. (1997) Schilke, P., Walmsley, C. M., Pineau des Forets, G., & Flower, D. R. 1997, A&A, 321, 293
- Schöier et al. (2002) Schöier, F. L., Jørgensen, J. K., van Dishoeck, E. F., & Blake, G. A. 2002, A&A, 390, 1001
- Schöier et al. (2003) Schöier, F. L., van der Tak, F. F. S., van Dishoeck, E. F., & Black, J. H. 2003, A&A, submitted
- Scoville et al. (1993) Scoville, N. Z., Carlstrom, J. E., Chandler, C. J., et al. 1993, PASP, 105, 1482
- Tafalla et al. (2002) Tafalla, M., Myers, P. C., Caselli, P., Walmsley, C. M., & Comito, C. 2002, ApJ, 569, 815
- Tielens (1999) Tielens, A. G. G. M. 1999, in Formation and Evolution of Solids in Space, ed. J. M. Greenberg & A. Li. (Kluwer Academic Publishers, Dordrecht), 331
- van Dishoeck & Blake (1998) van Dishoeck, E. F. & Blake, G. A. 1998, ARA&A, 36, 317
- Viti & Williams (1999) Viti, S. & Williams, D. A. 1999, MNRAS, 310, 517
- Ziurys et al. (1989) Ziurys, L. M., Friberg, P., & Irvine, W. M. 1989, ApJ, 343, 201