Quasar host galaxy star formation activity from
multicolour data
††thanks: Based on observations made at the European Southern Observatory,
La Silla, Chile, and on observations made with the Nordic
Optical Telescope, La Palma.
Abstract
We investigate multicolour imaging data of a complete sample of 19 low redshift () quasar host galaxies. The sample was imaged in four optical (BVRi) and three near-infrared bands (JHKs). Galaxy types, structural parameters and robust host galaxy luminosities are extracted for all bands by means of two-dimensional deblending of galaxy and nucleus. For the disc dominated fraction of host galaxies (Sa and later) the optical and optical-to-NIR colours agree well with the average colours of inactive galaxies of same type. The bulge dominated galaxies (E/S0) on the other hand appear a significant 0.35 mag bluer in than their inactive counterparts, being as blue as the discs in the sample. This trend is confirmed by fitting population synthesis models to the extracted broad band SEDs: the stellar population age of the bulge dominated hosts lies around a few Gyr, much younger than expected for old evolved ellipticals. Comparison to other studies suggests a strong trend for stellar age in elliptical host galaxies with luminosity. Intermediately luminous elliptical hosts have comparably young populations, either intrinsically or from an enhanced star formation rate potentially due to interaction, the most luminous and massive ellipticals on the contrary show old populations. The correspondence between the nuclear activity and the blue colours suggests a connection between galaxy interaction, induced star formation and the triggering of nuclear activity. However, the existence of very symmetric and undisturbed disks and elliptical host galaxies emphasised that other mechanisms like minor merging or gas accretion must exist.
keywords:
galaxies: active – galaxies: fundamental parameters – galaxies: photometry – quasars: general1 Introduction
Since the discovery of massive black holes in the centres of normal galaxies and an identical relation between bulge and black hole mass for active and inactive, quasar host galaxies start to be accepted as not-so-different members of the galaxy population than previously thought. The question remains how different quasar hosts are from ‘normal’ galaxies. Is a quasar phase part of every host galaxies life? The connection of the masses of galactic bulges and central black holes suggests a common evolutionary path. Nuclear activity might thus be a special phase of black hole fuelling. Obvious candidates for triggering active galactic nuclei (AGN) include major and minor merger in the scenario of hierarchical clustering, as well as internal instabilities. The effects of these events in the shape of nuclear activity and, potentially, enhanced induced star formation thus might give an opportunity to study a generic phase in the evolutionary cycle of galaxies.
Single optical or near infrared (NIR) bands are generally sufficient to characterise morphological properties like galaxy types, host and nuclear luminosities, or to conduct environment studies (e.g. McLeod & Rieke, 1995b; McLure et al., 1999). It was also attempted to detect and quantify events of merging or interaction from pure morphology of the visible host galaxy (e.g. Hutchings & Neff, 1992).
To assess the dominant stellar populations in the host, spectral information is needed. While one optical colour already permits a characterisation of young stellar populations, the restframe NIR on the other hand holds information about the old stars, dominating the host in mass.
Ideally, spectra of the host galaxy would be needed, spanning all the optical and NIR domains. However, due to the unavoidable contamination of the final host galaxy spectrum with a nuclear component, increasing with decreasing angular resolution, spectroscopy is so far of limited use for luminous quasars (QSOs), already at low redshifts.
With this study we attempt to assemble spectral information on quasar hosts by combining optical and NIR broad band data (as first performed by Kotilainen & Ward, 1994). At the price of a coarse sampling of the SED compared to spectroscopy, the deblending of nuclear and stellar components in broad band images is by now a robust and reliable technique.
In the present paper we present multicolour data for a complete sample of low redshift quasars. The sample selection and observations are described in Section 2. The deblending into nuclear and host contributions is presented in Section 3, followed by a description of the photometry (Sect. 4). In Section 5 we discuss the results, including notes on individual objects. The derived host galaxy colours are compared to those of inactive galaxies in Section 6, while Section 7 contains results from simple stellar population model fits. In Sections 8 and 9 we present an overall discussion and some conclusions.
Throughout this article we use a cosmology with km s-1 Mpc-1, and .
2 Sample and observations
| Object | Alternate name | Radio properties | |||
|---|---|---|---|---|---|
| HE 0952–1552 | 0.108 | 15.8 | -23.3 | RQ | |
| HE 1019–1414 | 0.077 | 16.1 | -22.3 | RI | |
| HE 1020–1022 | PKS 1020–103 | 0.197 | 16.6 | -23.9 | RL |
| HE 1029–1401 | 0.085 | 13.7 | -24.9 | RQ | |
| HE 1043–1346 | 0.068 | 15.7 | -22.5 | RQ? | |
| HE 1110–1910 | 0.111 | 16.0 | -23.2 | RQ | |
| HE 1201–2409 | 0.137 | 16.3 | -23.5 | RQ | |
| HE 1228–1637 | 0.102 | 15.8 | -23.2 | RQ | |
| HE 1237–2252 | 0.096 | 15.9 | -23.0 | RQ | |
| HE 1239–2426 | 0.082 | 15.6 | -23.0 | RQ | |
| HE 1254–0934 | 0.139 | 14.9 | -24.7 | RI | |
| HE 1300–1325 | R 12.01 | 0.047 | 14.9 | -22.5 | RQ? |
| HE 1310–1051 | PG 1310–1051 | 0.034 | 14.9 | -21.7 | RQ? |
| HE 1315–1028 | 0.099 | 16.8 | -22.1 | RQ | |
| HE 1335–0847 | 0.080 | 16.3 | -22.3 | RQ | |
| HE 1338–1423 | R 14.01 | 0.041 | 13.7 | -23.3 | RQ? |
| HE 1405–1545 | 0.194 | 16.2 | -24.2 | RQ | |
| HE 1416–1256 | PG 1416–1256 | 0.129 | 16.4 | -23.2 | RI |
| HE 1434–1600 | 0.144 | 15.7 | -24.1 | RL |
We compiled a sample of 19 objects with , drawn from the Hamburg/ESO survey (HES, Reimers et al., 1996; Wisotzki et al., 1996, 2000). The sample is statistically complete, comprising all quasars above a well-defined flux limit from a sky area of 611 deg2. It is a low- subset of the sample defined by Köhler et al. (1997) to study the luminosity function of quasar nuclei. Its distribution in redshifts and absolute magnitudes is shown in Fig. 1. The sample represents QSOs of moderate optical luminosities when compared to the total population at all redshifts. The radio properties of the sample have recently been determined with the VLA (Gopal-Krishna et al. in preparation). We classified the objects along the definition by Kellermann et al. (1989), using the ratio of (nuclear) radio-to-optical fluxes, and the three classes of radio-quiet (), radio-intermediate () and radio-loud objects (). For the four lowest redshift objects () no radio information is available, but since the sample is optically selected, they are likely to be radio quiet. Two objects in the sample are radio-loud, three are radio-intermediate, the rest is radio quiet. Table 1 lists the objects, redshifts, apparent and absolute magnitude and the radio properties.

In order to evenly sample the spectral energy distribution (SED) from the optical to the NIR, we imaged the 19 objects of the sample in seven filters: Johnson B, Bessel V and R, Gunn i in the optical, and J, H, and in the NIR (from now on referred to as BVRIJHK for simplicity). The three NIR bands are primarily sensitive to the old stellar populations in the host galaxy, while the optical bands are trace the continuum of young stars. As a bonus, this even sampling of the SED will allow to compare the properties of this sample to those at higher redshifts without the need for -corrections.
| Band | Instrument | [s] | Scale | |
|---|---|---|---|---|
| B | ESO 3.6m/EFOSC2 | 12 | 30 | 061 |
| B | ESO 3.6m/EFOSC1 | 3 | 30 | 034 |
| B | ESO 1.54m/DFOSC | 2 | 380/730 | 039 |
| B | NOT/ALFOSC | 2 | 1000/1200 | 019 |
| V,R,i | ESO 1.54m/DFOSC | 19 | 300–1200 | 039 |
| J,H,Ks | ESO NTT/Sofi | 19 | 160–900 | 029 |
For the majority of the observations ESO telescopes were used. The optical data were mainly obtained with DFOSC at the 1.54m Danish telescope, supplemented by -band images from Jahnke & Wisotzki (2003). Two additional frames were obtained with ALFOSC at the 2.5m Nordic Optical Telescope (NOT) on La Palma. All NIR data were taken with the ESO NTT and SOFI. Table 2 gives a summary of the telescopes used, as well as typical integration times and instrumental pixel scales.
The images in the , , and NIR bandpasses reach similar surface brightness levels for most objects. This is different for the EFOSC1/2 -band images, which were originally taken as acquisition frames for spectroscopy. With their integration time of only 30 s they are much shallower than the rest of the data and were exchanged for deeper images from other campaigns in four cases.
2.1 Data reduction
For data reduction in the optical , , and -bands we created flatfield frames from the object frames themselves (‘superflats’). The object fields are sufficiently empty and contained enough sky background for this task, yielding higher quality flatfields than normal twilight sky flats which were also taken. For the ALFOSC and EFOSC -band images twilight and dome flats were used, respectively. Bias frames were obtained nightly in all cases. Otherwise a standard reduction procedure was followed.
The NTT/SOFI NIR data suffered from a detector peculiarity, a time and illumination dependent bias pattern. Theoretically, the spatially variable bias in NIR arrays is – under standard conditions – automatically removed when subtracting a sky frame from the data frame, thus the bias is spatially variable but the pattern stable in time. On the other hand, the SOFI chip/controller unit used produced a bias pattern that depended on the time since last reset and on the illumination level, thus on the amount of sky background. Since at the time of reduction the effect was not finally investigated by ESO, we developed a special reduction procedure that was able to remove these patterns with in most cases negligible residual structures.
For all objects and bands – except EFOSC1/2 -band data and the optical bands of HE 1434–1600 – more than one image per band was observed with the individual frames dithered by some tens of arcseconds between integrations. Variance weighted stacking plus rejection of outlier pixel values for these dithered frames allowed to remove artefacts created by cosmic ray hits, dead columns, hot pixels and other localised errors. The variance weighted stacked images were then further processed by multi-component deblending.
3 Quasar multi-component deblending
The critical step in the image analysis is a proper separation of nuclear and host galaxy components. We created a package for two-dimensional multi-component deblending of quasars by fitting a parametrised host model plus a nuclear contribution. The developement and testing of the algorithms are described in detail by Kuhlbrodt, Wisotzki & Jahnke (2003). For the present sample we chose to use both two and three component models for the QSO, consisting of the nucleus, represented by the PSF, and the host galaxy, represented by one or two analytical two-dimensional functions, convolved with the PSF.
3.1 Model fits
For the PSF model we used an elliptical Moffat function, to allow for non-circular symmetry. This was necessary to model the optical distortions of the focal reducer-type instruments EFOSC, DFOSC and ALFOSC. Several stars in each field were used to define the PSF.
The PSF model fit yields the best estimate for the shape of the PSF, thus the shape of the QSO nucleus. In the following second step the amount of flux contained in the nucleus is fitted simultaneously with the shape and flux of the host galaxy component. The latter is represented by an analytic galaxy model consisting of either a de Vaucouleurs spheroidal (de Vaucouleurs, 1948), an exponential disc (Freeman, 1970), or a combination of both:
| (1) | |||||
| (2) |
where is the central surface brightness and the ‘radius’ is a function of and
| (3) |
with , the ellipticity and the position angle of the isophotes. In this form the scale length is always the radius of the isophote containing half of the total flux.
The galaxy models are convolved numerically with the PSF to incorporate the effect of the seeing also for the host. As a result of the deblending fit we receive models of nucleus and host component(s).
We restricted the pixels used for deblending to a region of interest defined as an elliptical anullus centred on the nucleus. This was chosen to be large enough to contain all visible flux of the object (99 per cent) or, as in the case of HE 1043–1346 (see Fig. 3), was restricted to the central region where the host has a well defined structure, excluding the spiral arms further out. Geometrical or physical companion objects as well as strong asymmetric components like tidal tails were masked out by modifying the variance frame. These areas were excluded from the fit, to satisfy the model assumptions, i.e. a smooth galaxy component.
3.2 Homogeneous treatment for all bands
In order to guarantee for a consistent procedure in all bands of the multicolour sample, identical modelling areas and identical masks were used for all observations of a given object. Only unique artefacts like cosmic ray hits and dead pixels were added to the masks of individual frames. The sky background was adjusted to be zero in an annulus around the object in each frame, determined from curve-of-growth analysis. Thus background variations within the frame were accounted for.
One important fact for the deblending is the strongly rising sky brightness from B to K-band. This yields a different relative weight or S/N of low count (host outskirts) and high count (central) areas of the quasar when using formal variances. This will have an influence on the deblending: Even if identical physical surface brightness distributions were present in, e.g., the and -bands, the outskirts of the host will have a larger weight in the deblending fit in than in , and vice versa for the nucleus.
However, simulations with different weighting schemes other than using formal variances resulted in no convincing recipe for weights, and thus we stayed with formal variances. Nevertheless, this aspect has to be borne in mind when comparing optical and NIR data of an object.
In order to minimise the influence of this effect on the deblending process in the different bands, we decided to use two consecutive quasar deblending iterations. In a first iteration we left all model parameters free. We then determined global values of the scale lengths , ellipticities and position angles , valid for all bands. In the second iteration these parameters were fixed for the deblending, with only the fluxes of nucleus and host components as free parameters, thus forcing identical host geometry. We discuss the validity and implications of this approach in section 5.1.
4 Photometry
The multi-component deblending procedure yields models for host galaxies as well as the nuclei. We decided whether a given host galaxy is disc or spheroid dominated on the basis of the results of the model fits, and by visual inspection of the residual images and radial profiles after model subtraction. The model then gave the overall morphological parameters of the host.
For photometry of the host the model of the nucleus was used to subtract the nuclear light contribution from the composite quasar image, resulting in a host galaxy frame containing all asymmetries, spiral arms, etc. This method has an advantage over simply integrating the galaxy model as has been done in the past (e.g. Taylor et al., 1996; Schade et al., 2000). Asymmetries like arms or tidal distortions can be accounted for in this way. Also deblending errors for the galaxy, e.g. in scale length, might have a negligible effect on the nuclear flux, but can be magnified when the model is directly integrated. Especially in cases where the type of the galaxy cannot be firmly established this becomes be a problem. Fits with a spheroidal model will yield, when integrated, 0.5–1.5 mag systematically higher fluxes than the best fitting exponential disc model (Abraham et al., 1992).
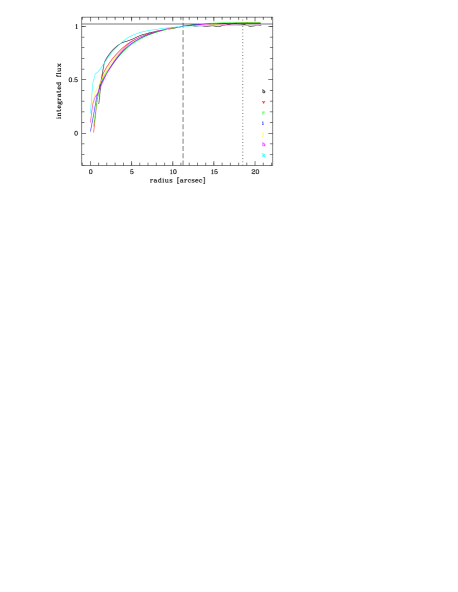
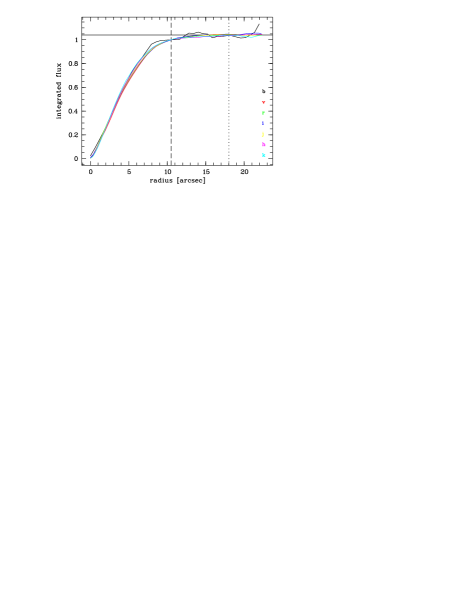
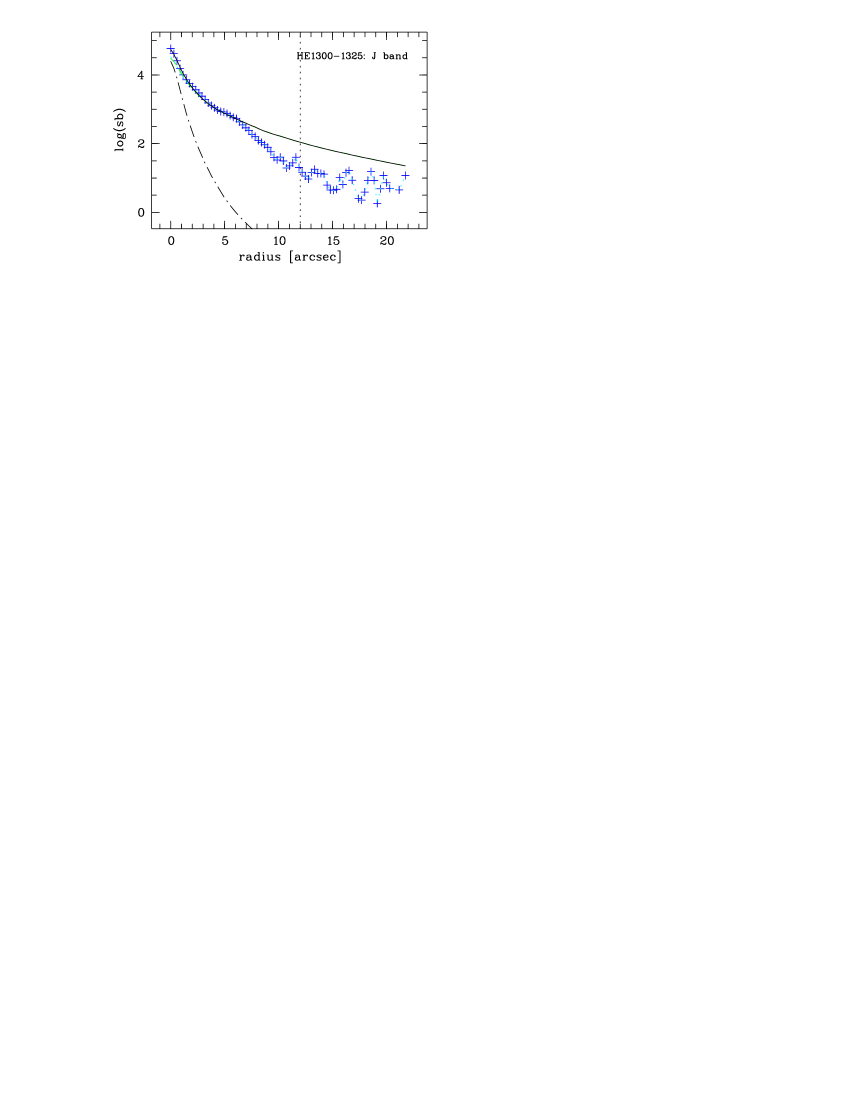
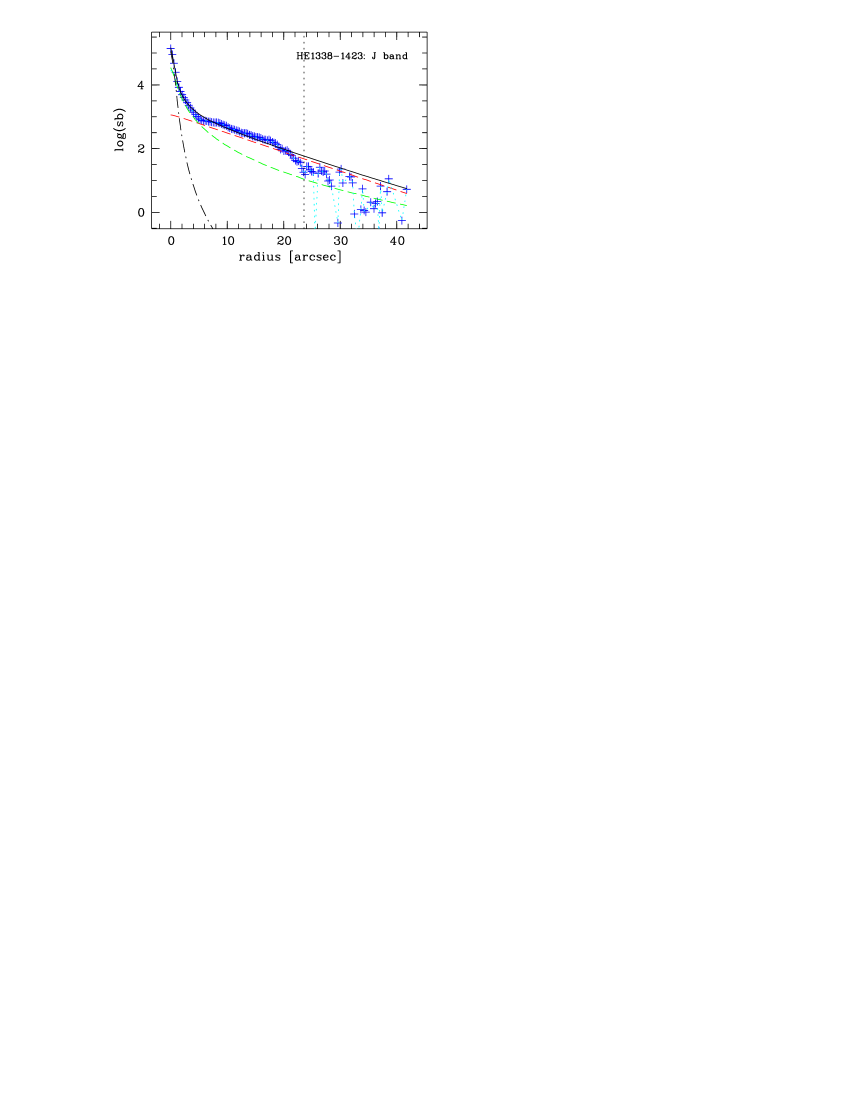
Photometry of the host image was done via aperture photometry. The aperture used was an ellipse with the ellipticity and position angle of the modelled host, and thus fixed for all frames of a given object. The size of the aperture was chosen to minimise errors from background noise. Since the observations in the different bands are, in general, of different depths, curves of growth of the host flux will begin to be dominated by background noise at different radii for different bands. We adopted an aperture correction procedure by defining two radii for photometry (cf. Fig. 2): One radius, , typically containing 90–98 per cent of the total flux, was chosen such that the curves of growth in all bands would not deviate much from each other at larger radii, if the curves of growth were normalised at this radius. A second radius, , was chosen at which the curve of growth of the band(s) with the highest S/N would converge. The flux in this band inside was taken as 100 per cent of the host flux, and the fraction of flux inside was determined. The fraction of flux contained inside for this band was then assumed to be valid for all bands, and the total flux computed from the value inside . This again assumes identical profile shapes and scale lengths in all bands (see Sect. 5.1) but has the advantage of a homogenous treatment independent of S/N.
Photometric calibration was performed using photometric standard stars observed during the runs. The B-band data taken with EFOSC/EFOSC2 was calibrated using the original photometry from Köhler et al. (1997), with updated galactic dust extinction values. We used the values from Schlegel et al. (1998), and applied a correction in all bands. We also applied airmass corrections in the and -band using average La Silla extinction coefficients.
| Band | [mag/] | ||
|---|---|---|---|
| nucleus | spheroid | disc (Sb) | |
| 5.0 | 3.25 | ||
| –0.99 | 2.25 | 1.0 | |
| 1.0 | 0.75 | ||
| 0.75 | 0.5 | ||
| 0.25 | 0.15 | ||
| –1.25 | –0.25 | –0.25 | |
| –2.4 | –2.4 | ||
Conversion to absolute magnitudes required K-correction terms, which we applied separately to quasar nuclei and hosts. For the nucleus we used the average quasar SED as published by Elvis et al. (1994). For , a linear relation is a good description, for all relevant bands. For the host we used the K-correction terms published by Fukugita et al. (1995) in the optical and Mannucci et al. (2001) in the NIR. We adopted separate values for predominantly spheroidal and disc hosts, for the latter we assumed intermediate type Sb discs. In H and K the differences between E and Sb galaxies are negligible. We again approximate the K-correction as a linear function of , which yields errors less than 0.05 mag in all bands for . The adopted values are compiled in Table 3.
5 Deblending results and analysis
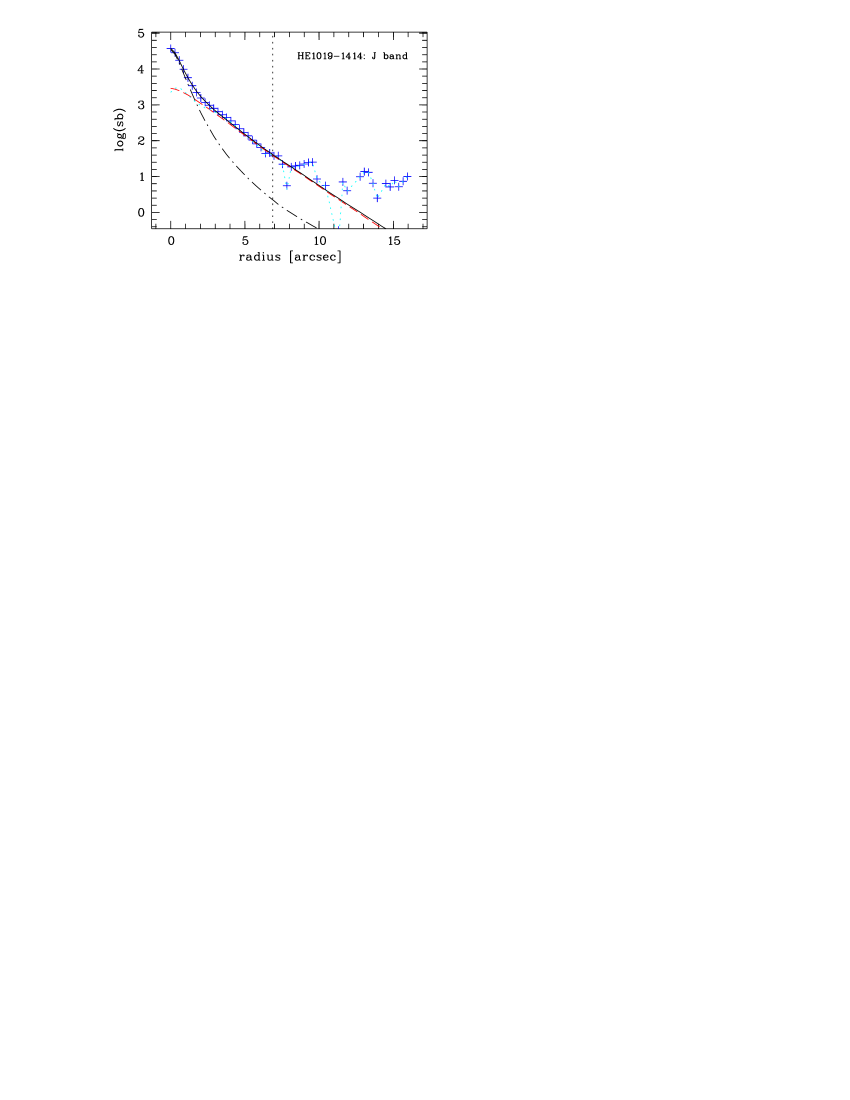
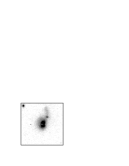
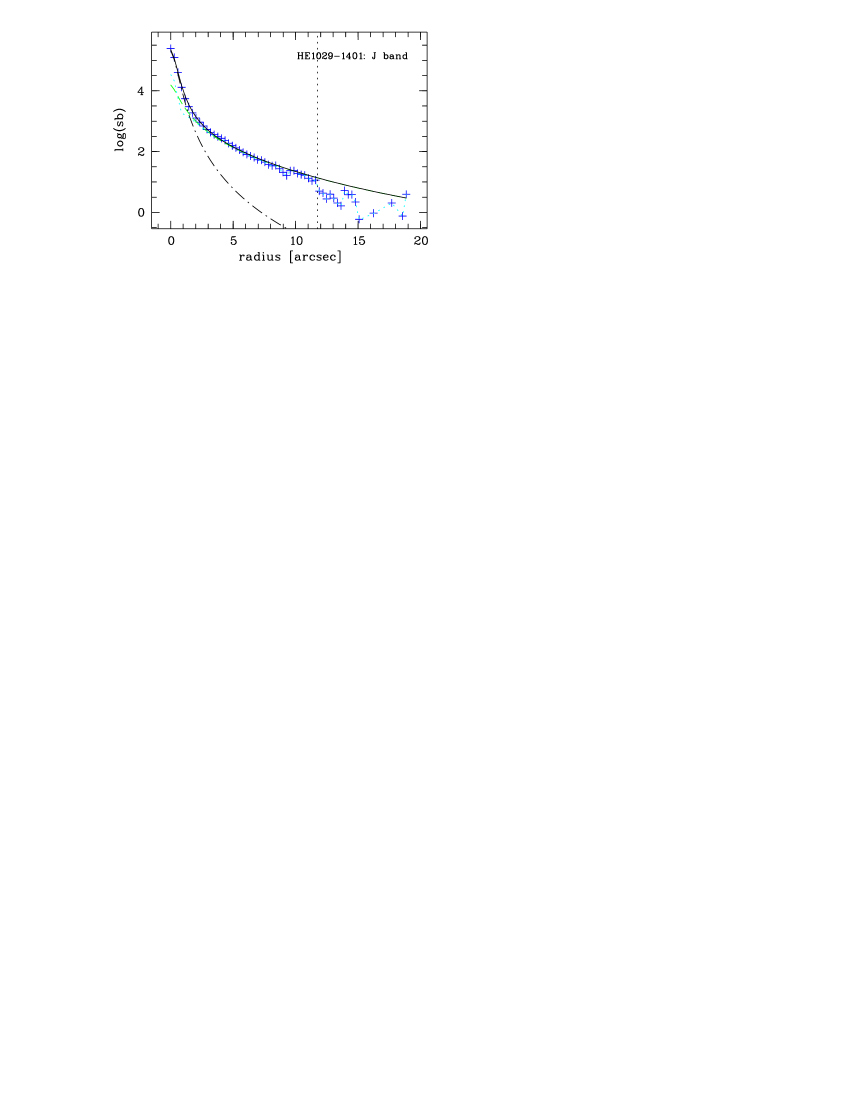
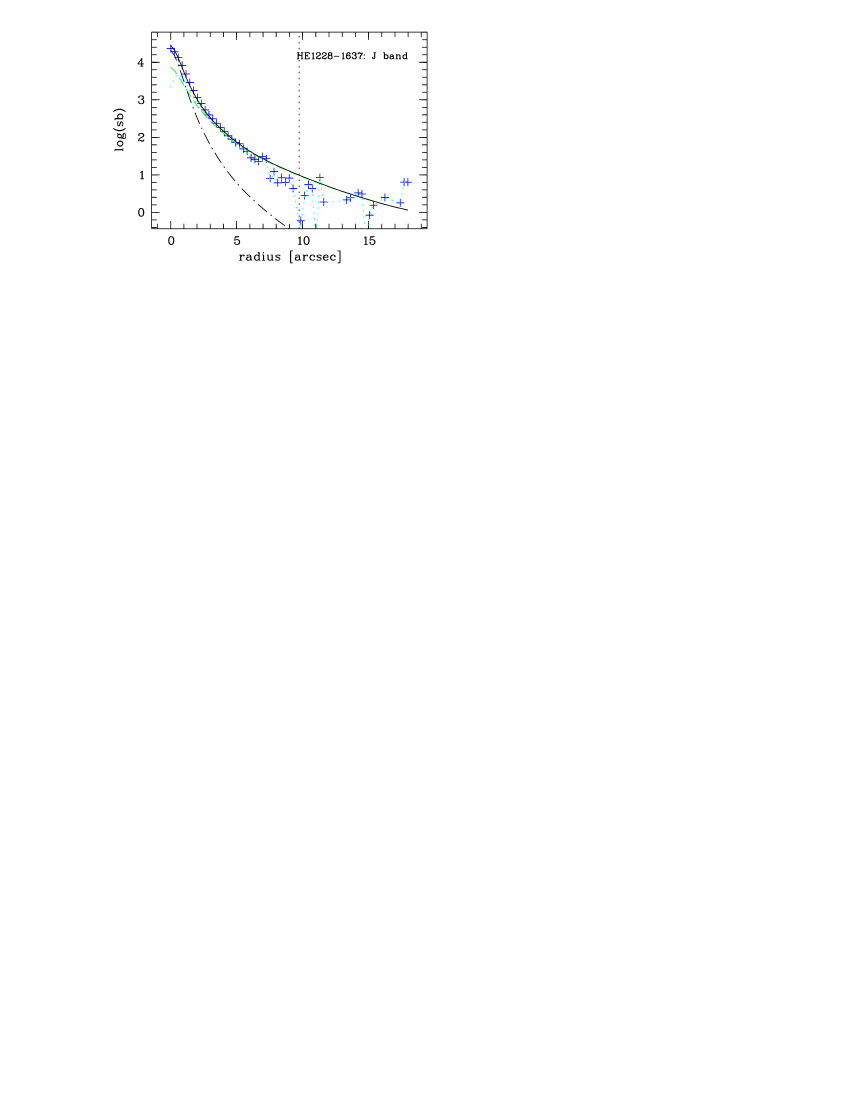
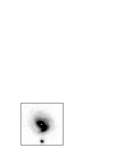
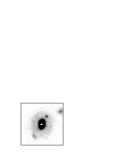
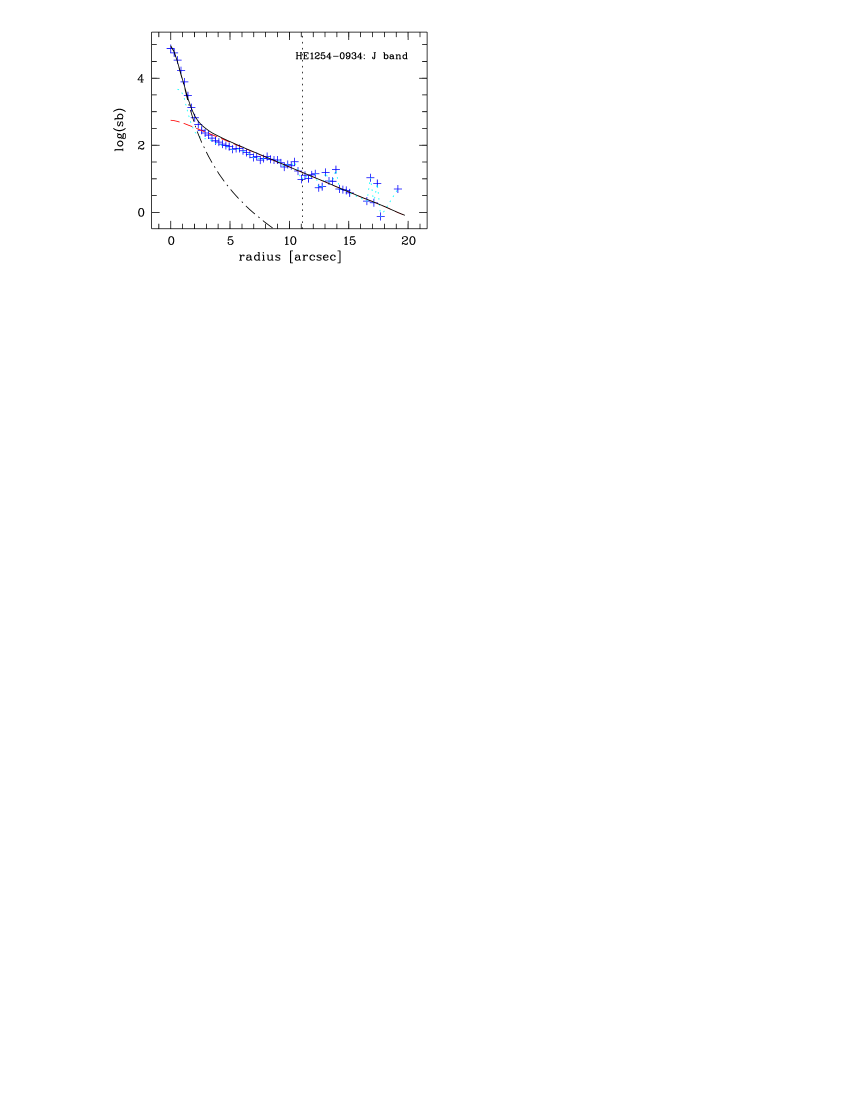
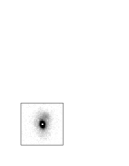
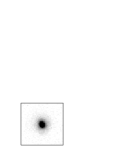
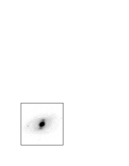
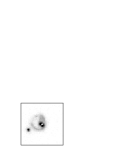
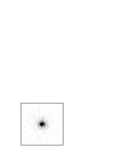
We clearly resolve all host galaxies in all bands. Figure 3 shows, for each object, a grey scale plot of the host galaxy after subtraction of the nuclear model, as well as the radial azimuthally averaged profiles of the different components.


| Object | Type | [kpc] | [∘] | [∘] | N/H(V) | N/H(H) | |
|---|---|---|---|---|---|---|---|
| HE 0952–1552 | D | 6.8 | 0.33 | 48.0 | 175.9 | 1.17 | 0.59 |
| HE 1019–1414 | D | 5.0 | 0.26 | 42.3 | 147.1 | 1.54 | 1.36 |
| HE 1020–1022 | E | 10.4 | 0.28 | 132.6 | 1.53 | 1.28 | |
| HE 1029–1401 | E | 4.2 | 0.0 | – | 3.86 | 2.53 | |
| HE 1043–1346 | D | 6.7 | 0.32 | 47.2 | 102.7 | 0.25 | 0.42 |
| HE 1110–1910 | E | 5.6 | 0.24 | 14.2 | 1.39 | 1.33 | |
| HE 1201–2409 | E | 1.5 | 0.29 | 8.4 | 0.50 | 0.66 | |
| HE 1228–1637 | E | 3.5 | 0.15 | 62.6 | 1.41 | 1.57 | |
| HE 1237–2252 | D | 9.9 | 0.16 | 32.9 | 39.4 | 0.34 | 0.28 |
| HE 1239–2426 | D | 9.2 | 0.22 | 38.7 | 162.7 | 0.48 | 0.85 |
| HE 1254–0934 | D | 16.0 | 0.28 | 43.9 | 95.5 | 6.18 | 4.77 |
| HE 1300–1325 | E | 4.9 | 0.39 | 34.0 | 0.36 | 0.19 | |
| HE 1310–1051 | D | 3.5 | 0.11 | 27.1 | 88.7 | 1.54 | 1.21 |
| HE 1315–1028 | D | 8.1 | 0.47 | 58.0 | 1.3 | 1.03 | 0.93 |
| HE 1335–0847 | E | 5.0 | 0.19 | 22.0 | 0.57 | 0.43 | |
| HE 1338–1423 | D | 13.7 | 0.43 | 55.2 | 105.0 | 0.93 | 0.31 |
| B | 4.6 | 0.33 | 145.3 | 0.93 | 0.31 | ||
| HE 1405–1545 | D | 8.8 | 0.35 | 49.5 | 165.0 | 1.28 | 1.11 |
| HE 1416–1256 | E | 6.4 | 0.0 | – | 1.26 | 1.12 | |
| HE 1434–1600 | E | 7.2 | 0.15 | 3.5 | 1.44 | 1.04 |
In the VRIJHK bands the deblending was successful and straightforward for all objects. The EFOSC -band data were more troublesome and could in general only be modelled with presetting the scale lengths from the other bands. Generally, the integrated flux of the host galaxy is a well constrained parameter, in 2d multi-component deblending. However, alone is less well constrained and strongly correlated with central surface brightness of the host (Abraham et al., 1992; Taylor et al., 1996). With fixed, all but seven of the 19 objects could be modelled also in . In these seven cases the host galaxy can be seen, but the residuals are too large to reliably extract fluxes or morphological parameters. These frames were left out from further analysis.
For 15 of our 133 frames, most of them in the -band, the fixed fit ended with a host model systematically under- or overestimating the data, which was clearly visible in the radial profiles. In these cases the fit was disturbed by imperfections in the PSF definition. A residual PSF mismatch was present in most of these 15 images. We corrected this by rescaling the resulting host models to fit the QSO at radii where the influence of the nucleus was negligible and reran the deblending with the host model fixed, to receive the best fitting model of the nucleus for this constellation.
5.1 Wavelength dependent scale lengths
For deblending the nucleus and host galaxy surface brightness distributions we assumed that the scale lengths are constant for all bands. Contrary to this assumption, studies of inactive galaxies found significantly varying scale lengths for intermediate and late type spirals (e.g. de Grijs, 1998; Möllenhoff & Heidt, 2001). The dominant contribution comes from ongoing star formation, producing a population of young, blue stars with a / ratio much smaller than for the dynamically dominant old population. The star formation occurs with a more spread-out distribution, much different from the old population. Thus compared to NIR bands tracing the distribution of old stars, the and -band will have an additional contribution of the young population. In comparison a spiral will, at larger radii, show more flux in the optical than in the NIR, and will decrease with wavelength.
de Grijs (1998) studied a multicolour sample to describe morphological properties of normal galaxies from ellipticals to late type spirals. For early type galaxies up to Sa he found no change in from to . This changes for later types. For Sb the ratio , for Sc it is 1.6, but the spread is always large.
We observe a significant trend only for HE 1043–1346 and possibly for HE 1335–0847. In the latter case the deblending was inconclusive to a degree that neither a pure exponential disc nor a spheroidal model fitted all bands. While a spheroidal model agrees very well with the profile in , the fit is poor for radii in the NIR. However, an exponential disc would fit quite well between and , but it would underestimate the data at larger radii for all bands except .
For HE 1043–1346 the case is much clearer, as we see resolved spiral arms typical for a grand design Sc spiral (a grey scale plot is shown in Fig. 3). The colours of the arms are significantly bluer than for the centre; while prominent in and , they are hardly detectable in and . This produces exactly the effect described above. When constraining the deblending region to (27 kpc) – as we did –, changes in the profile inside this radius are visible, but small. The subtraction of the nuclear component is biased only by a small amount. When on the other hand the spiral arms were included, would change significantly.
The photometry as described in Section 4 is also sensitive to varying scale lengths, because this corresponds to a changing shape of the curve of growth of the host. The NIR bands with smaller reach a given fraction of their total light at smaller radii than in blue bands. To avoid a bias in photometry for the two objects, we moved the radius to larger radii than in the other cases. For HE 1043–1346 in addition we extracted the optical and NIR band separately to account for different shape. In total we estimate the remaining systematic error between and band to be less than 5 per cent in flux.
Because of the sign of the potential change, decreasing with wavelength, the fixed scalelength in the deblending process would make the resulting colours bluer, whereas the bias in photometry would make them systematically redder. Since the effect of deblending is negligible except for the two objects mentioned, the colours discussed in section 5.3 are not biased towards bluer values by these effects.
5.2 Morphology
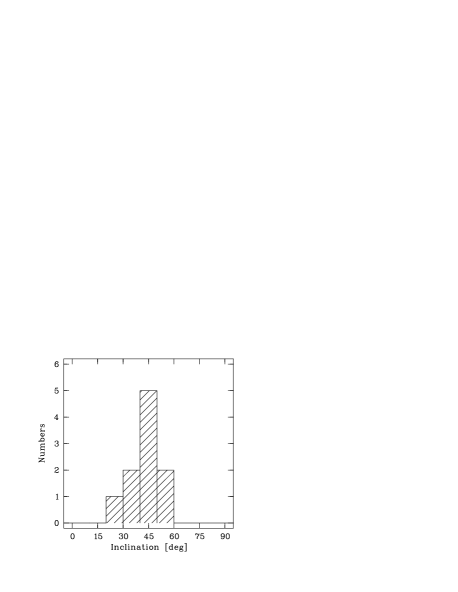
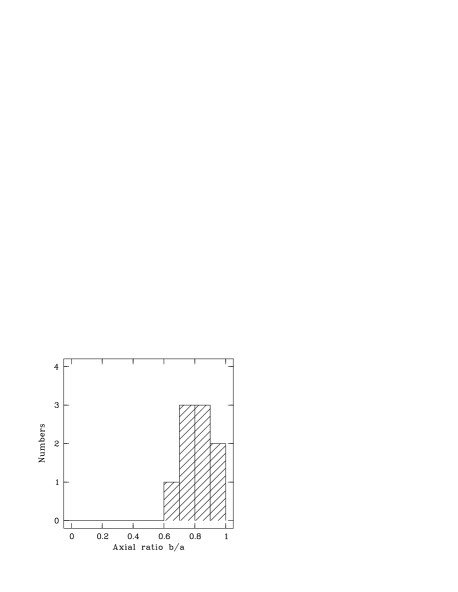
Of the 19 objects, nine were classified from the best fitting models as being disc dominated, nine as spheroid dominated and one object as a disc plus bulge. A summary of the morphological parameters is given in Table 4. Scale lengths range from 3.5 to 16.0 kpc for the discs, with an average of 8.8 kpc, and from 1.5 to 10.4 kpc for the elliptical hosts, with an average of 5.4 kpc. Mean ellipticities are 0.19 for the ellipticals and 0.29 for the discs. Since we mostly used only a single component for the host galaxy, we lack information about the relation between bulge and disc luminosities. Thus we do not know about the disc thicknesses and cannot give inclinations as originally defined by Hubble (1926). We estimate inclinations assuming the discs to be thin, . With this definition the average inclination for the discs in the sample is 44.8∘. The distribution is plotted in Fig. 5. For the ellipticals we give the distribution of axial ratios in Fig. 6.
The residual PSF mismatch and the presence of individual features (knots, weak unmasked foreground stars, etc.) have an influence on ellipticities, potentially biasing the deblending routine against values close to zero. A feature like a PSF mismatch or a foreground object will generally show a non-circular symmetry. When fitted – by force – with elliptical isophotes, the feature will therefore display a non-zero ellipticity. When the minimisation attempts to model the feature geometry by adjusting host model parameters accordingly, the ellipticities of the host are changed. The resulting host does not need to show any apparent fault, nor does a slight mismatch have a significant influence on the flux of the nuclear model, but ellipticities will be biased away from zero.
We find this to be the case for two objects. HE 1029–1401 and HE 1416–1256 were both assigned ellipticities between 0.15 and 0.2 in the free parameter fit, even though their appearance on the detector is very circular. For the fixed parameter fit we therefore forced . Both objects are clear elliptical galaxies and we do not find similar cases for the discs in our sample. Thus we conclude that the absence of face-on discs with () in the sample is real (Fig. 5). Also missing are high inclination systems with () as expected from AGN unification models.
We now give some comments on the morphological characteristics of the 19 objects. Spectral information about association of companions is available from our own unpublished spectroscopy:
HE 0952–1552: Isolated disc galaxy with and . An isophote twist in the NIR suggests spiral arms, but no arms are resolved. Otherwise very symmetric.
HE 1019–1414: Disc with and . No visible spiral arms. An asymmetry to the north is leading into a prominent tidal arm that was excluded from photometry, extending or 20 kpc to the north. A knot in this arm is a companion galaxy about 2 mag fainter in than the host.
HE 1020–1022: This is the most distant object in the sample, at and with also the largest elliptical, and in the NIR also the most luminous. It appears very symmetric, with no signs of distortions. A luminous galaxy exists 90 kpc projected distance away to the north-west.
HE 1029–1401: One of the brightest QSOs in the sky, and showing the most luminous nucleus in the sample. The host is nearly circular, very luminous elliptical that can be traced out to from the nucleus, with . A weak ‘blob’ 16 kpc to the north and a galaxy 50 kpc to the north are confirmed physical companions. This object suffers from a very poor quality of the available PSF stars and a very bright nucleus, both increasing the uncertainty of the deblending.
HE 1043–1346: This objects shows rather open spiral arms, typical of an Sb or Sc spiral, plus a bar-like structure surrounding the nucleus. For nucleus removal only the inner 12 kpc were fitted, corresponding to the bar. It follows clearly an exponential disc law with and ellipticity . The spiral arms further out are less elongated, corresponding to an inclination angle of or . This spiral is isolated, with no nearby galaxies or other companions visible.
HE 1110–1910: This host is a rather symmetric elliptical galaxy, with and . A galaxy to the north-west is a confirmed companion. It is bluer than the host in by about 0.5 mag.
HE 1201–2409: Symmetric and most compact elliptical in the sample with , in the host is barely resolved. No further structure or interaction is visible. Around the object a group of galaxies is visible, at 80, 86, 134, 166 and 205 kpc projected distance. No redshifts exist for these galaxies, thus the physical association is not confirmed.
HE 1228–1637: Elliptical host with and a slight east–west asymmetry. It lies in the vicinity of a group of galaxies with 37, 75, 175 and 235 kpc projected distance, but no tidal connection is visible. The closest galaxy to the east is a confirmed companion at the same redshift. No information is available on the association of the remaining galaxies.
HE 1237–2252: Large disc with and . An armlike asymmetry to south is visible in all bands and appears to be of tidal origin.
HE 1239–2426: This is a more complex object with a central bulge or a bar and very tightly wound arms, almost a ring. At least one bright knot in the ring is visible from to . A two-component host fit was not successful, thus we stayed with a one component disc model that fits the inner parts better than a spheroidal model. The parameters thus only describe the inner part with and . The ringlike outer structure has the same orientation as the inner part, and slightly lower ellipticity of , corresponding to . A confirmed associated companion is located at only 26 kpc to the north-west.
HE 1254–0934: Complex interacting system of the QSO and at least one, possibly two other galaxies. The host shows an exponential disc profile, with and ellipticity . The first companion is of similar luminosity as the host, 14 kpc away to the west. A tidal arm extends in an arc to the south and west towards the second companion at 60 kpc distance, 1.3 mag fainter than the host in . About 460 kpc projected distance to the east exists a small group of five bright galaxies. Both companions and the tidal arm were masked in the deblending.
HE 1300–1325: Interacting galaxy classified as an elliptical with and . The morphology is complex and asymmetric to the centre, thus might be slightly overestimated and more likely have a value around 0.3. The host is interacting with a luminous galaxy 43 kpc to the east. Both galaxies are tidally disturbed, the host is displaying two tidal arms and a tidal bridge exists between the two galaxies.
HE 1310–1051: Clear disc with two asymmetric spiral or tidal arms, , . There is no luminous companion visible as a source for tidal interaction, the closest extended objects are a galaxy 0.5 mag fainter than the host in , 45 kpc to the north, and a second, 110 kpc east, 2 mag fainter, but their redshifts are not known.
HE 1315–1028: Disc with , , but the latter seems slightly overestimated judging from the produced model. The host is asymmetric in the north-west. An also asymmetric companion exists 82 kpc in the same direction, 0.6 mag fainter than the host in .
HE 1335–0847: A decision between disc and spheroidal was difficult in this case. In the range between and an exponential disc would also be a good fit, so we could have a disc with additional flux at larger radii from star formation. This excess decreases somewhat from to the NIR. The results were inconclusive and in total we opted for the spheroid model. The host is very symmetric, with , . No companions or galaxies in the vicinity are visible.
HE 1338–1423: Prominent spiral with bulge or bar. The disc was modelled with , , the bulge/bar with a spheroid with , , but other geometries for the bulge/bar are possible.
HE 1405–1545: Highly disturbed disc with tidal arms to the north and south. There is a luminous knot 24 kpc south-east of the nucleus, touched by the southern arm, that could be an interacting companion. The morphological parameters are , . The deblending of this object was very difficult. It excluded the complete north-eastern half of the frame and left significant residuals.
HE 1416–1256: Very symmetric circular elliptical with . The closest galaxies are at 150, 180, and 240 kpc distance.
HE 1434–1600: Symmetric elliptical with low ellipticity. A companion 2 mag fainter in is located 14 kpc to the south-west.
5.3 Colours
| Object | ||||||||||||||
|---|---|---|---|---|---|---|---|---|---|---|---|---|---|---|
| HE 0952–1552 | 17.6 | 16.7 | 16.1 | 15.6 | 14.5 | 13.9 | 13.4 | –21.9 | –22.5 | –23.1 | –23.6 | –24.6 | –25.2 | –25.5 |
| HE 1019–1414 | 18.0 | 17.2 | 16.5 | 16.1 | 15.2 | 14.5 | 14.1 | –20.6 | –21.3 | –21.9 | –22.4 | –23.2 | –23.9 | –24.1 |
| HE 1020–1022 | 19.2 | 18.0 | 17.2 | 16.5 | 15.6 | 14.9 | 14.3 | –22.2 | –22.9 | –23.5 | –24.1 | –24.9 | –25.5 | –25.8 |
| HE 1029–1401 | * | 15.6 | 15.2 | 14.7 | 14.1 | 13.5 | 12.3 | * | –23.2 | –23.4 | –23.9 | –24.5 | –25.1 | –25.8 |
| HE 1043–1346 | 16.6 | 15.9 | 15.4 | 14.9 | 14.0 | 13.3 | 13.0 | –21.7 | –22.3 | –22.8 | –23.3 | –24.1 | –24.8 | –24.9 |
| HE 1110–1910 | 17.9 | 17.2 | 16.5 | 16.0 | 15.4 | 14.7 | 14.1 | –21.8 | –22.2 | –22.8 | –23.2 | –23.8 | –24.5 | –24.8 |
| HE 1201–2409 | 17.9 | 16.9 | 16.3 | 16.0 | 15.5 | 14.8 | 14.0 | –22.5 | –23.0 | –23.5 | –23.8 | –24.2 | –24.8 | –25.3 |
| HE 1228–1637 | 17.7 | 16.9 | 16.3 | 16.0 | 15.1 | 14.5 | 14.1 | –21.8 | –22.3 | –22.8 | –23.1 | –24.0 | –24.5 | –24.6 |
| HE 1237–2252 | 17.1 | 16.3 | 15.7 | 15.2 | 14.3 | 13.7 | 13.3 | –22.1 | –22.7 | –23.2 | –23.7 | –24.6 | –25.2 | –25.4 |
| HE 1239–2426 | 16.7 | 16.1 | 15.5 | 15.1 | 14.0 | 13.5 | 13.1 | –22.1 | –22.5 | –23.0 | –23.5 | –24.5 | –25.0 | –25.2 |
| HE 1254–0934 | * | 17.3 | 16.9 | 16.0 | 15.3 | 14.8 | 13.9 | * | –22.5 | –22.9 | –23.7 | –24.4 | –24.9 | –25.5 |
| HE 1300–1325 | * | 15.3 | 14.7 | 14.2 | 13.3 | 12.7 | 12.4 | * | –22.1 | –22.6 | –23.1 | –24.0 | –24.6 | –24.8 |
| HE 1310–1051 | 16.5 | 16.0 | 15.5 | 15.0 | 14.1 | 13.6 | 13.3 | –20.2 | –20.6 | –21.1 | –21.6 | –22.4 | –23.0 | –23.2 |
| HE 1315–1028 | * | 17.7 | 17.0 | 16.4 | 15.4 | 14.9 | 14.5 | * | –21.3 | –22.0 | –22.6 | –23.5 | –24.1 | –24.2 |
| HE 1335–0847 | 17.5 | 16.8 | 16.3 | 15.9 | 15.1 | 14.5 | 14.3 | –21.3 | –21.8 | –22.2 | –22.6 | –23.4 | –23.9 | –23.9 |
| HE 1338–1423 | 15.1 | 14.5 | 14.0 | 13.4 | 12.5 | 11.8 | 11.4 | –22.0 | –22.6 | –23.0 | –23.6 | –24.5 | –25.2 | –25.4 |
| HE 1405–1545 | * | 17.4 | 16.9 | 16.3 | 15.6 | 15.0 | 14.4 | * | –23.3 | –23.7 | –24.2 | –24.9 | –25.4 | –25.6 |
| HE 1416–1256 | * | 17.5 | 17.0 | 16.3 | 15.9 | 15.2 | 14.7 | * | –22.3 | –22.6 | –23.3 | –23.7 | –24.3 | –24.5 |
| HE 1434–1600 | * | 17.0 | 16.4 | 15.8 | 15.1 | 14.4 | 13.7 | * | –23.1 | –23.5 | –24.1 | –24.8 | –25.3 | –25.7 |
| Object | |||||||
|---|---|---|---|---|---|---|---|
| HE 0952–1552 | 0.57 | 0.64 | 0.47 | 1.04 | 0.60 | 0.22 | 2.96 |
| HE 1019–1414 | 0.62 | 0.68 | 0.42 | 0.86 | 0.64 | 0.24 | 2.84 |
| HE 1020–1022 | 0.68 | 0.58 | 0.65 | 0.78 | 0.61 | 0.22 | 2.84 |
| HE 1029–1401 | * | 0.27 | 0.48 | 0.63 | 0.55 | 0.71 | 2.64 |
| HE 1043–1346 | 0.57 | 0.54 | 0.48 | 0.86 | 0.63 | 0.19 | 2.70 |
| HE 1110–1910 | 0.41 | 0.62 | 0.39 | 0.59 | 0.66 | 0.34 | 2.61 |
| HE 1201–2409 | 0.57 | 0.47 | 0.26 | 0.44 | 0.65 | 0.48 | 2.29 |
| HE 1228–1637 | 0.48 | 0.49 | 0.35 | 0.84 | 0.49 | 0.19 | 2.35 |
| HE 1237–2252 | 0.61 | 0.51 | 0.47 | 0.95 | 0.56 | 0.17 | 2.66 |
| HE 1239–2426 | 0.48 | 0.50 | 0.47 | 0.98 | 0.53 | 0.21 | 2.70 |
| HE 1254–0934 | * | 0.38 | 0.78 | 0.68 | 0.49 | 0.60 | 2.92 |
| HE 1300–1325 | * | 0.47 | 0.49 | 0.92 | 0.63 | 0.20 | 2.70 |
| HE 1310–1051 | 0.47 | 0.48 | 0.46 | 0.86 | 0.53 | 0.20 | 2.53 |
| HE 1315–1028 | * | 0.67 | 0.54 | 0.96 | 0.53 | 0.12 | 2.83 |
| HE 1335–0847 | 0.47 | 0.42 | 0.43 | 0.74 | 0.52 | 0.05 | 2.14 |
| HE 1338–1423 | 0.56 | 0.43 | 0.65 | 0.88 | 0.65 | 0.28 | 2.89 |
| HE 1405–1545 | * | 0.43 | 0.52 | 0.63 | 0.55 | 0.17 | 2.31 |
| HE 1416–1256 | * | 0.33 | 0.64 | 0.41 | 0.58 | 0.19 | 2.16 |
| HE 1434–1600 | * | 0.34 | 0.64 | 0.65 | 0.58 | 0.38 | 2.59 |
The apparent and absolute magnitudes of the host galaxies of our objects in the seven bands are collected in Table 5. From these we derived the rest-frame colours in Table 6 which include the -correction terms from Table 3. Since the -band images have on average much lower S/N than the data from the other bands, and also data is not available for all objects, we include as a long wavelength baseline colour for the discussion below. In Table 7, mean and median colours are listed for the sample as a whole and for subsamples of ellipticals and discs.
The main internal error source for the colours are the uncertainties of the deblending process. Simulations as performed by Kuhlbrodt et al. (2003) suggest that deblending errors for our objects are of the order of 0.05 mag in host galaxy magnitude, and rather 0.1 mag for the very compact elliptical HE 1201–2409.
| Whole sample | 0.54 | 0.49 | 0.50 | 0.77 | 0.58 | 0.27 | 2.61 |
|---|---|---|---|---|---|---|---|
| (0.02) | (0.03) | (0.03) | (0.04) | (0.01) | (0.04) | (0.06) | |
| 0.56 | 0.47 | 0.47 | 0.78 | 0.56 | 0.20 | 2.64 | |
| Ellipticals | 0.52 | 0.44 | 0.48 | 0.67 | 0.59 | 0.31 | 2.48 |
| (0.05) | (0.04) | (0.05) | (0.06) | (0.02) | (0.07) | (0.08) | |
| 0.47 | 0.42 | 0.43 | 0.63 | 0.58 | 0.20 | 2.35 | |
| Discs | 0.55 | 0.53 | 0.53 | 0.87 | 0.57 | 0.24 | 2.73 |
| (0.02) | (0.03) | (0.04) | (0.04) | (0.02) | (0.04) | (0.06) | |
| 0.56 | 0.50 | 0.47 | 0.86 | 0.55 | 0.20 | 2.70 |
5.4 Influence of emission lines
Emission lines from the ISM of the host galaxy can influence the broad band colours. In two samples of host galaxy spectra (Courbin et al., 2002; Jahnke, 2002), we find a significant fraction of host galaxies showing strong extended gas emission lines, particularly prominent for elliptical host galaxies.
For the broad band filter contains H and the [O III] doublet around 5000 Å. We estimate the line fluxes to correspond to an equivalent of 0.0–0.15 mag of the -band continuum emission. Similarly, for H and the [N II] doublet the -band might show enhanced flux for objects with , and to a smaller extend also the -band for .
Furthermore, we find in the mentioned studies that the gas in the spheroids is mainly present in rotating gas discs, implying that the emission line regions have a different spatial distribution than the stars. For the deblending this can result in an additional overestimation of the host galaxy flux, as a result of the algorithm attempting to compensate for the slight model mismatch.
We estimate that the combined average bias from emission lines and deblending errors for the -band is of the order of 0.15 mag at most. Judging from the radial profiles of our objects in the different bands, we can exclude systematically larger deviations. A correction for this bias has not been included in Tables 5 to 8.
6 Colour comparison to inactive galaxies
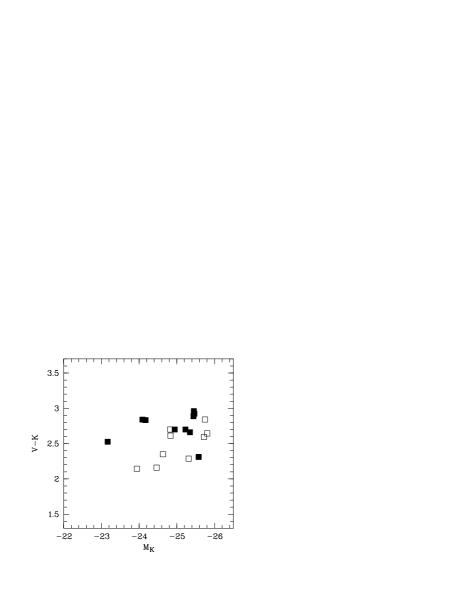
In Table 7 no significant difference can be seen for the colours of neighbouring wavelength bands of the discs and ellipticals in the sample. For the long baseline however a 0.25 mag (median: 0.35 mag) difference exists, the ellipticals being bluer than the discs. This is not created by statistical outliers, as Figure 7 illustrates: The ellipticals (open symbols) have systematically bluer colours than the discs (filled symbols). Some of the difference might be caused by line emission as discussed above. If for this a 0.15 mag correction is applied to the colours of the ellipticals, their average colour increases to and the difference to the discs in the sample decreased to 0.1 mag. This is not a statistically significant difference, as confirmed by Student’s test. Thus the ellipticals and discs in the sample have similar colours. While the comparison of ellipticals and discs in the sample is already illustrative, we are rather interested to relate our results to the general population of inactive galaxies.
6.1 Empirical colours of inactive galaxies
Optical colours of normal galaxies are well established. Based on systematic spectrophotometric catalogues (e.g. Kennicut, 1992; Kinney et al., 1996), broad band colours of galaxies can be computed, and average values predicted. In the UV and optical, Fukugita et al. (1995) list average colours of inactive galaxies for 48 photometric bands. For ellipticals their numbers agree down to about 0.05 mag with the effective colours derived by Mannucci et al. (2001), who compiled colours for galaxies with from a large number of publications (but not from Fukugita et al.). Since effective colours are computed from fluxes inside an aperture with constant radius for all bands, a comparison with total colours is only possible for ellipticals, showing small radial colour gradients.
In a statistically extensive study of more than 1000 galaxies from catalogue data, Fioc & Rocca-Volmerange (1999) computed total and effective NIR and optical–NIR colours, using type-dependent curves of growth for converting aperture photometry data. The authors also investigate the effect of disc inclination on and the colour-magnitude relation differentiated by Hubble type. The values for NIR colours are almost independent of type. They find and for ellipticals, rising to 0.78 and 0.25 for Sb spirals, which is again consistent with the values by Mannucci et al. Fioc & Rocca-Volmerange find an effective for ellipticals, which is about 0.2 mag bluer than computed by Mannucci et al. (2001).
We cannot resolve these discrepancies at this point. We will take the colours listed by Fioc & Rocca-Volmerange as a basis because a) the definition of their total colours is closer to the methods used in our study, b) because their sample is larger and the treatment seems very consistent, and c) because their colours are slightly bluer, which is the same direction of bias as all of our other potential systematic errors. We thus get conservative estimates for the blue colours of our sample.
We used their colour relation, including inclination and magnitude dependencies, to calibrate the comparison optical–NIR colours for inactive galaxies. Our disc subsample has on average an axial ratio , a value for which the Fioc & Rocca-Volmerange relations yield . Including the colour-magnitude dependence changes this value only slightly to , because the average brightness of their Sb and our disc subsample are very close to each other (0.25 mag difference). For elliptical galaxies the total colours at the average brightness of our subsample are , corrected for magnitude dependence.
In Table 8 we list the collected colours as taken from Fukugita et al. (1995) for the optical colours, the optical–NIR and NIR colours are computed from Fioc & Rocca-Volmerange. For the discs we assume intermediate type (Sb) colours.
| Ellipticals | |||||||
|---|---|---|---|---|---|---|---|
| Inactive | 0.96 | 0.61 | 0.70 | 0.77 | 0.71 | 0.20 | 2.99 (0.12) |
| QSO host sample | 0.52 | 0.44 | 0.48 | 0.67 | 0.59 | 0.31 | 2.48 (0.25) |
| 0.44 | 0.17 | 0.22 | 0.10 | 0.12 | –0.11 | 0.50 | |
| Discs (Sb) | |||||||
| Inactive | 0.68 | 0.54 | 0.63 | 0.67 | 0.78 | 0.25 | 2.87 (0.36) |
| QSO host sample | 0.55 | 0.53 | 0.53 | 0.87 | 0.57 | 0.24 | 2.73 (0.20) |
| 0.13 | 0.01 | 0.10 | –0.20 | 0.21 | 0.01 | 0.14 |
6.2 Abnormally blue QSO host galaxies
In Table 8 we compare colours for inactive galaxies with the mean colours of our subsamples (from Table 7). We find very blue colours for our elliptical host galaxies in comparison, and slightly bluer colours than normal for the discs. The long wavelength baseline colour is for our ellipticals 0.5 mag bluer (0.35 mag including correction for emission in ) than for inactive galaxies of similar luminosity. The difference in is mag. We again performed a test with the hypothesis of identical mean colours for our ellipticals and their inactive counterparts. This hypothesis is rejected at 99.9 per cent confidence level. We also tested whether their colours are consistent with those of late type (Sc or later) inactive galaxies showing strong star formation. This hypothesis is not rejected by the test. The host galaxies classified as discs are also, on average, slightly bluer than their inactive counterparts, but not by a significant amount.
Are these colours real? The dependency of the scale length on wavelength does not apply to the ellipticals, so all known systematic effects in our procedure would only produce redder colours.
There is one additional possible artefact that could be created in the deblending procedure. This is transfer of a constant fraction of nuclear light into the host, e.g., due to a similar systematic error of host galaxy parameter estimation in all bands. This would imply a contamination of the host galaxy with light from the nucleus. Host galaxies with spheroidal morphology are in general more compact than exponential discs, owing to their surface brightness distribution. They are closer in their appearance to the PSF shape of the nucleus than discs and thus modelling of the nuclear contribution is generally more sensitive to the properties of the host.
But, while for optical colours the nucleus is much bluer than any host, for optical–NIR colours such a transfer would have the opposite effect, owing to the fact that quasar nuclei are generally quite red in , with (cf. Elvis et al., 1994). This is similar or even redder than for inactive galaxies and particularly redder than our host galaxy sample! Thus a constant fraction of nuclear flux transfered to the host would not make bluer, but redder.
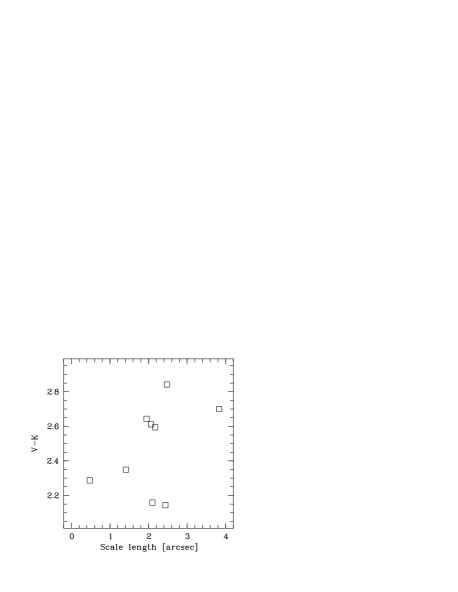
In fact, we can even exclude significant flux transfer for our deblended data even for the more compact objects. There is no correlation between compactness of the host (as parametrised by the angular scale length) and the colour of the host galaxy (Fig. 8).
Our inactive galaxy reference values for Sb spirals already include the correction for inclination, which can be a strong source for bias: Due to missing high inclination and edge-on spirals as observable QSO hosts, the average field galaxy population will always appear slightly dust-reddened in comparison. When comparing our host galaxies to the galaxy sample used by Fioc & Rocca-Volmerange (1999) this amounts to bluer colours by about 0.15 mag. In elliptical galaxies, however, this kind of dust extinction is not expected, thus colour and viewing angle should not be related.
After assessing all of these potential error sources, we conclude that the blue colours of our sample – approximately normal for the discs, abnormally blue for the ellipticals – are most likely real.
6.3 Colour-magnitude relation for host galaxies


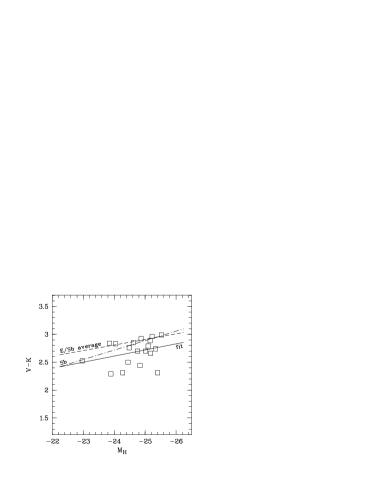
One further interesting aspect is shown in Fig. 9, where we plot the optical–NIR colour-magnitude relation (CMR) for three colours and the absolute -band magnitude. Compared to Fig. 7 we corrected the -band related colours of the ellipticals for the abovementioned bias due to by globally adding 0.15 mag. Shown are the linear regression fits to the colours with as an independent variable (solid line). This we compare to the CMR of inactive Sb galaxies (dot-dashed line) and an average CMR of E and Sb galaxies, both taken from Fioc & Rocca-Volmerange. For the latter we averaged their slopes for E and Sb galaxies and shifted the relation to a zeropoint according to the mean E and Sb colour, as given in Table 8. For the CMR in and we applied offsets of 0.82 mag ( average for E and Sb) and 0.68 mag for the Sb relation. Accordingly, offsets of 0.60 and 0.43 mag were applied for . While the correlations are not strong, the similarity between the CMRs for hosts and inactive galaxies are appealing, particularly in , where the slope of the fit is identical to the averaged inactive CMR relation, just shifted towards bluer colours by 0.2 mag. It should be noted that also the spread of the CMR of our quasar hosts is within 15 per cent to the spread found by Fioc & Rocca-Volmerange.
7 Fitting stellar populations models
Another way of analysing the derived host galaxy luminosities and colours is by comparing them to synthetic model SEDs. In order to combine all colour information we decided to fit SEDs of evolution synthesis models (ESM) to the calibrated fluxes of the hosts at the different wavelengths. With seven bands representing seven data points in the SED of an object, our prime goal was to reproduce and cross-check the blue colours found, and to try to estimate approximate ages of the dominant populations in the hosts. For this task we used model single stellar populations (SSPs) of single metallicity, because the age-metallicity degeneracy in model colours cannot be resolved with multicolour data. We made the simplifying assumption that the populations are created instantly at age zero with an initial mass function and then evolve passively (‘instantanous burst models’). Even if the absolute calibration of these model fits is difficult, they can show if there is or is not a generally different SED found for the elliptical and disc dominated host galaxies.
7.1 Evolution synthesis models
Synthesised galaxy SEDs composed from libraries of stellar spectra can predict colours, as a function of age and metallicity. Different methods are used in evolutionary population synthesis and discrepancies arise particularly in the NIR. Maraston (1998) compared models by Bruzual & Charlot (1993, 1996) with own models and explained a 0.5 mag difference in colours between the two models by the different treatment of AGB and carbon stars in the models. For single stellar populations of about 1 Gyr, Maraston’s models are redder by several tenths of a magnitude in colours. For models older than 4 Gyrs the predicted colours converge again, with differences less than 0.2 mag between the models. For SSPs older than 8 Gyrs the numbers are also consistent with colours derived for evolved ellipticals by Fioc & Rocca-Volmerange (1999). We note that the different existing stellar population models have not yet finally converged; however, for a qualitative SED analysis the current state seems acceptable.
We chose to use the models from the GISSEL96 library (Bruzual & Charlot, 1993, 1996), also available via Leitherer et al. (1996), with the Scalo (1986) initial mass function and solar metallicities for reasons of comparability with Maraston (1998). We selected a coarse grid of model ages, 0.1, 0.7, 2, 6 and 14 Gyr, and in addition constructed a rough continuous star formation (CSF) model with a constant star formation rate, by superposing a fine grid of models between ages of 10 Myr and 14 Gyr.
For these model spectra broad band fluxes were computed for the seven BVRIJHK filters used, and we converted the host galaxy magnitudes to flux densities using a Kurucz Vega SED as given by Bruzual & Charlot (1996). Then models and data were compared via minimisation, in two steps: 1) fitting only one SSP, with age as the only free parameter (one-component, ‘1c’), 2) fitting two SSPs, with the first age fixed (0.1 Gyr), and the age of the second component and the two masses as free parameters (two-component, ‘2c’).
7.2 Variances and confidence intervals
In the fitting process we need a weighting scheme for the contributions of the different bands. Also, only knowing the age of the best fit SSP is of limited diagnostic value without at least a rough estimate of a range of ages also compatible with the data set.
Statistically correct variances are not available for this purpose, as they are lost in the QSO deblending procedure. We attempted to estimate the absolute values of the standard deviation from the minimisation itself. For this we followed Press et al. (1995) by not using the determined as a goodness of fit parameter. Instead we determined the range of potential models by using the fact that for ‘moderately good’ fits the value is equal to the number of degrees of freedom , yielding a known relation between , and .
This method has the drawback of requiring identical weights for all data points, in spite of systematically different flux values for the seven bands. The observations were designed to yield similar S/N for the host in all bands, except , thus the relative errors from the deblending process are similar. This makes the absolute errors in the lower flux NIR bands smaller, but we assign the same absolute error with this weighting scheme. As a result the NIR bands will have a systematically lower weight. This effect is counteracted by the redundancy of information contained in the three NIR bands, all of which contain information about the older stellar population.
7.3 One component fits
We performed two different 1c fits. The first used only the five SSP of ages 0.1, 0.7, 2, 6 and 14 Gyr, in the second we added the CSF model. In Table 9 we show the result: We marked the best fitting model with an ‘x’, those within , , and according to the above procedure with 1, 2, and 3. As described above, these error bars should not be taken at face value, but only give a rough impression on the range of permitted ages.
| Object | Type | 0.1 Gyr | 0.7 Gyr | 2 Gyr | 6 Gyr | 14 Gyr | CSF |
|---|---|---|---|---|---|---|---|
| HE 0952–1552 | D | x | 3 | y | |||
| HE 1019–1414 | D | x | 3 | ||||
| HE 1020–1022 | E | 1 | x | 3 | |||
| HE 1029–1401 | E | x | 1 | ||||
| HE 1043–1346 | D | 3 | x | y | |||
| HE 1110–1910 | E | 1 | x | 1 | |||
| HE 1201–2409 | E | x | 2 | ||||
| HE 1228–1637 | E | x | 1 | ||||
| HE 1237–2252 | D | 3 | x | y | |||
| HE 1239–2426 | D | 1 | x | 3 | y | ||
| HE 1254–0934 | D | 2 | x | 1 | 3 | ||
| HE 1300–1325 | E | x | |||||
| HE 1310–1051 | D | x | 1 | ||||
| HE 1315–1028 | D | 1 | x | 3 | |||
| HE 1335–0847 | E | 1 | x | ||||
| HE 1338–1423 | D | 2 | x | y | |||
| HE 1405–1545 | D | x | 1 | ||||
| HE 1416–1256 | E | 1 | x | 2 | |||
| HE 1434–1600 | E | x | 3 |
It is interesting that the best fitting models are generally quite young. Only for two objects the best fit is older than the 2 Gyr model. One of them, HE 1315–1028, is of disc morphology, the other, HE 1020–1022, is an elliptical. Of the rest, twelve prefer the 2 Gyr model, five even the 0.7 Gyr model, whereof three are ellipticals, two are discs. The data for HE 1254–0934 seem to constrain the models only poorly, as all except the youngest model are possible within .
In a second step we therefore included a CSF model in the 1c fit, assuming a constant star formation rate over a period of 14 Gyr. The last column ‘CSF’ in Table 9 marks those objects with a ‘y’, for which the CSF is the best fitting model when incorporated in the fit. This is the case for half of the ten discs and none of the ellipticals. Included in these five discs are the three with visible prominent spiral arms, HE 1043–1346, HE 1239–2426, and HE 1338–1423. For four of the five remaining discs the CSF model ranges on rank number two, all inside . Similarly, for the ellipticals the CSF model is not inside for only two of nine objects, HE 1029–1401 and HE 1201–2409.
7.4 Two component fits
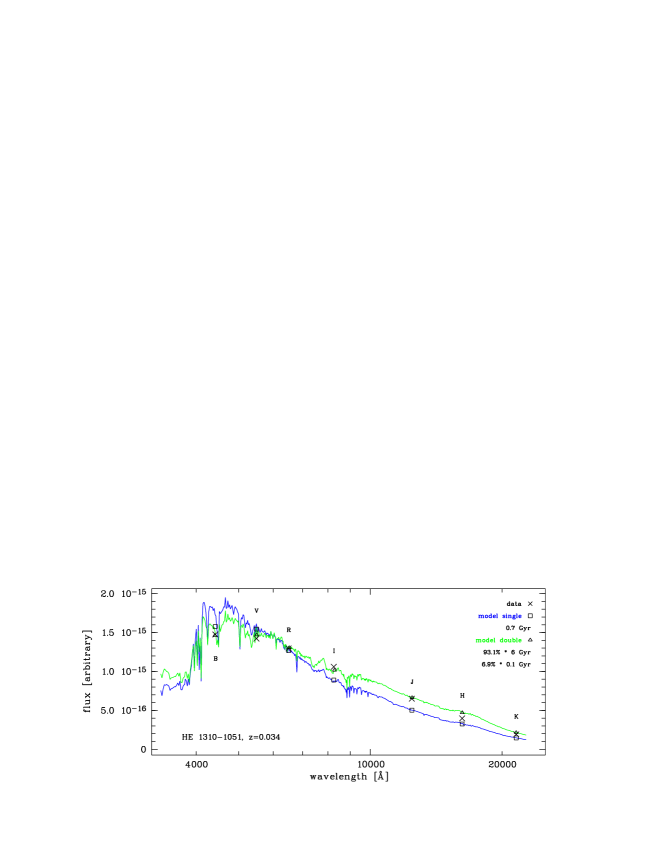
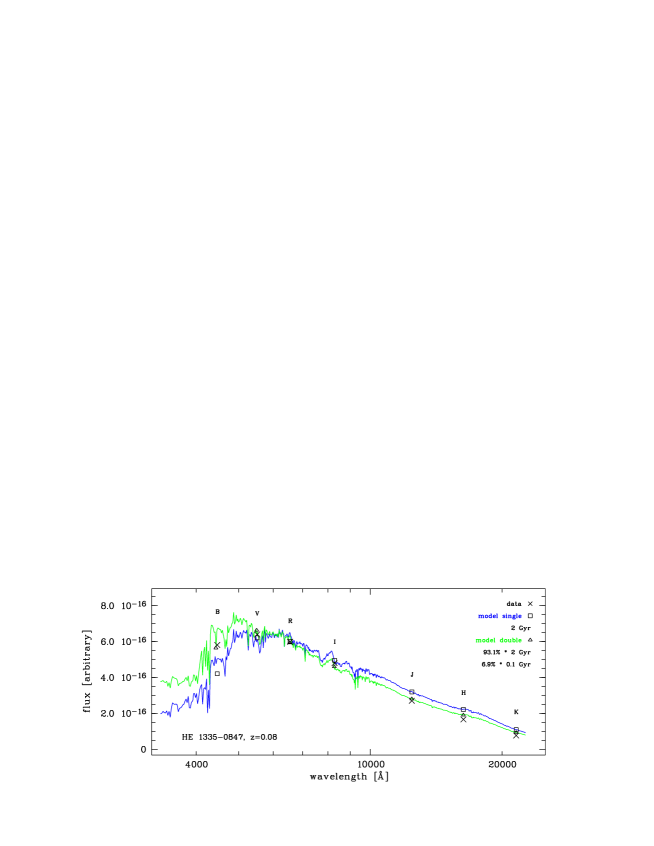
For the 2c fit we proceeded similarly, with a first fit excluding the CSF model. The age of the first component was set to 0.1 Gyr. The age of the second component was left free, as well as both absolute scale parameters (‘masses’) that we translate into a percentage of the total (visible baryonic) mass. Results are compiled in Table 10, in a similar way to the 1c fit, with the mass fraction of the 0.1 Gyr component added in parentheses. As examples, the resulting best fitting SEDs and their relation to data points are plotted for two objects in Figure 10.
| Object | Type | 0.7 Gyr | 2 Gyr | 6 Gyr | 14 Gyr | CSF |
|---|---|---|---|---|---|---|
| HE 0952–1552 | D | 2 (0.7) | 1 (3.3) | x (2.3) | 1 (0.6) | |
| HE 1019–1414 | D | x (0.8) | 1 (2.6) | 1 (3.3) | 1 (0.0) | |
| HE 1020–1022 | E | 1 (0.0) | x (1.0) | 2 (1.5) | 2 (0.0) | |
| HE 1029–1401 | E | 1 (0.0) | x (10.7) | 1 (11.3) | 1 (8.7) | 1 (7.5) |
| HE 1043–1346 | D | 1 (3.9) | x (5.2) | 2 (3.3) | y (1.7) | |
| HE 1110–1910 | E | 2 (0.0) | x (2.6) | 1 (4.8) | 1 (4.5) | 1 (2.3) |
| HE 1201–2409 | E | x (0.0) | 1 (12.3) | 1 (10.7) | 2 (7.5) | 1 (8.7) |
| HE 1228–1637 | E | x (5.6) | 1 (6.5) | 2 (4.5) | 1 (3.9) | |
| HE 1237–2252 | D | 2 (3.3) | x (4.8) | 3 (3.1) | 1 (1.3) | |
| HE 1239–2426 | D | 3 (6.5) | 1 (5.3) | x (4.1) | 1 (3.3) | |
| HE 1254–0934 | D | 2 (0.0) | x (0.7) | 1 (3.6) | 2 (3.1) | 1 (0.0) |
| HE 1300–1325 | E | 1 (0.7) | x (3.8) | y (1.1) | ||
| HE 1310–1051 | D | 2 (7.0) | x (7.0) | 2 (5.2) | 1 (4.5) | |
| HE 1315–1028 | D | 2 (0.0) | x (1.1) | 2 (2.3) | 2 (0.0) | |
| HE 1335–0847 | E | x (7.0) | 2 (8.7) | 3 (6.0) | 2 (5.2) | |
| HE 1338–1423 | D | 1 (2.4) | x (4.5) | 1 (3.3) | 1 (1.8) | |
| HE 1405–1545 | D | 1 (0.2) | x (9.3) | 1 (8.7) | 2 (7.0) | 1 (6.5) |
| HE 1416–1256 | E | 1 (0.2) | x (5.2) | 1 (7.5) | 1 (6.0) | 1 (5.2) |
| HE 1434–1600 | E | x (0.7) | 1 (4.5) | 1 (3.9) | 1 (0.9) |
7.5 SSP fitting results
In total the objects show broad band colours consistent with intermediately young stellar populations, with an age of 2 Gyr or CSF. It is again striking that hosts of both morphological types are consistently fit by relatively young spectra. Significant contributions of a very young population is required by only two discs and no significant difference can be seen for spheroids vs. discs concerning average age. None of the spheroids shows an SED that requires to be modelled with an old, evolved population, as would be expected for inactive ellipticals.
This result is supporting the blue colours found in Section 6.2. Colours as blue as seen for most objects are usually only found in late type inactive galaxies that have a significant component of ongoing star formation. For the discs in the sample we should expect most of the blue emission to come from continuous star formation as normal for spirals, but for the spheroids this is not expected. The on average slightly bluer colours for spheroids compared to discs are compatible with the result of the model fitting. Also, the ages of the dominating populations in the spheroids are compatible with the abnormously blue colours found.
8 Discussion
8.1 Host luminosities and morphological types
Our sample is statistically complete, thus representative for the local QSO and QSO host galaxy population. We do not sample the highest luminosity regime for both components; in -band luminosities the sample is distributed around the classical dividing line between Sy 1 galaxies and luminous quasars.
In our sample about half of the objects are ellipticals, the other half is disc dominated. For this range of quasar luminosities, the morphological classification found for the sample agrees well with previous findings (e.g. Smith et al., 1986; McLeod & Rieke, 1995a; Taylor et al., 1996; Schade et al., 2000): The lower the luminosity of the nucleus, the larger the probability to find a disc as the host galaxy; the higher the quasar luminosity, the more probable it becomes to find an elliptical. In absolute luminosities of the hosts (Table 5), the ellipticals in our sample are brighter than the discs, on average by 0.4 mag in , 0.2 mag in .
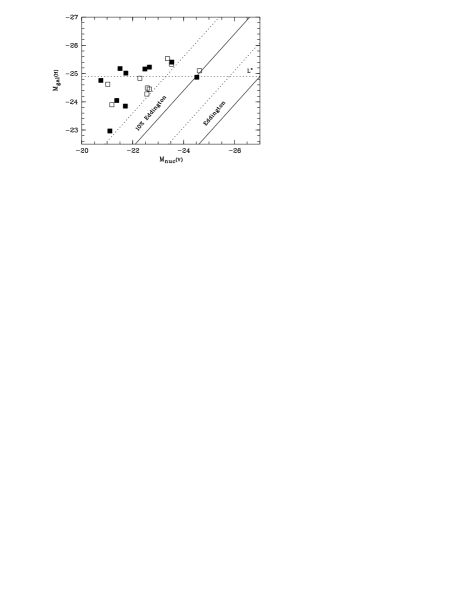
In the -band about half of our objects are brighter than for inactive galaxies (-band values taken from Huang et al., 2003, and assuming mag), as shown in Figure 11, thus are generally luminous. Via the Magorrian (1998) relation between the mass of the central black hole and the bulge mass of the galaxy we also expect to find on average brighter hosts for brighter nuclei (Taylor et al., 1996; McLeod et al., 1999). In Figure 11 we find this relation confirmed by our sample, showing a correlation of host and nuclear luminosities. All of our hosts accrete with less or equal to 10 per cent of their Eddington luminosity, independent of morphology and host luminosity.
As noted in Sect. 5.2, we lack discs with ellipticities of and . Similar results were found in several other host galaxy studies. Taylor et al. (1996) find only one out of eleven discs with and a highest ellipticity of . McLeod & Rieke (1995b) investigate a large Sy 1 sample, and also find a strong bias against edge-on galaxies, with only four out of 42 Sy 1 showing . All samples, including our own, peak around , which, apart from confirming the standard model (Antonucci, 1993), suggests an intrinsic ellipticity for the discs.
Our distribution of axial ratios () for the ellipticals, as shown in Fig. 6, is very similar to numbers found by Tremblay & Merritt (1996) (a similar definition was proposed by Faber et al., 1997). The authors performed statistical tests on axial ratios on a large sample of inactive elliptical galaxies, finding two distinct populations of ellipticals, dependent on luminosity. They separate between faint and bright ellipticals at , which puts all of our elliptical hosts into the latter class. The mean axial ratios are around 0.75 for their faint sample and 0.85 for the bright counterpart. Our ellipticals have when assuming for HE 1300–1325 (see Sect. 5.2 above), with a spread of 0.11. Tremblay & Merritt find a spread of 0.08. Thus we find very similar values to the axial ratio distribution of bright inactive ellipticals. From their morphological parameters alone, there is no evidence that our hosts deviate from the inactive galaxy population except for the lack of edge-on discs.
8.2 Blue host colours and young stellar ages
As we have shown in Section 6, particularly the elliptical host galaxies show unusually blue colours, both for short and long wavelength baselines. In we see the discs being slightly (0.14 mag) bluer than inactive Sb galaxies, but only with marginally significance. The elliptical hosts, on the other hand, are bluer by 0.5 mag than their inactive counterparts, even bluer than the discs by 0.25 mag. If we include a 0.15 mag correction for possible line emission, the ellipticals are still bluer than inactive ellipticals by 0.35 mag and only slightly bluer than their disc counterparts. The colours of both morphologically defined subgroups are similar to those of intermediate to late type spirals.
If this is correct the assumed K-corrections for the ellipticals are overestimated. If instead the K-corrections appropriate for later type galaxies from Table 3 are used, the ellipticals become even more luminous in the rest frame -band. Their average redshift is , resulting in 0.15 mag higher luminosities and thus even bluer colours. Incidentally, in the -band the effects of gas emission and K-correction would cancel out.
The results from fitting the broad band fluxes with models points into the same direction. When including corrections for the and -band fluxes, the derived ages become slightly older, but the results do not change fundamentally.
For several of the discs as well as some of the ellipticals a continuous star formation model is also adequate. But none of the ellipticals is modelled best by an old, evolved population. On the other hand there is little evidence for massive on-going starbursts, manifested in a significant young population ( Gyr). Only for two objects starburst masses above a few percent are found – both being discs.
A strong starburst on top of an evolved old population can be excluded as the reason for the blue colours from the model deblending. Interestingly, the blue colours are visible, even though asymmetric features typically showing increased star formation have been masked out in the deblending and photometry process. In fact, there could be even stronger star forming activity going on in those regions.
8.3 Comparison to other studies
The number of existing host galaxy studies featuring any sort of spectral information is small. Only rarely, more than two bands (one colour) is available. Results concerning evidence for young stellar populations or starbursts are mixed and show that stellar age and morphological classification are not linked in a simple manner.
-
•
The lower luminosity regime of classical Sy 1 galaxies was investigated by Kotilainen & Ward (1994). They observed a sample in the BVRIJHK bands, similar to us. As expected for Seyferts, they found only spiral galaxies. All of their objects show very normal colours for their morphological type and no signs for additional starbursts. This is in agreement with our results for disc galaxies when continued towards lower luminosities.
-
•
Schade et al. (2000) investigated a large sample of 76 low redshift () predominantly intermediate luminosity AGN. They observed from the ground in the and -bands and with HST in the F814W () band. Their objects show host galaxy properties similar to our the lower luminosity objects in our sample. No strong merger events are observed, only central bars in a number of objects. Individual colours of their host galaxies show a large spread, which in part is stated to be due to the deblending of nucleus and host galaxy components. Without going into detail – this topic not being their primary focus –, the authors report for their sample morphological types and colours not different from inactive galaxies. However, when we calculate the distribution of their colours, differentiated by morphological type, we find E/S0 colours to be mag bluer than inactive (Fig. 12). Even though a large colour spread is found, both the mean value as well as the majority of individual objects lie bluewards of inactive galaxies.
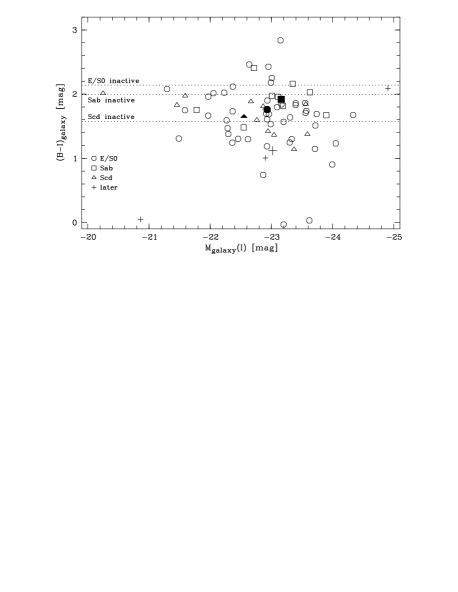
Figure 12: Rest frame host galaxy colours from Schade et al. (2000), recomputed from their given apparent magnitudes, converted to Vega zeropoint, K-corrected and differentiated by galaxy type according to bulge/total ratio. Individual objects are marked by open symbols, mean type values by larger filled symbols and cross. The horizontal lines are the mean inactive galaxy colours from Fukugita et al. (1995). -
•
In a large -band study with 53 objects (Jahnke & Wisotzki, 2003), we compared host galaxy luminosities to the NIR sample properties of McLeod & Rieke (1994a, b). The sample in that study includes the present multicolour objects. We found indications for 1 mag bluer colours than expected for inactive galaxies in the high luminosity subsample. The lower luminosity galaxies were consistent with inactive galaxy colours.
-
•
Rönnback et al. (1996) and Örndahl (2003) investigated a large sample of intermediate redshift quasars (), for which already some evolution might be expected. They also attempted to determine morphological information and found a few elliptical RQQ host galaxies with similar luminosities than our luminous objects, and rest frame colours bluer than expected by 0.6 mag, much more consistent with late type spiral (Sc–Sd) colours.
-
•
The first thorough spectroscopic study of QSO host galaxies (Boroson et al., 1985) observed a heterogenous sample of quasars from intermediate to high luminosites using off-nuclear spectroscopy. There was no morphological information available to classify the hosts. They identified different classes of host galaxies, with either blue or red continuum, pointing to both young and old populations, respectively. A comparison to the spectra and luminositites of Nolan et al. (2001) suggests that their class of ‘red-continuum’ objects can be identified as elliptical galaxies with old evolved stellar populations. However there exists another class of ‘blue-continuum’ objects, whose morphological identity is not known.
-
•
In a program started ten years ago (Dunlop et al., 1993; Taylor et al., 1996; McLure et al., 1999; Dunlop et al., 2003), the spectroscopic study by Hughes et al. (2000) and Nolan et al. (2001) investigated each nine radio-loud and -quiet quasars at redshifts . These quasars are on average 1.5 mag more luminous compared to our sample, although an overlap in luminosities exists. They found elliptical host galaxies being more luminous in the NIR by 1.2 mag (Taylor et al., 1996; Dunlop et al., 2003) compared to our objects, with scale lengths being larger by a factor of two (Dunlop et al., 2003). With off-nuclear spectra they sampled the host galaxies at relatively large distances to the nuclei of 15–20 kpc, attempting to avoid the majority of nuclear emission in their spectra. Their extracted host galaxy spectra are characteristic for intermediately old to old populations, their youngest estimated stellar ages being several Gyrs. They find little gas emission and no signs for young populations or starbursts above per cent in mass. broad band colours of a subsample of these objects are presented in Dunlop et al. (2003). They also generally the hosts to be red and conclude that old populations dominate.
Incidentally, one of their faintest and our brightest elliptical host is identical. For this object, HE 1020–1022, both and -band magnitudes are consistent, with a resulting colour difference of only mag. For precisely this object Nolan et al. found the youngest population in their sample. Their best fits suggested either a 5 Gyr component plus 0.6 per cent of 0.1 Gyr, or a pure 4 Gyr population when a contribution for the nucleus is subtracted. With multicolour fitting we found 6 Gyr plus 1 per cent of 0.1 Gyr and compatibility with a pure 2 Gyr component. The 6 Gyr fit would make this object the one with the oldest dominating population in our sample, and, independent of this, it shows also the reddest colour.
The morphology and colours of the disc host galaxy fraction of our sample seem to be in general good aggrement with these previous results as summarized above. The lower luminosity Sy 1 sample of Kotilainen & Ward (1994), the discs from Schade et al. (2000) as well as the discs found by Rönnback et al. (1996) at intermediate redshifts show largely normal colours compared to their inactive counterparts, as do our discs. It is difficult to assess whether this still holds for disc host galaxies of higher luminosities, due to their rapidly decreasing numbers above .
On the other hand, the colours of the ellipticals in a certain luminosity range seem to differ from their inactive counterparts. Both the ellipticals from Schade et al. as well as in this study appear bluer. However, at higher luminosities the elliptical hosts, as investigated by Dunlop et al. (2003), show perfectly inactive colours. Thus at high luminosities there exists at least one population of apparently normal elliptical host galaxies that have not recently (0.5 Gyrs) been involved in strong star formation.
8.4 Is it interaction?
Several known quasars show obvious signs of on-going merging with a second galaxy. 3C 48, one of the first quasars identified, has been thoroughly investigated with long-slit and integral field spectroscopy (Canalizo & Stockton, 2000; Chatzichristou et al., 1999). It was found that it is involved in a late stage of a merger, showing conversion of gas into new stars in local starbursts in several regions, turbulent flows of gas and a secondary nucleus. The starburst regions in the host of 3C 48 and similar objects show very blue colours. In our sample we find apparent signs of interaction like tails, asymmetries or double nuclei in a substantial fraction (50 per cent, 9/19) of our objects. Strong violent merger configurations are only apparent in a few of these, such as HE 1405–1545 or HE 1254–0934, and most of them do not appear as violent as 3C 48. The high fraction of host galaxies in merger state supports the picture that interaction might be important for fuelling of the nucleus. However, the existence of very symmetric and undisturbed host galaxies like HE 1043–1346 (spiral) and HE 1029–1401 (elliptical) shows that ongoing major mergers are not a prerequisite for quasar activity. Yet the observed blue colours of especially the elliptical hosts suggest that some unusual event in the not so distant past may be connected to the onset of nuclear activity.
This either requires a significant time delay (at least several 100 Myr) between the event and the ignition of the nucleus, or a very long duty cycle of the nuclear activity, or other mechanisms than major mergers to play a significant role. In any case, for Sa–Sc host galaxies the trigger for the nuclear activity cannot be major mergers, as these would destroy the observed disc structures. Thus probably minor mergers and maybe even quiescent gas accretion play a significant role in the nuclear fuelling.
Minor merger as the trigger could also explain qualitatively the correlation of colour and luminosity (or mass). An interaction with a companion of a given mass will have stronger effects on the lower mass than on the higher mass ellipticals, resulting in larger asymmetries, and, in the presence of gas, relatively stronger induced star formation.
9 Conclusions
Are QSO host galaxies just normal galaxies with an active nucleus? We find strong evidence that at least a subpopulation has significantly different colour properties than their inactive counterparts. While the disc dominated or spiral galaxies in our sample show statistically no difference in colour and age to inactive discs, the ellipticals exhibit abnormally blue colours and SEDs consistent not with old, evolved stellar populations.
Even though elliptical galaxies can be significantly more luminous than disc galaxies, the abnormally blue colours found are not a function of only luminosity. Both for our sample as well as that by Schade et al., the two classes of bulge vs. disc dominated hosts contain objects of similar luminosity (see Figs. 7 and 12). This suggests that the main difference lies in the morphological type of the host galaxy. However, at some point a luminosity – or mass – dependence has to exist, since the more massive elliptical host galaxies studied by Dunlop et al. show old evolved stellar populations and signs of only small recent star formation.
The correspondence between the QSO activity and the blue colours suggests a connection between galaxy interaction, induced star formation, and the onset of nuclear activity. However, we find that it is likely that mechanisms other than major mergers, such as minor merger or gas accretion, are responsible for the activity of both the high luminosity ellipticals as well as the disc-dominated host galaxies.
At this point the picture of how activity and interaction are connected is not clear. However, the abnormally blue colours of a sub-population are a strong indicator that for spheroid-dominated host galaxies, merging is an important factor in triggering nuclear activity.
Acknowledgments
The Nordic Optical Telescope is operated on the island of La Palma jointly by Denmark, Finland, Iceland, Norway, and Sweden, in the Spanish Observatorio del Roque de Los Muchachos of the Instituto de Astrofisica de Canarias.
KJ gratefully acknowledged support by the Studienstiftung des deutschen Volkes. This work was also partly supported by DFG grants Wi 1369/5–1 and Re 353/45-3. Thanks go to Eva Örndahl for discussions and the jointly taken NOT data, and to Martin Raue for compiling the companion statistics.
References
- Abraham et al. (1992) Abraham R. G., Crawford C. S., McHardy I. M., 1992, ApJ, 401, 474
- Antonucci (1993) Antonucci R., 1993, Ann. Rev. A&A, 31, 473
- Boroson et al. (1985) Boroson T. A., Persson S. E., Oke J. B., 1985, ApJ, 293, 120
- Bruzual & Charlot (1993) Bruzual G. A., Charlot S., 1993, ApJ, 405, 538
- Bruzual & Charlot (1996) Bruzual G. A., Charlot S., 1996, unpublished, ftp://gemini.tuc.noao.edu/pub/charlot/bc96
- Canalizo & Stockton (2000) Canalizo G., Stockton A., 2000, ApJ, 528, 201
- Chatzichristou et al. (1999) Chatzichristou E. T., Vanderriest C., Jaffe W., 1999, A&A, 343, 407
- Courbin et al. (2002) Courbin F., Letawe G., Magain P., Wisotzki L., Jablonka P., Jahnke K., Kuhlbrodt B., Alloin D., Meylan G., Minniti D., Burud L., 2002, A&A, 394, 863
- de Grijs (1998) de Grijs R., 1998, MNRAS, 299, 595
- de Vaucouleurs (1948) de Vaucouleurs G., 1948, Ann. Astrophys., 11, 247
- Dunlop et al. (2003) Dunlop J. S., McLure R. J., Kukula M. J., Baum S. A., O’Dea C. P., Hughes D. H., 2003, MNRAS, 340, 1095
- Dunlop et al. (1993) Dunlop J. S., Taylor G. L., Hughes D. H., Robson E. I., 1993, MNRAS, 264, 455
- Elvis et al. (1994) Elvis M., Wilkes B. J., McDowell J. C., Green R. F., Bechtold J., Willner S. P., Oey M. S., Polomski E., Cutri R., 1994, ApJS, 95, 1
- Faber et al. (1997) Faber S. M., Tremaine S., Ajhar E. A., Byun Y., Dressler A., Gebhardt K., Grillmair C., Kormendy J., Lauer T. R., Richstone D., 1997, AJ, 114, 1771
- Fioc & Rocca-Volmerange (1999) Fioc M., Rocca-Volmerange B., 1999, A&A, 351, 869
- Freeman (1970) Freeman K. C., 1970, ApJ, 160, 812
- Fukugita et al. (1995) Fukugita M., Shimasaku K., Ichikawa T., 1995, PASP, 107, 945
- Huang et al. (2003) Huang J.-S., Glazebrook K., Cowie L. L., Tinney C., 2003, apj, 584, 203
- Hubble (1926) Hubble E., 1926, ApJ, 64, 321
- Hughes et al. (2000) Hughes D. H., Kukula M. J., Dunlop J. S., Boroson T., 2000, MNRAS, 316, 204
- Hutchings & Neff (1992) Hutchings J. B., Neff S. G., 1992, AJ, 104, 1
- Jahnke (2002) Jahnke K., 2002, PhD thesis, University of Hamburg, http://www.sub.uni-hamburg.de/disse/726/dissertation.pdf
- Jahnke & Wisotzki (2003) Jahnke K., Wisotzki L., 2003, MNRAS (in press), astro-ph/0308177
- Kellermann et al. (1989) Kellermann K. I., Sramek R., Schmidt M., Shaffer D. B., Green R., 1989, AJ, 98, 1195
- Kennicut (1992) Kennicut R. C., 1992, ApJS, 79, 255
- Kinney et al. (1996) Kinney A. L., Calzetti D., Bohlin R. C., McQuade K., Storchi-Bergmann T., Schmitt H. R., 1996, ApJ, 467, 38
- Köhler et al. (1997) Köhler T., Groote D., Reimers D., Wisotzki L., 1997, A&A, 325, 502
- Kotilainen & Ward (1994) Kotilainen J. K., Ward M. J., 1994, MNRAS, 266, 953
- Kuhlbrodt et al. (2003) Kuhlbrodt B., Wisotzki L., Jahnke K., 2003, submitted to MNRAS
- Leitherer et al. (1996) Leitherer C., et al., 1996, PASP, 108, 996
- McLeod & Rieke (1994a) McLeod K. K., Rieke G. H., 1994a, ApJ, 420, 58
- McLeod & Rieke (1994b) McLeod K. K., Rieke G. H., 1994b, ApJ, 431, 137
- McLeod & Rieke (1995a) McLeod K. K., Rieke G. H., 1995a, ApJ, 454, L77
- McLeod & Rieke (1995b) McLeod K. K., Rieke G. H., 1995b, ApJ, 441, 96
- McLeod et al. (1999) McLeod K. K., Rieke G. H., Storri-Lombardi L. J., 1999, ApJ, 511, L67
- McLure et al. (1999) McLure R. J., Kukula M. J., Dunlop J. S., Baum S. A., O’Dea C. P., Hughes D. H., 1999, MNRAS, 308, 377
- Magorrian et al. (1998) Magorrian J., Tremaine S., Richstone D., Bender R., Bower G., Dressler A., Faber S. M., Gebhardt K., Green R., Grillmair C., Kormendy J., Lauer T., 1998, AJ, 115, 2285
- Mannucci et al. (2001) Mannucci F., Basile F., Poggianti B. M., Cimatti A., Daddi E., Pozzetti L., Vanzi L., 2001, MNRAS, 326, 745
- Maraston (1998) Maraston C., 1998, MNRAS, 300, 872
- Möllenhoff & Heidt (2001) Möllenhoff C., Heidt J., 2001, A&A, 368, 16
- Nolan et al. (2001) Nolan L. A., Dunlop J. S., Kukula M. J., Hughes D. H., Boroson T., Jimenez R., 2001, MNRAS, 323, 308
- Örndahl (2003) Örndahl E., 2003, PhD thesis, University of Uppsala
- Press et al. (1995) Press W. H., Teukolsky S. A., Vetterling W. T., Flannery B. P., 1995, Numerical recipes in C, 2nd edn. Cambridge University Press
- Reimers et al. (1996) Reimers D., Köhler T., Wisotzki L., 1996, A&AS, 115, 235
- Rönnback et al. (1996) Rönnback J., Van Groningen E., Wanders I., Örndahl E., 1996, MNRAS, 283, 282
- Scalo (1986) Scalo J. M., 1986, Fund Cosmic Phys, 11, 1
- Schade et al. (2000) Schade D., Boyle B. J., Letawsky M., 2000, MNRAS, 315, 498
- Schlegel et al. (1998) Schlegel D. J., Finkbeiner D. P., Davis M., 1998, ApJ, 500, 525
- Smith et al. (1986) Smith E. P., Heckman T. M., Bothun G. D., Romanishin W., Balick B., 1986, ApJ, 306, 64
- Taylor et al. (1996) Taylor G. L., Dunlop J. S., Hughes D. H., Robson E. I., 1996, MNRAS, 283, 930
- Tremblay & Merritt (1996) Tremblay B., Merritt D., 1996, AJ, 111, 2243
- Wisotzki et al. (2000) Wisotzki L., Christlieb N., Bade N., Beckmann V., Köhler T., Vanelle C., Reimers D., 2000, A&A, 358, 77
- Wisotzki et al. (1996) Wisotzki L., Köhler T., Groote D., Reimers D., 1996, A&AS, 115, 227