Detection of the Canis Major galaxy at ()=(244;-8) and in the background of Galactic open clusters††thanks: Based on archive data from observations made with the ESO-MPI WFI telescope, at ESO, La Silla, Chile under programme 170.A-0789(A).
Abstract
We report on the detection of Main Sequence stars belonging to the recently identified Canis Major galaxy in a field located at from the center of the stellar system. With Main Sequence fitting we obtain a distance modulus to the dwarf, corresponding to a distance of kpc, in full agreement with previous estimates based on the photometric parallax of M-giants. From the comparison with theoretical isochrones we constrain the age of the main population of the Canis Major system in the range Gyr. A blue plume of likely younger stars (age Gyr) is also identified. The available Colour Magnitude Diagrams of open clusters that may be projected onto the main body of Canis Major are also briefly analyzed. The position, distance and stellar population of the old open clusters AM-2 and Tombaugh 2 strongly suggest that they are physically associated with the Canis Major galaxy. Using our own photometry and data from 2MASS and the GSC2.2 surveys we demonstrate that the claim by Momany et al. that the CMa overdensity is entirely due to the Galactic warp is not supported by the existing observations, once all the available pieces of information are taken into account. It is shown that the CMa overdensity clearly emerges at a heliocentric distance of kpc above any overdensity possibly produced by the Galactic warp.
keywords:
Galaxy: structure - galaxies: dwarf - open clusters: general - open clusters: individual: NGC 2477, Tombaugh 1, Tombaugh 2, AM-2, Berkeley 331 Introduction
The process of hierarchical merging (White & Rees, 1978; White & Frenk, 1991) is generally accepted as the driving mechanism of the formation of giant galaxies. The study of the local (e.g. Galactic or in the Local Group) relics of such processes provides an unprecedentedly detailed insight of the current cosmological model as well as a formidable testbed for theories of galaxy formation. The case of the Sagittarius dwarf galaxy (Ibata et al., 1994, 1997, Sgr dSph) is emblematic, since we are presently observing it during its disruption into a giant stream contributing to the continued assembly of the Galactic halo with stars (see Ibata et al., 2001a, 2002; Ivezic et al., 2000; Newberg et al., 2002; Majewski et al., 2003, and references therein) and globular clusters (Bellazzini, Ferraro & Ibata, 2003a; Bellazzini et al., 2003b; Bellazzini, Ibata & Ferraro, 2003c). A similar case has been reported in M31 (Ibata et al., 2001b; McConnachie et al., 2003) and systematic searches in galaxies outside the Local Group are beginning (Pohlen et al., 2003).
An even more interesting case is provided by the recently discovered ring structure (the Monoceros Ring, hereafter the Ring, for brevity Newberg et al., 2002; Yanny et al., 2003; Ibata et al., 2003; Majewski et al., 2003; Rocha-Pinto et al., 2003) near the Galactic plane. The more recent observational results (Crane, 2003; Martin et al., 2004a) suggests that the Ring is the stream remnant of an in-plane accretion that may be contributing to the build-up of the thick disk (see also Helmi et al., 2003; Abadi et al., 2003).
In particular Martin et al. (2004a, hereafter Pap-I), while tracing the whole extent of the Ring using M-giants from the 2MASS database111See Cutri et al. (2003), Explanatory Supplement to the 2MASS All Sky Data Release, http://www.ipac.caltech.edu/2mass/releases/allsky/doc/explsup.html discovered a large overdensity of ”Ring-like” M-giants in the Canis Major constellation. The elliptical shape, the overall structure of this overdensity and its coincidence with a noticeable grouping of globular clusters (Bellazzini, Ibata & Ferraro, 2003c) led Martin et al. (2004a) to the conclusion that it is the relic of the dwarf galaxy whose disruption generated the Ring. The discovered relic (hereafter Canis Major galaxy, CMa) is approximately centered at galactic coordinates (l,b), it has a FWHM extension in the sky of in the latitude direction and it is located at kpc from the Sun (i.e., ), as obtained from the photometric parallax to M-giants introduced by Majewski et al. (2003). The mass, luminosity and characteristic dimensions of Canis Major appear quite similar to those of the Sgr dSph. The similarity with Sgr extends to other relevant characteristics: the two objects seem to host a similar grouping of globular clusters, and the upper RGB of both galaxies is dominated by stars of similar colour (M-giants), which are present in similar numbers in both galaxies. The analogy between the two systems may provide a useful guideline in the study of the newly discovered galaxy.
Martin et al. (2004a) obtained a near infrared (NIR) Colour Magnitude Diagram (CMD) of the discovered structure (e.g., their Fig. 8) showing a Red Giant Branch (RGB) extending to and a pronounced Red Clump (RC) at and . A Blue Plume (BP) of stars (of more uncertain nature) is also detected around . The Main Sequence (MS) of the CMa population is beyond the reach of 2MASS photometry. The degeneracy among distance, age, metallicity and reddening (which is particularly high and highly variable at such low latitudes) prevents any firm conclusion about the nature of the stellar population in the CMa structure. Furthermore the distance scale based on photometric parallax of M-giants is intrinsically uncertain (Bellazzini et al., 2003b; Majewski et al., 2003) and it is likely affected by a systematic effect leading to the underestimate of true distances (Martin et al., 2004a; Newberg et al., 2003). Hence, the detection of fainter stars belonging to the newly discovered galaxy, the access to alternative distance indicators than M-giants and the study of its stellar population in other wavelength ranges (than the NIR) are highly desirable to confirm the discovery presented in Pap-I and to obtain a clearer characterization of the system.
Here we present the first detection of the Main Sequence (MS) of the CMa system in a wide field located apart from its center, from deep B and V photometry of very recent ESO-WFI images taken from the ESO archive. We also take advantage of the fact that the low latitude region of sky covered by the CMa galaxy hosts a number of galactic open clusters (OC), most of them in the foreground. Thus we searched for existing wide field CCD photometry of these open clusters to look for evidence of a background population that may be related to the CMa galaxy. Unfortunately, modern wide field photometries of open clusters are quite rare since, typically, a field of few arcmin is sufficient to characterize the population of these clusters and the background population is an undesired contaminant for these kind of studies. Nevertheless, some interesting clues of the presence of CMa stars in these fields have been obtained, providing useful indications on the spatial extent of the system and guidance for future observations.
The list of the fields considered in the current study is reported in Table 1, where we report the position of the fields in Galactic coordinates, the field of view covered by the available observations, the angular distance from the center of CMa, an estimate of the reddening and the source of the data. The position of the various fields with respect to the CMa system is sketched in Fig. 1. Most of the photometry (catalogues in electronic form) used in this paper have been retrieved from the WEBDA222http://obswww.unige.ch/webda/webda.html database (Mermilliod, 1995). The adopted reddening values are taken from the maps by Schlegel, Finkbeiner & Davis (1998, SFD98), if not otherwise stated. All over the paper we adopt the reddening laws by Dean, Warren & Cousins (1978) for the (Cousins’) I band and by Rieke & Lebofsky (1985) for all the other passbands.
We anticipate that the data presented in this paper are not sufficient to definitely break the above quoted distance/age/metallicity/reddening degeneracy and that reliable spectroscopic abundances and dedicated optical photometry are still needed to obtain a fully consistent picture of the main characteristics of the galaxy. On the other hand, the results presented here should be regarded as a significant progress in the understanding of the CMa system as well as a confirmation of its existence.
Criticizing the results presented in Martin et al. (2004a) and in a previous preliminary version of the present paper circulated as a preprint, Momany et al. (2004, hereafter M04) claimed that the CMa overdensity is completely due to the North-South asymmetry produced by the Galactic warp (see Yusifov, 2004; Kuijken & Garcia-Ruiz, 2001, and references therein). We discuss this point in Sect. 4, demonstrating that the M04 hypothesis is clearly confuted by several independent observational evidences.
| Field Name | l | b | f.o.v. | dist333Angular distance from the centroid of CMa, in degrees. | E(B-V)444From the reddening maps by Schlegel, Finkbeiner & Davis (1998) | Ref. |
|---|---|---|---|---|---|---|
| F-XMM | 244.2 | -8.2 | 4.2 | 0.14 | This work | |
| NGC 2477 (B,V) | 253.6 | -5.8 | 13.6 | 0.77 | Momany et al. (2001) 555The (V,I) photometry by Kassis et al. (1997) has been also considered (f.o.v=). | |
| Tombaugh 1 | 232.3 | -7.3 | 7.7 | 0.43 | Carraro & Patat (1995) | |
| Berkeley 33 | 225.4 | -4.6 | 14.8 | 0.75 | Mazur, Kaluzny & Krzemińsky (1993) | |
| NGC 2204 | 226.0 | -16.1 | 15.9 | 0.10 | Kassis et al. (1997) | |
| Melotte 66 | 259.6 | -14.3 | 20.2 | 0.22 | Kassis et al. (1997) | |
| NGC 2243 | 239.5 | -18.0 | 10.5 | 0.07 | Kaluzny, Krzemińsky & Mazur (1996) | |
| Open Clusters666Possibly associated with CMa, see Sect. 5. | ||||||
| Arp-Madore 2 | 248.1 | -5.9 | 8.3 | 0.73 | Ortolani, Bica & Barbuy (1995) | |
| Tombaugh 2 | 232.9 | -6.9 | 6.9 | 0.39 | Kubiak et al. (1992) |


2 The MS of the Canis Major galaxy at .
2.1 Observational material and data reduction
We retrieved from the ESO archive a set of deep B and V images of a field located at (l;b)=(°), at from the center of CMa. The images were taken with the WFI camera777The WFI camera is a mosaic of eight pixels chips, with pixel scale arsec/px and with a total field of view of . See http://www.ls.eso.org/lasilla/Telescopes/2p2T/E2p2M/WFI/ for further details. mounted at the 2.2m telescope at ESO (La Silla, Chile) as part of the large programme Public Imaging Survey: WFI Follow-up of XMM-Newton Serendipitous Fields (170.A-0789(A)). We will refer to this field as the XMM Field (F-XMM), following the name of the original programme. All the calibrating images (bias, flat-fields, standard star fields) related to the same observational run were also retrieved.
To obtain stellar photometry of this field we selected the best-seeing, lowest airmass (), V and B images of the set taken during a photometric night in which observations of Landolt (1992) standard fields, taken with the same instrument, are also available (the night of February 1, 2003). The seeing and the exposure time are FWHM and 440 s for the V image, and FWHM and 360 s for the B image, respectively. The images were corrected for bias and flat-field using standard procedures within the IRAF environment mscred and were reduced using the PSF-fitting software DoPHOT (Schecter, Mateo & Saha, 1992). The images were searched for sources adopting a threshold above the background and modeling the spatial variation of the PSF with a quadratic polynomial (essentially the same approach adopted in Bellazzini et al., 2002b; Bellazzini, Ferraro & Ibata, 2000, and described in more detail in those papers). Only sources classified as bona-fide stars by DoPHOT were retained in the final catalogue of instrumental magnitudes, that was obtained by cross-correlating the individual B and V catalogues. All the sources having a photometric error (in B or in V) larger than 3 times the average error at their magnitude were also excluded from the catalogue. The instrumental photometry has been corrected for the geometric distortion affecting the WFI camera (due to the effect of scattered light, see Manfroid et al., 2001) with a simple empirical formula derived by M. Irwin from the photometry of several Landolt’s standard fields, that provides corrections very similar to the complex model provided by ESO 888See www.ls.eso.org/lasilla/Telescopes/2p2T/E2p2M/WFI/zeropoints/. The degree of crowding of the XMM Field is quite low, hence it has been easy to select a large number () of bright and isolated stars to obtain robust estimates of aperture corrections.
The instrumental magnitudes have been transformed to the Johnson-Cousins system with the calibrating equations
| (1) |
| (2) |
(where capital letters indicate calibrated magnitudes and lower case letters indicate instrumental magnitudes), obtained from observations of Landolt’s field SA98. The extended list of standard stars by Stetson (2000) has been adopted. The atmospheric extinction coefficients estimated on April 13, 2003 have been taken from the WFI homepage.
2.2 Artificial star experiments
To characterize the completeness of the F-XMM sample described above we performed a set of artificial star experiments. The artificial stars were extracted from a Luminosity Function (LF) similar to the observed one, modeled with the same PSF model used for the photometry (including spatial variations), and added onto the original frames ( at each run and adopting the strategy described in Bellazzini et al. (2002a, b), to avoid interferences between artificial stars) that were then reduced in the same way as the original scientific images. A total of stars were simulated in the V and B images. The completeness factor as a function of magnitude was determined separately for each passband, the joint completeness factor at any given colour is then obtained by the product .
2.3 The Colour Magnitude Diagram
The CMD of the XMM Field is shown in Fig. 2. The dotted, dashed and continuous lines indicate the locus of the CMD where the joint CF is 80%, 50% and 5%, respectively. In the following analysis we will ignore the sources fainter than the CF=5% limit.
Even a first glance to Fig. 2 shows that the F-XMM CMD is dominated by an unexpected sequence running from to , superposed on the typical field population. The morphology of the feature is typical of the MS of an intermediate-old stellar population. The possible Turn Off point (TO) of this sequence, at is slightly bluer than the blue edge of the vertical plume of TO field stars located at various distances along the line of sight (Gilmore & Wyse, 1987; Unavane, Wyse & Gilmore, 1996; Prandoni et al., 1999; Morrison et al., 2000), that is visible for around in this diagram. Note that the same characteristic (i.e. TO stars bluer than the average field TO stars) was one of the key elements that allowed the discovery of the Ring structure, that was first identified as an excess of stars of spectral type A-F (Newberg et al., 2002; Yanny et al., 2003). The sequence (as well as the overall appearance of the CMD) is also very similar to the Ring MS found by Ibata et al. (2003). As in the CMDs presented by these authors, the Sub Giant Branch (SGB) and the base of the Red Giant Branch (RGB) of the unexpected population are hidden by the contamination of Galactic field stars. The saturation level of the photometry, occurring at , prevents the detection of the Red Clump (RC) of Helium burning stars associated with the population, that are likely brighter than this limit.
Other noticeable features of the CMD are (1) a sparse blue plume at and , and (2) the vertical wedge-shaped plume of the local M dwarfs around .
2.4 Comparison with a Milky Way model
Lacking a suitable Control Field to compare with F-XMM we are forced to rely on a synthetic model of the stellar populations of the Milky Way. We adopt, here and in the following, the Galactic model by Robin et al. (2003, hereafter R03), from which it is possible to obtain synthetic CMDs for a given direction and field of view through a web interface. The model includes all the known Galactic components (thin and thick disc, halo and bulge) and takes into account the effects of the disc warp and flare. The last characteristic is particularly useful in the present context, since the (stellar) Galactic warp reaches its maximum projected density at in the southern Galactic hemisphere, not so far away from the patch of sky we are considering (Djorgovski & Sosin, 1989; López-Corredoira et al., 2002). We have checked the warp model adopted by R03 and we found it in excellent agreement with the observations presented by López-Corredoira et al. (2002). Robin et al. (2003) tested their model against observations in several directions and suggest that it provides reliable predictions down to . In the R03 model the extinction is modeled by a diffuse thin disc. In the comparisons with observed data presented in the following we adjusted the reddening assigned to synthetic stars by the model to match the observed degree of extinction toward the considered direction.

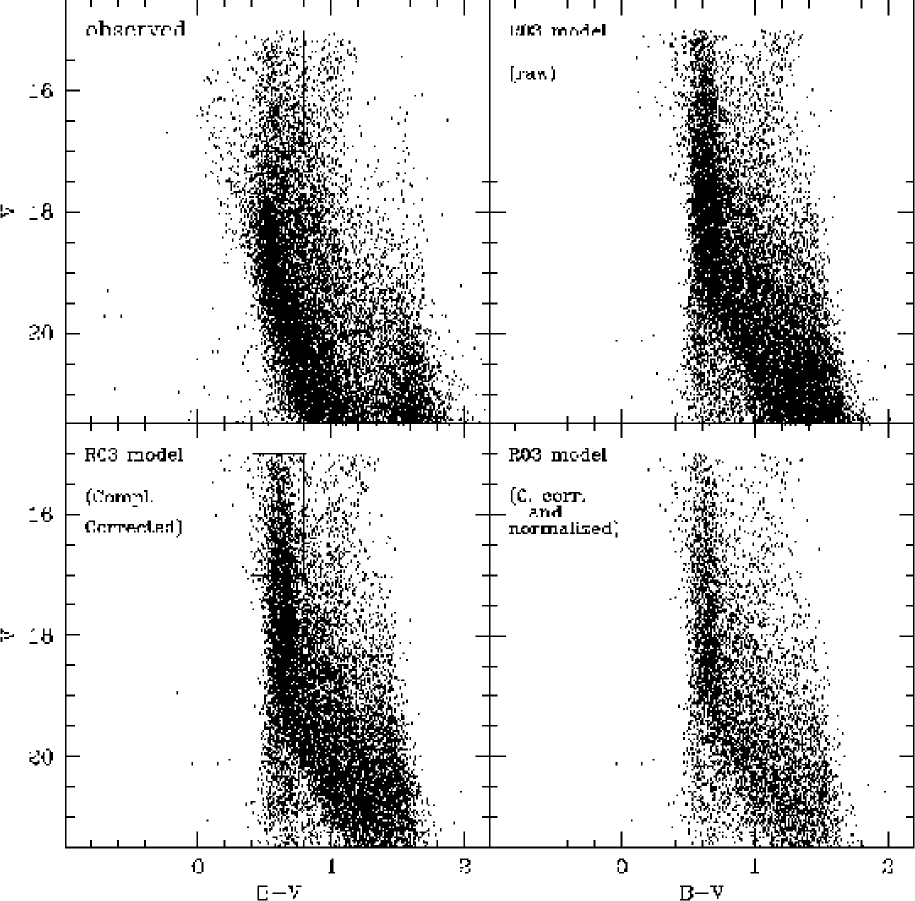
In Fig. 3 we compare the observed CMD of F-XMM with the predictions of the R03 models for a field of the same area and in the same direction. The comparison is limited to the range in which CF 50% in the observed sample, i.e. to . We included the effect of photometric “noise” by adding to each synthetic star a extracted at random from a Gaussian distribution having equal to the average photometric error of the observed stars at the considered magnitude.
Even from a first glance to the upper panels of Fig. 3 it is quite clear that the above-described sequence that dominates the F-XMM CMD has no counterpart in the Galactic model. In the latter CMD the vertical sequence of field MS stars reaches and then abruptly bends to the red, changing into a sparser sloped band with a sharp faint/blue edge. This is a well known general feature of the CMDs of Galactic fields, observed by various authors and predicted by all Galactic models (see, for example Castellani et al., 2002; Bellazzini, Ferraro & Buonanno, 1999a; Prandoni et al., 1999; Monaco et al., 2002; Ibata et al., 2003). On the other hand the observed “unknown” sequence curves gently, always remaining to the blue of the synthetic sequence down to (and beyond, not shown here), and remains densely clustered all over its length. The observed CMD shows also a clear excess of Blue Plume (BP; at and ) stars with respect to the synthetic CMD.
The direct comparison with the raw synthetic CMDs is not quantitatively correct since it neglects the incompleteness of the observed sample. In fact, the synthetic CMD is 100% complete at all magnitudes. The lower left panel of Fig. 3 shows the synthetic CMD once the incompleteness is taken into account. We have associated to each star of the raw synthetic sample the joint CF factor of the observed sample at its magnitude. Then we extracted at random a number in the range [0.0,1.0] and we compared it with the computed CF. If the random number was smaller than or equal to the characteristic CF of the synthetic star the star was retained, otherwise it was excluded from the sample. The overall appearance is now more similar to the observed CMD, in terms of number of stars in regions of the CMD dominated by bona fide field stars. However, the synthetic CMD still shows an excess of stars of a factor within the box superposed on the left-hand panels of Fig. 3, enclosing the brightest part of the sequence of field MS-TO stars. The synthetic M dwarfs brighter than are overabundant by the same factor with respect to their observed counterparts. These comparisons suggest that the model is over-predicting the number of field stars in this direction. To take into account also this possible effect we picked up stars at random from the completeness-corrected synthetic CMD until we obtained a sample having the same number of stars populating the selection box as the observed one. The CMD of the “normalized” sample is shown in the lower right panel of Fig. 3. This plot provides a realistic view of the contamination of the observed CMD by field stars. It may be appreciated that the highest degree of contamination is around the TO of the “unknown” sequence, around and for . Any eventual Sub Giant Branch of the unexpected population is completely hidden by field dwarfs having . These facts constitute the main limitation in obtaining strict constraints on the age of the newly-identified population.
In Fig. 4 we compare the LFs of the F-XMM field and of the synthetic sample for all stars having , to exclude the Galactic M dwarfs from the comparison. In the upper panel of Fig. 4 the observed LF is compared to the raw model predictions while in the lower panel the comparison is with the LF of the completeness-corrected and normalized synthetic sample. Fig. 4 shows that there is a significant excess of stars in the observed CMD corresponding to the unknown MS population, even if incompleteness and density normalization are not taken into account. The excess of observed stars arise between and and persist down to the limiting magnitude of the observed sample (not shown here).
From the above comparisons we conclude that in the XMM field there is indeed a conspicuous stellar population that is not comprised in the R03 Galactic Model. We identify this population with the newly discovered Canis Major stellar system, since the considered field is well within its main body, as described in Pap-I. Hence we identify the sequence dominating the F-XMM CMD as the MS of the Canis Major galaxy, revealed for the first time by the observations presented here.
2.5 Distance, metallicity and age
Wetry to constrain the distance to the CMa system in the XMM field by fitting the observed MS with theoretical isochrones. Here and in the following we will use isochrones taken from the very recent and complete set of Pietrinferni et al. (2004, hereafter P04999The isochrones can be retrieved from http://www.te.astro.it/BASTI/index.php).
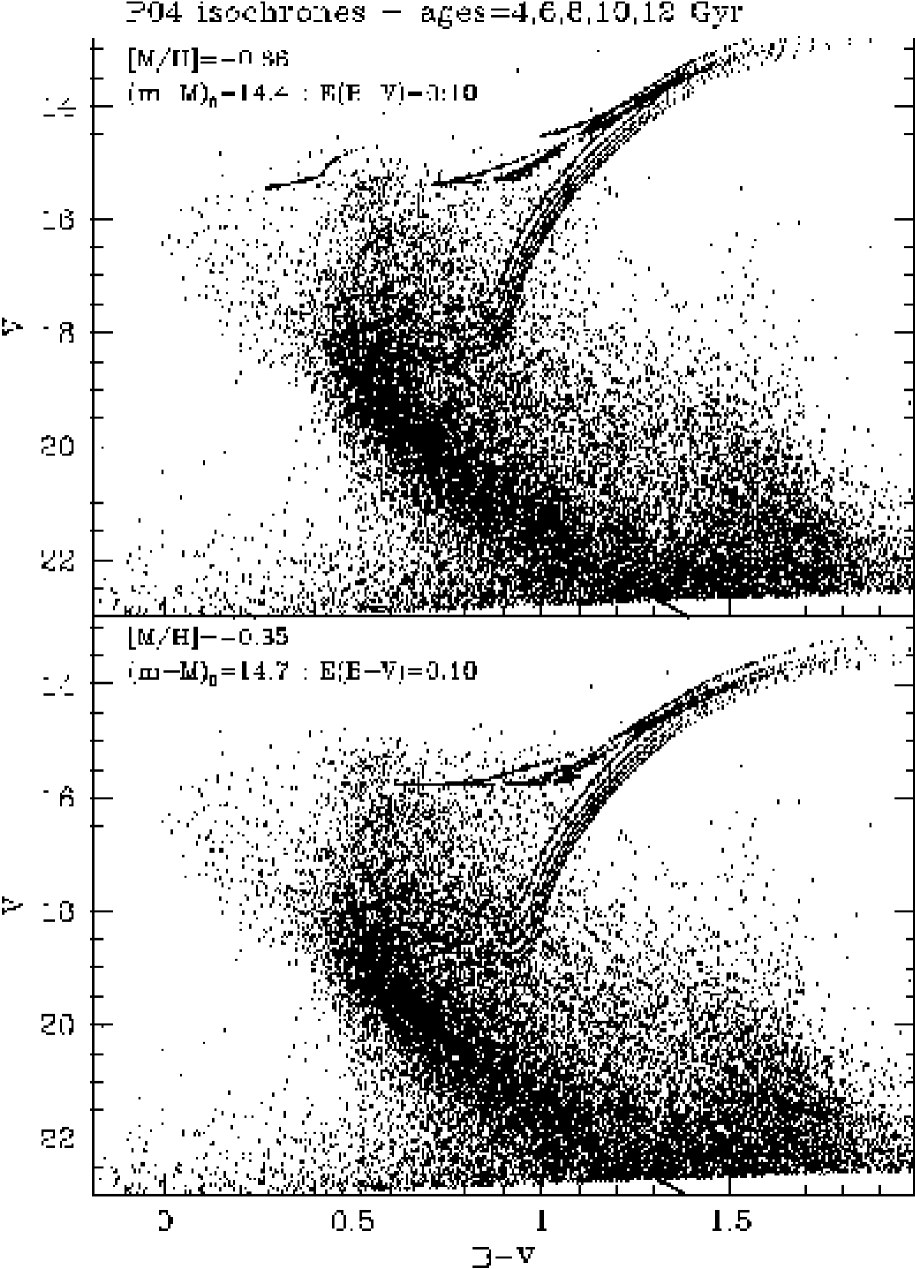
The fact that the RGB of the galaxy is dominated by M-giants strongly suggests a mean metallicity larger than (Bellazzini et al., 2003b; Rocha-Pinto et al., 2003; Martin et al., 2004a). In particular Crane (2003) derived from low resolution spectra of Ring M-giants in the vicinity of the main body of CMa. Hence we will adopt isochrones of metallicity and for the present analysis. The results of the MS-fitting procedure are shown in Fig. 5. The upper panel shows the comparison with isochrones with , the lower panel shows the comparison with isochrones.
In both cases the best fit is obtained assuming E(B-V)=, in reasonable agreement with the SFD98 reddening maps (E(B-V)=). Several authors have suggested that SFD98 reddening maps may overestimate the actual reddening by a factor (Stanek, 1998; Bonifacio, Monai & Beers, 2000; Dutra et al., 2003; Sumi, 2003). If this possible correction is taken into account the agreement between our best-fit reddening and the estimates of the SFD98 becomes excellent.
The best-fit distance modulus is and when the and isochrones are adopted, respectively. The value corresponds to a heliocentric distance of kpc, in full agreement with the estimate of Pap-I, within the uncertainties ( kpc). Similarly, corresponds to kpc, % larger than the estimate of Pap-I but still fully compatible with it, given the % systematic uncertainty affecting the M-giants distance scale adopted in that work (see Martin et al., 2004a; Newberg et al., 2003, for discussion).
No stringent constraint on metallicity can be derived from the comparisons shown in Fig. 5. We just note that the lower distance modulus obtained with the isochrones put the theoretical RC locus just above the saturation limit of our photometry, in better agreement with observations compared to the MS-fitting solution. It has also to be recalled that theoretical isochrones predict the location of the Zero Age Horizontal Branch, i.e. the faint edge of real distributions of Helium Burning stars.
A significant lower limit to the age of the main population can be obtained by comparison with isochrones with the bright end of the observed MS. From Fig. 5 we obtain an age Gyr for or an age Gyr for . On the other hand the corresponding upper limit is made greatly uncertain by the high degree of field contamination in this portion of the CMD. Ages as large as 10 Gyr cannot be excluded with the present data. Independent of the quoted uncertainties it should be also considered that (a) the CMa system probably hosts stars of various ages and metallicities, as most of the local dwarf galaxies actually do (Mateo, 1998), and (b) the galaxy has a sizable dimension along the line of sight ( mag, according to Pap-I), hence the observed CMD sequences may appear wider and less well-defined than in smaller or more distant systems just because of this differential-distance effect. Finally, to fully populate the observed Blue Plume, stars as young as Gyr should also be present in CMa, suggesting a recent (minor) burst of star formation, similar to what observed in the Sgr dSph (Bellazzini, Ferraro & Buonanno, 1999b; Layden & Sarajedini, 2000).
From the above comparisons it appears clear that more complete photometry (reaching the Tip of the RGB) and a suitable (observed) control field to perform a robust field decontamination are mandatory to obtain a deeper insight into the physical characteristics and the stellar content of the CMa system. Nevertheless, we have provided here the first clear detection of the MS of the galaxy, an independent estimate of its distance, in good agreement with the results of Pap-I, as well as the first broad constraint on the age of the main stellar populations of the system. In the following we will use the results obtained in this section as guidelines for the analysis of the CMD of populations possibly associated with the CMa/Ring system in the background of Galactic open clusters.
3 CMa in the background of Open Clusters?
We searched the WEBDA database for published CCD photometry of open clusters lying in the broad region covered by the CMa galaxy, i.e. and , according to Pap-I. We found a handful of possibly useful datasets (with sufficiently deep CCD data over a field of at least a few arcmin across), that we briefly analyze in the following. The considered photometries, being optimized to image nearby clusters, are too shallow to provide firm detections (and/or non-detections) of the CMa population. Uncertainties in the reddening may also affect the analysis of these fields. Nevertheless some interesting clues of the presence of CMa stars can still be found and may provide useful hints for future observations.
3.1 The background of NGC 2477
The open cluster NGC 2477 is located at (l,b)=(l=; b=). Its age is Gyr, its heliocentric distance is kpc (Kassis et al., 1997), and the metallicity is (Friel & Janes, 1993). Unfortunately, the field of NGC 2477 is strongly affected by interstellar extinction ( according SFD98), whose actual amount is very uncertain (see Hartwick, Hesser & McClure, 1972; Kassis et al., 1997) and varies significantly across the observed field (with a standard deviation of 0.07 mag, SFD98). This constitutes the major source of uncertainty for the results obtained in the following.
Momany et al. (2001) recently presented the B,V photometry of a wide field () centered on the cluster. The CMD obtained by Momany et al. (2001) is shown in the upper left panel of Fig. 6. The cluster MS is a narrow diagonal band crossing the CMD from , to , . The cluster RC is clearly visible at , . The most striking feature of the diagram is the large number of stars that are located along a wide sequence paralleling the cluster MS from , down to , . Indeed the feature is reminiscent of the upper MS - Turn Off (TO) region of an intermediate-old stellar population, like that described in the previous section and attributed to the CMa system. Moreover, from the bright head of this putative sequence departs a Blue Plume of stars (, ) similar to what is observed in the XMM field described in the previous section.
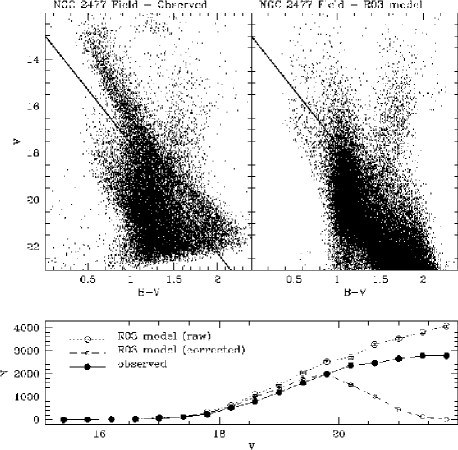
The upper right panel of Fig. 6 shows the corresponding synthetic CMD from the R03 model. The photometric uncertainties in the synthetic CMD have been implemented as described in Sect. 2.4, above. The diagonal line over-plotted on both the observed and synthetic CMDs is intended to separate the background MS population we are interested in from the bulk of the cluster stars. In the present case the synthetic CMD is quite similar to the observed one, if we neglect the sequences associated with the cluster, suggesting that the CMD is dominated by Galactic field population. However we note that (a) the actual morphology of the main observed sequence is different from what predicted by the model, (b) the BP population is much richer in the observed CMD, reaching also fainter magnitudes, (c) a sparse clump around and in the observed CMD seems to have no counterpart in the synthetic one (see below).
In the lower panel of Fig. 6 the LF of the stars lying to the blue of the selection line are compared. A slight excess in the synthetic LF is apparent for , growing toward fainter magnitudes and reaching a factor at the limiting magnitude of the observed CMD. However, it has to be considered that while the synthetic sample is 100% complete at any magnitude the observed sample should be significantly incomplete for , i.e. within the last two magnitudes from the faint limit of the photometry. Under similar conditions (i.e. same instrument, similar seeing, similar exposure times) the completeness of the F-XMM sample is always lower than 50% in the same range near the faint limit of the photometry. If we correct the synthetic LF for completeness (as done in Sect. 2.4, above) adopting the Completeness Function of F-XMM (shifted by mag to partially account for the different limiting magnitudes, i.e. for NGC 2477 and for F-XMM), the synthetic LF (small open circles) falls well below the observed one for . Hence, the test concerning the MS populations is not conclusive.
The case for the evolved population and for the Blue Plume is more interesting and it is briefly discussed below in comparison with the arguments provided by M04 to explain the population in the background of NGC 2477 as completely due to the Galactic warp. M04 made the same comparison shown in Fig. 6 here but they selected from the synthetic catalogue only the stars with heliocentric distance between 7 and 9 kpc, claiming that all the sequences possibly attributable to CMa (including the BP and the RC features) “are fully reproduced by the Galactic warped model” (R03). The comparisons shown in Fig. 7 below demonstrates that this is not actually the case.
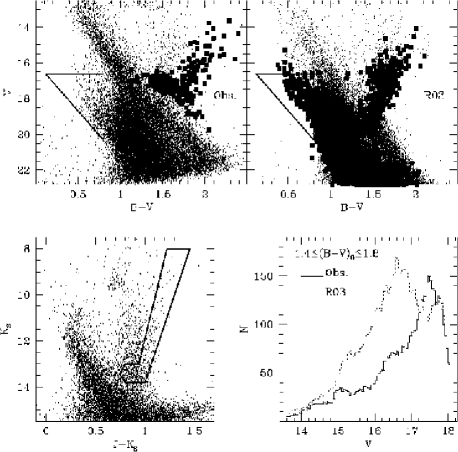
The upper panels of Fig. 7 shows once again the comparison between the observed CMD of NGC 2477 and its synthetic counterpart from R03 101010Actually a different realization with respect to that shown in Fig. 6. To check the effect of statistic noise on simulated CMD we analyzed four different realizations of the same synthetic sample in the present case. The differences among the various realizations are negligible under any relevant aspect.. We corrected the synthetic CMD with the same assumptions on reddening adopted by M04 (, after Bonifacio, Monai & Beers, 2000). In the observed CMD we plot as heavy dots the putative RC and RGB stars of CMa we have selected from the Near Infrared CMD of the same region that is shown in the lower left panel of Fig. 7. The RGB sequence is readily identified in this diagram and also the RC peak is more evident (see also Pap-I and references therein). The triangular box encloses the bluest part of the BP distribution (which extends to in the observed CMD). In the synthetic CMD we plotted as heavy dots the stars fulfilling the same selection criteria adopted by M04 ( kpc).
The overall morphology of the observed CMD is reasonably reproduced by the distance-selected synthetic sample, though there are still significant differences:
-
1.
The BP sequence is not correctly reproduced in position and in number. The observed stars falling in the selection box are 582 while the synthetic stars are just 285, a full 10 difference. Moreover the faint envelope of the synthetic BP sequence is one full magnitude brighter than the corresponding feature in the observed diagram.
-
2.
The selection of synthetic stars in heliocentric distance indeed show evidence for a Red Clump population. However, as clearly shown by the LFs in the lower right panel of Fig. 7, the synthetic RC peak is more than mag brighter than the observed one. Note that the positions of the peaks are unaffected by the inclusion of photometric errors in the synthetic sample. The synthetic RC appears more clumpy and well-defined in the plots produced by M04 (see their Fig. 3) because they neglect the effects of observational errors, but the average magnitude of the peak is the same as found here. Moreover, the overall comparison between the RC LFs suggests that the model is seriously overestimating the total number of stars in the field (as for F-XMM, see Sect. 2.4), providing a further reason to reconsider the comparison of MS LFs shown in Fig. 6.
-
3.
M04 found that the average metallicity of the selected synthetic sample (heavy dots) is and the average age is Gyr, similar to what is found for the CMa system. We verified these results with four different realizations of the synthetic sample of the NGC 2477 field and we fully confirm the metallicity result. However, it transpired that M04 misinterpreted the column of the output files of the R03 model labeled “age” as providing the age in Gyr of any given star. In fact this is an integer code number that classifies the stars according to the Galactic component they belong to (thin disc, thick disc, bulge and halo) and to age ranges, within the thin disc population (age/population class). Due to an incredibly lucky coincidence the average of the age/population class and of the actual age of the selected sample are the same (i.e. , a pure number, and Gyr, respectively) but the standard deviations are significantly different ( and Gyr, respectively). A closer look at the age/population class distribution shows that % of the selected stars have age Gyr, hence not similar to the typical CMa population, and % are thick disc stars, hence not possibly related to the warp. In conclusion, only less than 50% of the selected sample claimed to reproduce the CMa features can be realistically related to it.
-
4.
Finally, we note that there is no reasonable reddening value that may simultaneously allow a reasonable match to all the main features of the synthetic and observed CMDs of Fig. 7 (i.e. MS, BP and RC).
In conclusion the Galactic warped model adopted by M04 completely fails to reproduce the observations for what concerns the Blue Plume and the Red Clump in the background of NGC 2477. The possibility that these stars are associated with the CMa system or its debris (Ring) remains fully open. Deeper observations and extensive artificial stars tests are needed to verify the existence of their MS counterparts at .
3.2 The background of Tombaugh 1 and Berkeley 33
The open cluster Tombaugh 1 (Tom 1) is located at (l,b)=(). According to (Carraro & Patat, 1995) the most likely metallicity is , the age is Gyr and it is located at kpc from the Sun []. In the upper panels of Fig. 8 the CMD of Tom 1, as derived by (Carraro & Patat, 1995), is compared to the corresponding synthetic CMD from the R03 model. The observed CMD is dominated by the cluster MS going from and to and . Note that a broad and sparse parallel sequence seems to appear to the blue of the cluster MS (and of the selection line introduced in the previous section) at . The sequence seems to have no clear counterpart in the synthetic CMD and resembles the upper-MS of CMa as identified in F-XMM. The LFs shown in the lower panel of Fig. 8 confirms this view. The selected stars (i.e. the stars bluer than the selection line) are more numerous in the observed sample compared to the synthetic one all over the considered range of magnitudes (). Also in this case the observed sample should be drastically pruned by incompleteness in the considered range, so the real overdensity should be significantly larger than what is reported in Fig. 8.

The same comparison is shown in Fig. 9 for the field of the open cluster Berkeley 33 (Be 33). Be 33 is located at (l,b)=(). It has an age of Gyr and ; its distance from us is kpc (i.e., , Mazur, Kaluzny & Krzemińsky, 1993). The cluster MS crosses the diagrams from and to and .
Also in this case a wedge-shaped sequence possibly corresponding to the upper-MS of CMa is observed to the blue of the selection line and for . In this case the LFs of the observed and synthetic sample, shown in the lower panel of Fig. 9, are essentially indistinguishable. Again, the high degree of incompleteness that is expected to affect the observed sample for suggests the presence of an excess of stars not predicted by the Galactic model.
More complete and deeper photometry of wider fields surrounding the clusters are needed to confirm the tentative detections described above.

3.3 Fields at
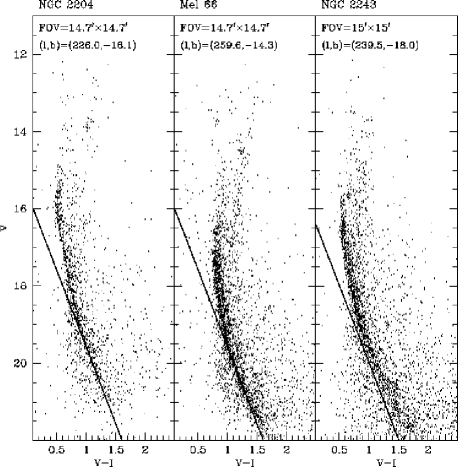
Finally, Fig. 10 shows the CMDs of three OCs having and , namely NGC 2204, Melotte 66 (Kassis et al., 1997), and NGC 2243 (Kaluzny, Krzemińsky & Mazur, 1996). In spite of the larger field of view with respect to the observations of Tom 1 and Be 33 described above, there is no sign of a defined upper-MS sequence to the blue of the selection lines in these CMDs. The assessment of the significance of a non-detection is a prohibitive task given the available observational material. The comparison with the CMDs of Tom 1 and Be 33 (note that NGC 2204 is essentially at the same galactic longitude as Be 33) simply suggests that the density of CMa stars is significantly decreased going from to .
From the analysis presented in this section we simply conclude that the existing CMDs sampling the stellar population in the background of clusters located in the same broad region of the sky that hosts the CMa system are compatible with the results presented in Pap-I regarding the overall structure of the galaxy. As a guideline for future observations it is also suggested that the additional effort required to observe wider fields and to obtain deeper photometry of clusters in this region may be worth doing and highly rewarding in terms of scientific returns, and it may also help to obtain a more thorough understanding of the population of the clusters themselves.
| Field Name | l | b | r | 111111Average reddening standard deviation from star-by-star interpolation on the SFD98 maps. | Data Source |
|---|---|---|---|---|---|
| CMa | – | 2MASS - PSC121212Point Source Catalogue | |||
| CMa-CF | – | 2MASS - PSC | |||
| WARP | – | 2MASS - PSC | |||
| WARP-CF | – | 2MASS - PSC | |||
| CMa (GSC2) | GSC2.2131313Only entries classified as stars have been retained in all the samples extracted from the GSC2.2 catalogue. | ||||
| CMa-CF (GSC2) | GSC2.2 | ||||
| WARP (GSC2) | GSC2.2 | ||||
| WARP-CF (GSC2) | GSC2.2 |
4 The CMa overdensity and the Galactic Warp
Reconsidering the results of Martin et al. (2004a), M04 studied the North/South asymmetry in starcounts of M-giants in the latitude stripe and in the latitude range and showed that in this spot of the sky the CMa overdensity is completely erased if (i) a model warp of amplitude is adopted and (ii) the correction introduced by Bonifacio, Monai & Beers (2000) is applied to the SFD98 reddening values. It is quite obvious that any overdensity in the proximity of the Galactic Plane can be locally reproduced by a particular model of the warp. What should be demonstrated is that a global model of the warp, broadly reproducing the observations in the whole Galaxy, is also able to reproduce the CMa overdensity.141414It should be noted that the warp model used by M04 is so crude that can be used only on small scale, by definition. To emulate the local effects of the Galactic warp they adopt as the plane of symmetry of the Galaxy, instead of . In Martin et al. (2004b) we show that the CMa overdensity is detected even using the M04 warp model, once the distance information is properly taken into account. In fact this is not the case with the only global model adopted by M04, i.e. the warped and flared Galactic model by R03 they use for comparison with the NGC 2477 field. Even accepting that this model reproduces the observations in the latter field (that is far from proven, see Sect. 3.1 above) it completely fails to reproduce the morphology of the CMD and the star counts in the XMM field, as exhaustively shown in Sect. 2.4, above. There, a very significant unexplained overdensity and stellar population remains, in excess of the warp model encapsulated in the R03 model. Moreover in their analysis M04 completely neglect the distance information provided by the photometric parallax of M-giants that is one of the key elements of the discovery presented in Pap-I. In the following we shall demonstrate that the consideration of this additional information easily singles out the CMa overdensity from the background of the Galactic warp.
While extensively checked with various sets of observations the R03 model cannot provide a completely safe comparison and the ideal testbed to proof the reality of the CMa structure is the real Galaxy. In the following subsections we perform direct comparisons with suitable control fields using data from 2MASS and from the GSC2.2151515See http://www-gsss.stsci.edu/gsc/gsc2/GSC2home.htm surveys.
4.1 CMa is not the warp: 2MASS data
All the tracers adopted in the literature to study the Galactic warp agree in placing the maximum amplitude of the southern Galactic warp around , the North/South asymmetry remaining near the maximum in the broad range (Yusifov, 2004; López-Corredoira et al., 2002). The classical parameter adopted to quantify the asymmetry produced by the warp at a given () is the ratio between the counts (of any given density tracer) in the northern Galactic hemisphere and the counts in the corresponding region in the southern hemisphere (), . At the longitudes of the maximum amplitude of the warp, R is in the southern warp (Yusifov, 2004; López-Corredoira et al., 2002). Here, since we deal with southern structures we will use . The typical value of around the southern maximum is , which we will adopt as a reference value in the following. In any case values of significantly larger than 1.0 indicate an asymmetry between the Galactic hemispheres, in particular an excess of star counts in the Southern hemisphere. Note that computing from a homogeneous dataset (as, for instance 2MASS) removes most of the problems associated with the incompleteness of the samples since the parameter is the ratio of starcounts from samples with very similar completeness as a function of magnitude.
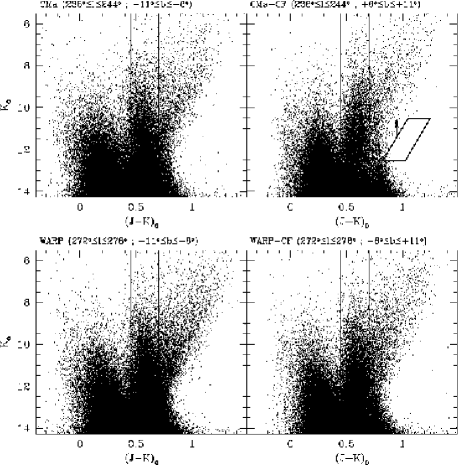
The key point of the following analysis is that if the CMa overdensity is due to the southern Galactic warp we shall observe similar overdensities and populations also around where the warp asymmetry should be similar if not larger. To do this comparison we carefully selected two windows of low reddening and of low average reddening and their respective control fields in the northern hemisphere with the same reddening constraints. The data have been taken from 2MASS adopting the same selections as in Bellazzini et al. (2003b). The chosen windows - of the same area and covering the same latitude ranges - are described in Table 2. For brevity the fields centered at have been dubbed CMa (South) and CMa-CF (North), those centered at are called WARP (South) and WARP-CF (North). The data have been corrected for extinction according to the SFD98 maps. We note that all the results presented in this section remain valid also if the recipe by Bonifacio, Monai & Beers (2000) is adopted. The CMDs of the four considered fields are shown in Fig. 11. The vertical lines enclose the color range populated by RC stars at various distances from us. The parallelogram plotted in the upper right panel of Fig. 11 is the same selection box adopted by Bellazzini et al. (2003b) to search for overdensities of M-giants as a function of distance. The box, shaped around the RGB of the Sgr dSph galaxy, is shifted along the magnitude axis counting the stars that fall into it as a function of the shift. The shifts are converted to distance moduli assuming for Sgr, as done by Majewski et al. (2003) and Martin et al. (2004a).

In Fig. 12 the distributions of as a function of magnitude and computed for stars in the color range of the Red Clump are plotted for different ranges of Galactic latitudes. In the range a strong peak in , reaching , is clearly detected in the CMa direction at . According to the model by Salaris & Girardi (2002), the absolute K magnitude of the Red Clump of a population having in the age range Gyr is . Hence the peak observed in the CMa direction corresponds to an overdensity at the distance , in good agreement with the distance estimates for the CMa galaxy obtained in Pap-I and in Sect. 2.5, above. Note also that the Full Width at Half Maximum of the peak is fully consistent with the FWHM of the CMa structure obtained in Pap-I (see Fig. 6, in Martin et al., 2004a). On the other hand in the WARP direction, while essentially everywhere, as expected, a much weaker peak is detected around . Let us assume that both the above described peaks are due to the Galactic warp. If we imagine the Galactic disc as a series of concentric circular rings with the outermost rings tilted (because of the warp, see Binney, 1992, and references therein) the structures at (CMa) and at (WARP) should lie at the same Galactocentric distance, i.e. in the same ring. Seen from the Sun, this ring should appear more distant in the WARP direction, as observed, given the fainter RC peak detected in the WARP field. However, to obtain the observed difference in the magnitude of the peaks ( mag) the warped ring should lie at a Galactocentric distance of kpc, implying a distance of the CMa structure from the Sun of kpc, in sharp contrast with the observations (see Pap-I and Sect. 2.5, above). On the other hand, assuming a realistic Sun-CMa distance of kpc, the difference between the two peaks should be mag, much larger than observed. The only way to save the original hypothesis, that the overdensities in the CMa and WARP directions belong to the same warped ring of the Galactic disc, is to admit that such a ring is not circular, but significantly elliptical instead (axis ratio ). Even in this (very unlikely) case it would be very hard to explain the large difference in the amplitude of the peaks, much higher toward than toward .

Even more interesting, in this sense, is the behaviour of the distributions at (Fig 12, middle panel). Here there is no more peak in the WARP direction. For the distribution of the field settles at the typical “warp” value (dotted line) while the CMa peak is as strong and well defined as at lower latitudes and in the same position. This comparison alone shows that (a) toward the South/North asymmetry in RC stars is significantly larger than in the WARP field (a difference larger than at ) and (b) the excess of counts in the CMa direction is confined to a well defined range of magnitudes corresponding to the distance of the CMa galaxy as obtained in Pap-I and in Sect. 2.5, here. It should be concluded that while around the distribution of RC stars is fully consistent with what is expected from the Galactic warp (see López-Corredoira et al., 2002), in the direction a clear and unexpected overdensity is observed at the distance of kpc, fully consistent with the results of Pap-I. It should be noted that the overdensity detected in the CMa direction is not only a South/North excess of starcounts in a limited range of distances but it is a clear excess with respect to what observed in the real warp, i.e. in the direction. The result is confirmed also in the latitude range , where the CMa peak begins to weaken, as expected (see Fig. 6 of Pap-I) while the WARP distribution is essentially unchanged (in agreement with the results by López-Corredoira et al., 2002, see their Fig. 15).
Finally, in the hypothesis that the South/North asymmetries observed in the CMa and WARP fields are both due to the Galactic warp, one can object that since the warp ring has a larger heliocentric distance in the direction than toward CMa, the same range samples different ranges in Z (linear distance from the Galactic plane) in the two directions. It can be conceived that a comparison of the distributions at the same Z is more appropriate than the comparisons shown in Fig. 12. Let us consider two possible scenarios:
-
1.
If we assume that the warp lies on a circular ring at the same Galactocentric distance as the observed CMa overdensity then the range toward CMa samples the same range in Z than the range in the WARP direction. Comparing the CMa distribution in the lower panel of Fig. 12 with that of the WARP field in the upper panel of the same figure it can be noted that the amplitude of the peaks is similar (the CMa peak being still the strongest of the two) but the difference in magnitude between the peaks is again mag, which would force the conclusion that the warp is elliptical (already discussed above).
-
2.
If we assume that the real difference in distance modulus between the warp as seen toward and toward is mag, as indicated by the position of the peaks in the upper panel of Fig. 12, then the comparison at the “same Z” should be done between the CMa distribution at and the WARP distribution at . Since the CMa distribution is essentially unchanged in the two latitude strips (upper and middle panels of Fig. 12) this hypothesis must be rejected: the CMa peak is much higher and at a different Galactocentric distance with respect to the peak at (possibly) attributable to the galactic warp. Note that this peak is seen only at , while it is completely lacking at higher latitudes.
Hence, the consideration of this possible effect is of no help to the M04 hypothesis: the observed distribution of RC stars in the CMa field cannot be reconciled with the distribution in the real warp (WARP field).
Essentially the same results are obtained from M giants, as shown in Fig. 13. In this case, since the tracers are much less numerous than RC stars and the signal-to-noise ratio of any structure is consequently lower, we had to adopt a coarser grid to compute and the final result is best appreciated when shown as the difference between the distributions in the considered directions () vs. ). It is clearly evident that the only significant excess is the broad peak in the range that is detected in all of the considered latitude ranges. Note that Fig. 13 is directly showing excesses in star counts in the CMa direction with respect to the WARP direction, hence the CMa clump of stars clearly emerges over the South/North overdensity due to the warp.
It must be concluded that the observed distributions of RC stars and M giants toward and toward are in clear contrast with the claim that the overdensity discovered in Pap-I and studied here is due to the Galactic warp (M04). On the other hand, the observational evidence confirms that around , at kpc from the Sun, there is a previously unknown stellar system that is clearly detected even above the underlying asymmetry due to the Galactic warp: the Canis Major galaxy.
4.2 CMa is not the warp: GSC2.2 data
The optical (photographic) photometry provided by the GSC2.2 catalogue is a much less homogeneous dataset with respect to 2MASS. The effect of interstellar extinction is much stronger in the GSC2.2 passbands (,) and the corresponding reddening laws are not well known. On the other hand a direct test performed on the F-XMM showed that the limiting magnitude of GSC2.2 photometry is mag fainter than that of 2MASS at . Hence the inspection of the GSC2.2 data may provide additional insight in the comparison between the CMa overdensity and the Galactic warp. We have selected from the GSC2.2 two small circular regions of radius toward the CMa and WARP directions and their respective northern Control Fields. The fields have been selected to have small and homogeneous reddening (see Tab. 2, for details). Comparison among the overall LF of the four fields indicates that the completeness of the samples is very similar down to . Small color shifts ( mag) have been applied to match the main features of the corresponding CMDs. We stress that the result discussed below is completely independent of the assumed shifts.
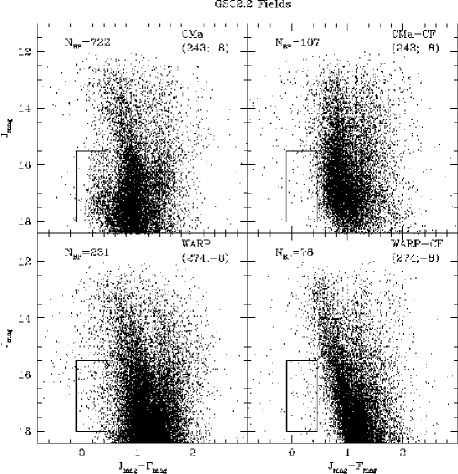
The CMDs of the selected fields are shown in Fig. 14. A detailed analysis of the diagrams suggests that there are differences in the stellar populations of the various fields, particularly at faint magnitudes, and the study of LFs of selected populations provides results fully compatible with those described in the previous section, above. However, given the possible problems with reddening corrections and the uncertain homogeneity of the samples161616The same kind of problems forced us to limit the comparisons with GSC2.2 data to smaller fields with respect to the analysis of 2MASS data. we drop this part of the analysis and concentrate on a single feature of the CMD, i.e. the Blue Plume. In Pap-I and (above all) in Sect. 2 and 3.1 above we have shown that the BP population is a distinctive feature of the CMa system. Fig. 14 shows that this feature emerges clearly also from the GSC2.2 data: the well populated BP observed in the CMa direction (upper left panel of Fig. 14) has no counterpart in any of the other considered fields. In particular the excess of BP stars (falling in the selection box reported in Fig. 14) in the CMa field with respect to the WARP field is at the level, i.e. very large and significant. This finding provides additional support to the conclusions of the previous section and indicates that there is at least a significant difference in the stellar populations hosted by the CMa system and by the Galactic warp.
4.3 Kinematics
M04 derived proper motions of M giants in the CMa overdensity and found that the tangential velocity of these stars is compatible with that of Galactic disc stars at similar distance. Here we simply note that this observation does not provide any conclusive argument on the nature of CMa since the uncertainties in the measured proper motions leave room for differences in tangential velocity as large as km/s. In a dedicated contribution (Martin et al., 2004b) we show that, on the other hand, CMa stars display a systemic radial velocity significantly different from that of disc stars at the same distance, further supporting the idea that CMa is an independent stellar system.
5 Clusters at the same distance as CMa
In Pap-I it has been noted that there is also an apparent overdensity of open clusters in the surroundings of the CMa galaxy (see also Frinchaboy et al., 2004; Forbes, Strader & Brodie, 2004). In the region of the sky considered in the present analysis we found useful photometry only for two of these clusters, namely Arp-Madore 2 (AM-2) and Tombaugh 2 (Tom 2).
According to the most recent studies (Lee, 1997; Ortolani, Bica & Barbuy, 1995) AM-2 is an old (age Gyr) and relatively metal poor () open cluster. Its position in the sky [(l,b)=()] and its distance modulus ( Lee, 1997) place it fully within the CMa system, according to the distance estimates derived in the present analysis. Note also that the metallicity and age of this cluster are fully compatible with what found for the dominant population of the galaxy (see Sect. 2.5). Unfortunately the field of view of the widest field photometry currently available (Ortolani, Bica & Barbuy, 1995) is too small () to allow a comparative study with the population surrounding the cluster (supposedly mainly composed by CMa stars). The cluster population dominates the field (in the range of magnitudes covered by the available CMD) at least out to the edge of the field observed by Ortolani, Bica & Barbuy (1995) though the density profile of the cluster appears to be essentially flat for (see, also Lee, 1997).
The main characteristics of Tom 2 are quite similar to that of AM-2, but in this case the wider field of view () of the best available photometry (Kubiak et al., 1992) permits a more fruitful preliminary analysis, in the present context. Tom 2 has the same metallicity as AM-2 (, from high resolution spectroscopy by Brown et al., 1996) and a similar age ( Gyr, the quoted age difference with AM-2 is probably consistent with zero within the uncertainties). It is located at (l,b)=() and its distance modulus (, according to Kubiak et al., 1992) is consistent with that of the CMa galaxy, within the errors. Also in this case the stellar population is similar at any distance from the cluster center (within the available field) though the profile is flat for (see Kubiak et al., 1992).
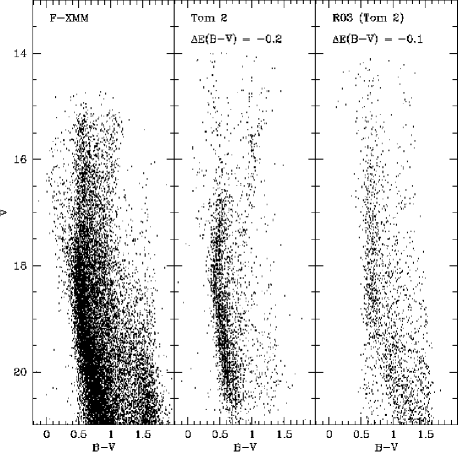
In Fig. 15 the CMD of Tom 2 is compared with the CMD of F-XMM and with a synthetic CMD from the R03 model of the Tom 2 field. The observed and synthetic CMDs of Tom 2 have been shifted to the same reddening as F-XMM, correcting for the reddening differences indicated in the plot. The similarity of the Tom 2 population with that of CMa is striking and suggests an intimate connection between the cluster and the galaxy, confirming the hypotheses advanced by Martin et al. (2004a) and Frinchaboy et al. (2004).
All of the results and discussion presented above suggests that AM-2 and Tom 2 are physically associated with the CMa system. A case strictly analogous to that of Tom 2, i.e. a cluster having a population indistinguishable from the dominant population of the parent galaxy, is that of Ter 7 in the Sgr dSph (see Marconi et al., 1997). This cluster is also similar to AM-2 and Tom 2 in age and metal content. For Tom 2 the hypothesis may also be advanced that it is not a genuine cluster but a mere overdensity within the Canis Major galaxy, of the kind that have been observed in the Sgr dSph (Ibata et al., 1997; Bellazzini, Ferraro & Buonanno, 1999a) and in the UMi dSph (see Bellazzini et al., 2002b, and references therein). The issue can be definitely settled only with the observation of a significantly wider field surrounding the cluster.
6 Summary and Conclusions
We have detected, for the first time, the Main Sequence of the main stellar population of the newly discovered galaxy in Canis Major (Pap-I), from photometry of a wide field located at from its center (the XMM field). From the analysis of the CMD of the XMM field we conclude that:
-
•
The stellar population observed in the XMM field has no counterpart in the R03 Galactic model.
- •
-
•
The age of the main population of CMa lies in the range age Gyr, slightly depending on the assumed metallicity.
-
•
There is a sparse population of younger stars (age Gyr) that is also associated with the CMa system (Blue Plume).
Tentative detections of stars related to the CMa/Ring system are presented for the fields surrounding the open clusters NGC 2477, Tombaugh 1 and Berkeley 33. The cases of two open clusters (AM 2 and Tombaugh 2) that may be physically associated with the CMa system have also been discussed. The results presented in this study provide independent confirmation, full support and complement the results of Martin et al. (2004a), that described for the first time the CMa stellar system.
The claim by Momany et al. (2004) that the CMa overdensity could be entirely due to the South/North asymmetry produced by the Galactic warp has been demonstrated to lack the essential observational basis. Using the F-XMM data we have shown that the warp model encapsulated in the R03 model (used by M04 to substantiate their claim) fails to reproduce both the star counts and CMD morphology observed in this field, located at from the center of the CMa system. Using Red Clump and M giant stars from 2MASS we have shown that (a) the CMa overdensity is much larger than that produced by the warp, and (b) it is found only at a well defined distance not compatible with the warp, fully confirming the results of Pap-I and demonstrating that if all the available information is taken into account the CMa overdensity clearly emerges above the “noise” provided by the Galactic warp. Using GSC2.2 data we demonstrated that the Blue Plume population is a distinctive characteristic of the CMa system that has no comparable counterpart neither in Northern Control Fields or in fields sampling the real warp.
A better characterization of the stellar content and star formation history of the CMa system must wait for dedicated photometry and spectroscopy fully suited for the study of this difficult target, immersed in very contaminated and extincted regions of the sky. Here we tried to obtain the best possible characterization of the system from existing and publicly available data, as an immediate follow-up of the discovery.
Future searches for CMa stars in the background of other targets may prove extremely useful in characterizing the spatial distribution of the galaxy and, in particular, of the associated Ring. The relevant change of view is that what may be perceived as an undesired contaminant of a given observation may hide more astrophysical information than the target itself. This is true either if the background object is an unknown stellar system (as CMa or Sgr) either if it is a poorly characterized Galactic component, as the stellar warp of the Milky Way (Binney, 1992; Kuijken & Garcia-Ruiz, 2001). The lessons provided by the Sgr dSph (and Stream) and by the CMa galaxy (and Ring) suggests to all of us a renewed attitude in the analysis of astronomical data, to avoid missing relevant pieces of information hidden in the background of our main targets.
Acknowledgments
This work would not have been possible without the WEBDA database, developed and maintained by J.-C. Mermilliod at the Geneva University, and without the effort of many colleagues involved in the study of open clusters that made their data publicly available through this database. We are grateful to A. Bragaglia and M. Tosi for many useful discussions about open clusters and the Galactic Disk and to G. Carraro for providing his photometry of Saurer’s clusters in electronic form and in advance of publication. Part of the data analysis has been performed using software developed by P. Montegriffo at the Bologna Observatory (INAF). The (anonymous) Referee is warmly thanked for comments and suggestions that significantly improved the overall quality of the paper.
This research is partially supported by the Italian Ministero dell’Università e della Ricerca Scientifica (MURST) through the COFIN grant p. 2002028935, assigned to the project Distance and Stellar Populations in the galaxies of the Local Group. The support of ASI is also acknowledged.
This research has made use of ESO/EIS Pre-FLAMES data whose observations have been carried out using the MPG/ESO 2.2m Telescope at the La Silla observatory under Program-ID No. 164.O-0561. This publication makes use of data products from the Two Micron All Sky Survey, which is a joint project of the University of Massachusetts and the Infrared Processing and Analysis Center/California Institute of Technology, funded by the National Aeronautics and Space Administration and the National Science Foundation. The Guide Star Catalog was produced at the Space Telescope Science Institute under U.S. Government grant. These data are based on photographic data obtained using the Oschin Schmidt Telescope on Palomar Mountain and the UK Schmidt Telescope. The Oschin Schmidt Telescope is operated by the California Institute of Technology and Palomar Observatory. The UK Schmidt Telescope was operated by the Royal Observatory Edinburgh, with funding from the UK Science and Engineering Research Council (later the UK Particle Physics and Astronomy Research Council), until 1988 June, and thereafter by the Anglo-Australian Observatory. The blue plates of the southern Sky Atlas and its Equatorial Extension (together known as the SERC-J), as well as the Equatorial Red (ER) were all taken with the UK Schmidt. This research has made use of NASA’s Astrophysics Data System Abstract Service.
M.B. dedicates this work to Eugenio Pastore, who’s walking with the dogs of the Heavens.
References
- Abadi et al. (2003) Abadi M.G., Navarro J.F., Steinmetz M., Eke V.R., 2003, ApJ, 597, 21
- Alard (2001) Alard C., 2001, A&A, 377,398
- Bellazzini, Ferraro & Buonanno (1999a) Bellazzini M., Ferraro F.R., Buonanno R., 1999a, MNRAS, 304, 633
- Bellazzini, Ferraro & Buonanno (1999b) Bellazzini M., Ferraro F.R., Buonanno R., 1999b, MNRAS, 307, 619
- Bellazzini, Ferraro & Ibata (2000) Bellazzini M., Ferraro F.R., Ibata R., 2002, AJ, 124, 915
- Bellazzini et al. (2002b) Bellazzini M., Ferraro F.R., Origlia L., Pancino E., Monaco L., Oliva E., 2002b, AJ, 124, 3222
- Bellazzini et al. (2002a) Bellazzini M., Fusi Pecci F., Messineo M., Monaco L., Rood R.T., 2002a, AJ, 123, 1509
- Bellazzini, Ferraro & Ibata (2003a) Bellazzini M., Ferraro F.R., Ibata R., 2003a, AJ, 125, 188
- Bellazzini et al. (2003b) Bellazzini M., Ibata R., Ferraro F.R., Testa V., 2003b, A&A, 405, 577
- Bellazzini, Ibata & Ferraro (2003c) Bellazzini M., Ibata R., Ferraro F.R., 2003c, in Satellites and Tidal Tails, D. Martinez-Delgado and F. Prada Eds., S. Francisco, ASP, ASP Conf. Series, in press (astro-ph/0304502)
- Bica, Ortolani & Barbuy (2000) Bica E., Ortolani S., Barbuy B., 2000, A&AS, 145, 399
- Binney (1992) Binney J., 1992, ARAA, 30,51
- Bonifacio, Monai & Beers (2000) Bonifacio P., Monai S., Beers T.C., 2000, AJ, 120, 2065
- Brown et al. (1996) Brown J.A., Wallerstein G., Geisler D., Oke J.B., 1996, AJ, 112, 1551
- Carraro & Patat (1995) Carraro G., Patat F., 1995, MNRAS, 276, 563
- Carraro & Baume (2003) Carraro G., Baume G., 2003, MNRAS, 346, 18
- Castellani et al. (2002) Castellani V., Cignoni M., Degl’Innocenti S., Petroni S., Prada Moroni P.G., 2002, MNRAS, 334, 69
- Chen et al. (1999) Chen B., et al., 1999, A&A, 352, 459
- Cole (2001) Cole, A.A., 2001, ApJ, 559, L17
- Crane (2003) Crane J.D., Majewski S.R., Rocha-Pinto H., Frinchaboy P.M., Skrutskie M.F., Law R.D., 2003, ApJ, 594, L119
- Dean, Warren & Cousins (1978) Dean J.F., Warren P.R., Cousins A.W.J., 1978, MNRAS, 183, 569
- Djorgovski & Sosin (1989) Djorgovski S., Sosin C., 1989, ApJ, 341, L13
- Dutra et al. (2003) Dutra C.M., Ahumada A.V., Clarià J.J., Bica E., Barbuy B., 2003, A&A, 408, 287
- Forbes, Strader & Brodie (2004) Forbes D.A., Strader J., Brodie J.P., 2004, AJ, 127, 3394
- Frinchaboy et al. (2004) Frinchaboy P.M., et al., 2004, ApJ, 602, L21
- Friel & Janes (1993) Friel E.D., Janes K.A., 1993, A&AS, 267, 75
- Fukugita et al. (1996) Fukugita M., Ichikawa T., Gunn J.E., Doi M., Shimasaku K., Schneider D.P., 1996, AJ, 111, 1748
- Gilmore & Wyse (1987) Gilmore G., Wyse, R.F.G., 1987, in The Galaxy, W. Carswell and G. Gilmore Eds., Dordrecht, Reidel, 247
- Hartwick, Hesser & McClure (1972) Hartwick F.D.A. , Hesser J.E., McClure R.D., 1972, ApJ, 174, 557
- Helmi et al. (2003) Helmi A., Navarro J., Meza A, Steinmetz M., Eke V., 2003, ApJ, 592, L25
- Ibata et al. (1994) Ibata, R.A., Irwin, M.J., Gilmore, G., 1994, Nature, 370, 194
- Ibata et al. (1997) Ibata, R.A., Wyse, R.F.G., Gilmore, G., Irwin, M.J., & Suntzeff, N.B., 1997, AJ, 113, 634
- Ibata et al. (2001a) Ibata R., Lewis G., Irwin M., Totten E., Quinn T., 2001a, ApJ, 551, 294
- Ibata et al. (2001b) Ibata R., Irwin M., Lewis G., Ferguson A.M.N., Tanvir N., 2001b, Nature, 412, 49
- Ibata et al. (2002) Ibata R., Lewis G., Irwin M., Cambrésy L., 2002, MNRAS, 332, 921
- Ibata et al. (2003) Ibata R., Irwin M., Lewis G., Ferguson A., Tanvir N., 2003, MNRAS, 340, L21
- Ivezic et al. (2000) Ivezic, Z., et al., 2000, AJ, 120, 963
- Kaluzny, Krzemińsky & Mazur (1996) Kaluzny J., Krzemińsky W., Mazur B., 1996, A&AS, 118, 303
- Kassis et al. (1997) Kassis M., Janes K.A., Friel E.D., Phelps R.L., 1997, AJ, 113, 1723
- Kubiak et al. (1992) Kubiak M., Kaluzny J., Krzemińsky W., Mateo M., 1992, Acta Astronomica, 42, 155
- Kuijken & Garcia-Ruiz (2001) Kuijken K., Garcia-Ruiz I. ,2001, in Galaxy Disks and Disk Galaxies, J.G. Funes, S. J. and Enrico Maria Corsini Eds., San Francisco: ASP , ASP Conf. Series, Vol. 230, 401
- Landolt (1992) Landolt, A.U., 1992, AJ, 104, 340
- Layden & Sarajedini (2000) Layden A.C., Sarajedini A., 2000, AJ, 119, 1760
- Lee (1997) Lee M.G., 1997, AJ, 113, 729
- López-Corredoira et al. (2002) López-Corredoira M., Cabrera-Lavers A., Garzón F., Hammersley P.L., 2002, A&A, 394, 883
- Majewski et al. (2003) Majewski S., Skrutskie M., Weinberg M., Ostheimer J., 2003, ApJ, 599, 1082
- Marconi et al. (1997) Marconi G., Buonanno R., Castellani M., Iannicola G., Pasquini L., Molaro P., 1997, A&A, 330, 453
- Manfroid et al. (2001) Manfroid J., Selman F., Jones H., 2001, The Messenger, 104, 16
- Martin et al. (2004a) Martin N., Ibata R.A., Bellazzini M., Irwin M.J., Lewis G.F., Dehnen W., 2004a, MNRAS, 348, 12 (Pap-I)
- Martin et al. (2004b) Martin N., Ibata R.A., Bellazzini M., Conn B., Irwin M.J., Lewis G.F., McConnachie A.W., 2004b, MNRAS, submitted
- Mateo (1998) Mateo M., 1998, ARA&A, 36, 435
- Mazur, Kaluzny & Krzemińsky (1993) Mazur B., Kaluzny J., Krzemińsky W., 1992, MNRAS, 265, 405
- McConnachie et al. (2003) McConnachie A.W., Irwin M., Ibata R., Ferguson A.M.N., Lewis G., Tanvir N., 2003, MNRAS, 343, 1335
- Mermilliod (1995) Mermilliod J.-C., 1995, in Information and On-Line Data in Astronomy, D. Egret and M.A. Albrecht Eds., Dordrecht, Kluwer, 127
- Monaco et al. (2002) Monaco, L., Ferraro, F.R., Bellazzini, M., Pancino, E., 2002, ApJ, 578, L47
- Momany et al. (2001) Momany Y., et al., 2001, A&A, 379, 436
- Momany et al. (2004) Momany Y., Zaggia S.R., Bonifacio P., Piotto G., De Anfeli F., Bedin L.R., Carraro G., 2004, A&A Letters, in press (astro-ph/0405526) [M04]
- Morrison et al. (2000) Morrison H.L., Mateo M., Olszewski E.W., et al., 2000, AJ, 119, 2254
- Newberg et al. (2002) Newberg H., et al. 2002, ApJ, 569, 245
- Newberg et al. (2003) Newberg H., et al. 2003, ApJ, 596, L191
- Ortolani, Bica & Barbuy (1995) Ortolani S., Bica E., Barbuy B., 1995, A&A, 300, 726
- Pietrinferni et al. (2004) Pietrinferni A., Cassisi S., Salaris M., Castelli F., 2004, ApJ, in press, (astro-ph/0405193)
- Pohlen et al. (2003) Pohlen M., Martinez-Delgado D., Majewski S., Palma C., Prada F., Balcells M., 2003, in Satellites and Tidal Tails D. Martinez-delgado and F. Prada Eds., S. Francisco, ASP, ASP Conf. Series, in press (astro-ph/0308142)
- Prandoni et al. (1999) Prandoni I., et al., 1999, A&A, 345, 448
- Rieke & Lebofsky (1985) Rieke G.H, Lebofsky M.J., 1985, ApJ, 290, 116
- Robin et al. (2003) Robin A.C., Reylé S., Derrière S., Picaud S., 2003, A&A, 409, 523 [R03]
- Rocha-Pinto et al. (2003) Rocha-Pinto H., Majewski S., Skrutskie M., Crane J., 2003, ApJ, 594, L115
- Salaris & Girardi (2002) Salaris M., Girardi L., 2002, MNRAS, 337, 332
- Schecter, Mateo & Saha (1992) Schecter, P.L., Mateo, M., Saha, A., 1992, PASP, 105, 1342
- Schlegel, Finkbeiner & Davis (1998) Schlegel D., Finkbeiner D., Davis M., 1998, ApJ 500, 525 (SFD98)
- Stanek (1998) Stanek K.Z., 1998, astro-ph/9802307
- Stetson (2000) Stetson, P. , 2000, PASP, 112, 925
- Sumi (2003) Sumi T., 2003, MNRAS, 349, 193
- Unavane, Wyse & Gilmore (1996) Unavane M., Wyse R.F.G., Gilmore G., 1996, MNRAS, 278, 727
- White & Rees (1978) White S., Rees M., 1978, MNRAS, 183, 341
- White & Frenk (1991) White S., Frenk C., 1991, ApJ, 379, 52
- Yanny et al. (2003) Yanny B., et al. 2003, ApJ 588, 824
- Yusifov (2004) Yusifov I., 2004, in The Magnetized Interstellar Medium, B. Uyaniker, W. Reich & R. Wielebinski Eds., in press (astro-ph/0405517)