CDM in LSB Galaxies: Toward the Optimal Halo Profile
Abstract
Low Surface Brightness (LSB) galaxies are dominated by dark matter. High-resolution rotation curves suggest that their total mass-density distributions are dominated by constant density cores rather than the steep and cuspy distributions found in Cold Dark Matter (CDM) simulations. The data are best described by a model with a soft core with an inner power-law mass-density slope . However no single universal halo profile provides an adequate description of the data. The observed mass profiles appear to be inconsistent with CDM.
Department of Physics and Astronomy, Cardiff University, 5 The Parade, Cardiff, CF24 3YB, UK
1. Introduction
Cosmological numerical Cold Dark Matter (CDM) simulations predict a specific and universal shape for the dark matter density distributions of galaxies. This was investigated in detail by Navarro, Frenk & White (1996, 1997) [NFW] who found that the mass-density distribution in the inner parts of simulated dark-matter-only CDM halos could best be described by a power law. This is however not what is typically observed: the mass-density distributions of, for example, dwarfs and late-type galaxies (which do include baryons) are best described by an almost constant density central core (de Blok et al. 2001b). This disagreement has become known as the “cusp/core problem”.
There has been much discussion of the validity of both observations and simulations. My intention here is not to give an exhaustive review of this debate. Rather I want to highlight some of the concerns and criticisms of both observers and simulators, and discuss them from an observer’s point of view (and in the spirit of the Sydney panel discussion I will do this in a slightly provocative manner).
2. The Data
2.1. Consistency and Repeatability
The rotation curves of LSB galaxies are some of the primary evidence for the failure of the NFW model in the centres of galaxies. How reliable are these data? An often heard complaint is that rotation curve observers cannot seem to agree amongst themselves on their own data. Unfortunately, this is occasionally used as an excuse to dismiss these data. This apparent disagreement is mostly a sociological effect. A large part of it can be traced back to spin (where I use the non-astronomical definition of the word) and over-reliance on a few discrepant rotation curves that have usually already been rejected by the observers.
Systematic effects due to pointing of the telescope or beam-smearing also feature prominently. In the latter case the few curves where beam-smearing was at the time a genuine problem have received a great deal of attention (e.g. Swaters et al. 2000), in contrast with the dozen or so where the problem was insignificant (de Blok et al. 2001a, de Blok & Bosma 2002). Beam-smearing was and is a red herring.
Similar conclusions apply to the pointing “problem”. Here the observed shallow slopes are thought to be caused by the spectrograph slit not being precisely centered on the galaxy. This would then cause an NFW halo to mimic a halo with a shallow profile. The problem is that one would have to miss the centre of a galaxy with an NFW halo by an average of or so to observe an apparently shallow profile (de Blok, Bosma & McGaugh 2003). In reality the centre of a galaxy can be acquired with an accuracy of , an order of magnitude better. In addition, if NFW halos are really prominently present in LSB galaxies one would have to miss the centres of these galaxies by a factor of 10 more than the pointing error for each and every of the over 80 galaxies observed. If pointing errors are not the problem, but rather offsets between the dynamical and photometric centres of galaxies, then the value translates into a physical offset of kpc (for the galaxies in de Blok et al. 2003). This would mean that in many LSB and dwarf galaxies optical and dynamical centres would be separated by roughly a disk scalelength!
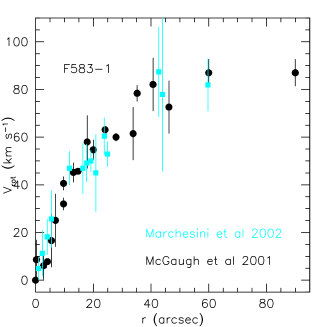
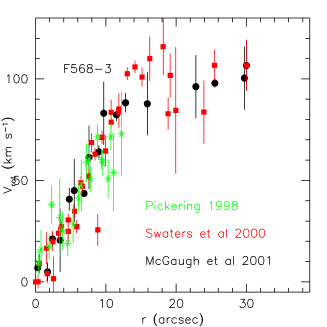
In other words, pointing effects, though of course present in the data to a small degree, are by no means enough to challenge the observations. As a picture can say more than a thousand words, we illustrate this by comparing rotation curves of LSB galaxies observed by different independent groups at different times with different telescopes. There is now enough data in the literature that this can be done for over a dozen LSB galaxies. Space does not allow us to present all galaxies here (see de Blok et al. 2003 for more comparisons), but we illustrate with two examples: LSB galaxies F583-1 and F568-3 (Fig. 1). The latter has even been observed by three independent groups. To avoid confusion due to mixing of H and HI data (as discussed below) we compare the raw H data only. It is obvious that within the error bars the data agree beautifully. Many of these curves are now starting to be confirmed by high-resolution 2-D velocity fields (e.g., Chemin et al., this volume). This would be quite a fluke if systematic errors really were dominant. In summary, the data are consistent.
2.2. Likelihood
If the overwhelming majority of observational data are consistent with each other and therefore with dark matter cores, how does this explain the often-cited statement usually attributed to Swaters et al. (2003) that LSB rotation curves are consistent with NFW halos? The Swaters et al. analysis actually does not claim this in such strong terms. Its strongest statement in this respect is that 75% of the galaxies in their sample are “consistent” with a NFW model. What this means is made clear at the end of the Swaters et al. paper: “Even though the majority of the galaxies in this sample seem consistent with steep inner slopes, none of the galaxies require halos with , as most galaxies are equally well or better fitted by halos with shallower density profiles or even constant density cores.” How one interprets this statement depends only on whether one prefers the mode of a distribution as representative (without the need to invoke systematic effects), or the extremes of that distribution along with an epicyclic range of systematics. Here Occam’s Razor has often proved to be invaluable.
2.3. Clean Sample
The rotation curves in the literature span a large range in resolution, inclination, and general quality. It is therefore worth asking whether the data may in any way be affected by the effects of bars, non-minimum disc situations, resolution effects, etc. We thus isolate the highest quality rotation curves from the total sample from de Blok et al. (2001a) and de Blok & Bosma (2002) (the open histogram in Fig. 2 [left panel]). We have applied the following cuts: (1) we remove all galaxies with inclinations and (single hatched histogram); (2) We remove all galaxies with low-quality rotation curves, i.e. with a small number of independent data points, with large error-bars, and large asymmetries (double hatched histogram); (3) Galaxies which were clearly not dominated by dark matter (e.g. with bulges) were removed; (4) As the difference between cusp and core is most clearly visible in the innermost part of the galaxies, we demand that the inner part is resolved: we retain only those galaxies that have at least 2 independent data points in the inner 1 kpc (grey filled histogram). This leaves us with a final sample of 19 galaxies, out of over 80 originally.
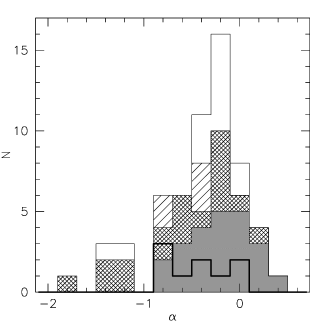
A comparison of the different stages of pruning shows no systematic differences between the distributions of the initial full sample and final restricted sample. If anything, the peak of the distribution of inner slopes has shifted towards a more positive value. The tail towards steep negative slopes has disappeared.
As described above, an analysis by Swaters et al. (2003) finds that the slopes in their sample cover the full range , with a preference for shallow slopes. Below we show that a large fraction of the steep slopes are actually due to insufficient resolution. We have thus subjected their data to the same quality criteria that we used for ours. The results are over-plotted in Fig. 2 (left panel; thick line). The number of remaining galaxies in the Swaters et al. sample is small, but it is clear that the distribution is entirely consistent with our larger restricted sample.
Our restricted sample has three galaxies in common with their restricted sample. We find that for two of these galaxies the measured slopes are consistent at better than (UGC 731 and UGC 4325). For one galaxy (UGC 11557) the slopes differ significantly: they find , while we find . An inspection of the density profiles in Fig. 1 of de Blok et al. (2001b) and Fig. 5 in Swaters et al. (2003) shows that this difference in slope is entirely due to the range over which the slope is measured. The data themselves are consistent. Swaters et al. (2003) have chosen a larger fitting range, resulting in a much steeper slope. Choosing a smaller range results in identical slopes. This comparison of restricted samples shows that once a proper pruning is made to only include minimum-disc, well-resolved galaxies, most of the differences are merely a matter of semantics. The observed shallow inner mass-density slopes of LSB and dwarf galaxies do therefore reflect these galaxies’ potentials.
2.4. Minimum disc
As described in de Blok et al. (2001b) the inversion from rotation curve to mass-profile is only valid in the limit of spherical halos consisting only of dark matter. The last assumption is known as “minimum disc” and has been used in all rotation curve inversions described here. The minimum disc assumption ascribes all dynamics and all mass to the dark matter component, and is thus really a “maximum halo” model. As such it gives strong upper limits on the measured dark matter slopes.
A proper treatment of non-minimum disc models should include the influence that dark and visible matter have on each other in the disc, but to first order we can derive the rotation curve under a non-minimum disc assumption and invert this curve. This should give an indication of the change in inferred dark matter slopes when going from a one-component to a two or three component mass model.
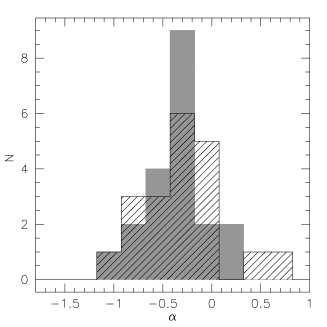
We have done this for the rotation curves in de Blok et al. (2001a) for which photometry and HI data were available, and have derived the halo rotation curves assuming . The dark matter mass-density slopes found in this way are shown in Fig. 2 (right panel), where they are compared with the minimum-disc slopes for the same galaxies. The peak of the slope histogram is still found near , showing that LSB galaxies are indeed dark matter dominated. The bulk of the distribution has shifted to more positive slopes, making the discrepancy with the predicted value larger. It is important to realise that in more sophisticated models one has to take into account that the halo reacts to the presence of a disc by contracting slightly. This means that the original “cosmological” dark matter slopes must have been even less steep than the ones currently measured.
3. Comparing with simulations
3.1. Apples and Oranges
Despite the overwhelming evidence that measuring rotation curves is a reliable and repeatable exercise, claims do sometimes appear in the literature suggesting the opposite. In every one of these cases though, not all aspects of the data and their limitations are taken into account, which often leads to comparing apples with oranges.
A comparison of two datasets of UGC 4325 in Hayahshi et al. (2003) suffers from this. One of them, from de Blok & Bosma (2002), is a processed (smoothed) H-only rotation curve. The second data set is taken from Swaters et al. (2003) and consists of raw H data combined with processed HI data. Hayashi et al. (2003) compare both sets and point out the different nature of the error bars in both sets (as one would expect given the different natures of the data sets; however, it leads them to reject the use of in data analysis). They fail to take into account that the outer points of the Swaters et al. rotation curve are determined by HI, not H, which leads to an entirely different weighting of the data. All this leads to an inappropriate and apparently unfavourable comparison.
Comparing like with like, for example by comparing the raw Swaters et al. H data with the raw de Blok & Bosma H data we see none of these glaring disagreements (Bosma, this volume). Similarly, a comparison of the raw de Blok & Bosma H data with the raw Swaters et al HI data (as shown in de Blok & Bosma 2002) also shows good agreement.
The lesson to be drawn from this, is that data are not as black-and-white as theoretically motivated comparisons sometimes portray. Data are not just “good” or “bad”; they may be both, depending on the situation in which they are used. It is vital to be aware of the limitations. In every large collection of data it is always possible to find the odd one out (which is precisely why one collects large data sets). For LSB rotation curves, when proper comparisons are made, agreement is almost always found. This may explain why virtually all observational papers agree on the inappropriateness of the NFW fitting formula for describing LSB galaxy dynamics (contributions by, amongst others, Bolatto, Chemin, Zachrisson, Pizella, Gentile, this volume).
3.2. The limit of simulations
In this context, it is instructive to compare the new high-resolution simulations by White and Navarro (this volume) and Hayashi et al. (2003) with observations. These authors present new high-resolution simulations of dark matter halos in a CDM universe. These are now becoming just resolved enough to start probing the regime of dwarf and LSB galaxies, however, they also show the large gap that still exists between simulations and observations.
Observationally, we can plot the inner mass density slope against resolution of a rotation curve. Such a diagram (Fig. 3) clearly shows that at high resolutions ( kpc) the core and cusp model can be clearly distinguished from each other, but that that at low resolutions kpc the cusp model and the core model have identical slopes (de Blok et al. 2001b). Using Fig. 4 in Hayashi et al. (2003) we have computed the values for their simulations and show the corresponding slopes in Fig. 3.
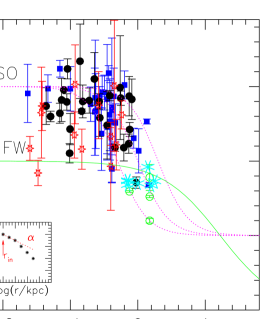
The smallest scales these new simulations resolve are kpc, which is exactly the scale below which the core/cusp discrepancies become apparent. For now, the current models fall solidly in the range where the core and cusp models make identical predictions.
Going back to the original NFW papers (NFW 1996,1997) one sees that these older simulations also did not resolve scales smaller than 1 kpc. However, the discussion in these papers sometimes make it all too easy to forget this limitation. For example, NFW (1996) states ‘The density profiles of CDM halos of all masses can be well fitted by an appropriate scaling of a “universal” profile with no free shape parameters’ (emphasis added) and the same paper presents an analysis of NFW rotation curves comparing them directly to those of dwarf galaxies. One can see how they would have provided an impetus for the cusp/core debate.
Simulations thus need to improve by another order of magnitude in resolution before the predictions become relevant for the observational regime currently probed. In summary, current simulations do not yet tell us anything about the nature of dark matter at scales kpc.
4. The future
The study of the distribution of dark matter within the visible discs of galaxies is now clearly driven by observations. Increases in computing power will at some stage resolve the inner kpc in simulations as well, but given the “coldness” of CDM and its lack of cross-section it is unlikely that the slopes will decrease in the dark-matter-only simulations (unless of course the properties of the dark matter particle are changed). It is thus interesting to note that the problems of CDM only become clear on length scales where the baryons start playing a role (this applies to both the cusp/core problem as well as the missing dwarfs problem). This indicates that baryon physics is one of the missing pieces of the puzzle, and will very likely make a major contribution toward a solution (see, for example, Sancisi, this volume).
Can observations of galaxy dynamics at scales larger than a kpc, where the simulations do have predictive power and baryons may be unimportant, help resolve the issue? The answer to this is yes and no. CDM makes a robust prediction that the density of matter should drop off as at large radii in galaxies. However, finding such a drop-off is not so much a triumph for CDM, as it is a triumph for gravity. The behavior of dark matter at large scales is simply the behaviour of any pressure-less medium under the influence of gravity. The success of large-scale structure simulations has shown that at large scales this is exactly how dark matter behaves. An drop-off does not tell us how dark matter behaves at small scales and large densities. Maybe the observed dark matter cores are telling us that dark matter has pressure at small scales. Maybe dark matter is not cold at these scales. Maybe they tell us something unexpected. The centers of galaxies are the only places where we can study dark matter under these conditions. It would thus be unwise to ignore the conclusions forced upon us by the data.
5. Conclusions
-
•
The available data overwhelmingly prefer soft cores.
-
•
There is a large range in inner slopes. Observationally there is no evidence for a “universal profile”.
-
•
Systematic effects play no significant rôle.
-
•
Observations probe a regime where simulations have no predictive power (yet).
-
•
Crucial (baryon) physics are still missing from the simulations.
References
de Blok, W. J. G., Bosma, A., McGaugh, S. 2003, MNRAS, 340, 657
de Blok, W. J. G. Bosma, A. 2002, A&A, 385, 816
de Blok, W. J. G., McGaugh, S. S., Rubin, V. C. 2001a, AJ, 122, 2396
de Blok, W. J. G., McGaugh, S. S., Bosma, A., Rubin, V. C. 2001b, ApJ, 552, L23
de Blok, W. J. G. McGaugh, S. S. 1997, MNRAS, 290, 533
Hayashi, W., Navarro, J.F., Power, C., Jenkins, A.R., Frenk, C.S., White, S.D.M., Springel, V., Stadel, J., Quinn, T.R., 2003, MNRAS, submitted (astro-ph/0310576)
Marchesini, D., D’Onghia, E., Ch incarini, G., Firmani, C., Conconi, P., Molinari, E., Zacchei, A., 2002, ApJ, 5 75, 801
McGaugh, S. S., Rubin, V. C., de Blok, W. J. G. 2001, AJ, 122, 2381
Navarro, J.F., Frenk., C.S., White, S.D.M., 1996, ApJ, 462, 563
Navarro, J.F., Frenk, C.S., White, S.D.M., 1997, ApJ, 490, 493
Pickering, T. E., Navarro, J. F., Rix, H.-W., Impey, C. D. 1998, ASP Conf. Ser. 136: Galactic Halos, 199
Swaters, R. A., Madore, B. F., van den Bosch, F. C., Balcells, M. 2003, ApJ, 583, 732
Swaters, R. A., Madore, B. F., Trewhella, M. 2000, ApJ, 531, L107